
Briefly: In our opinion, no speculative positions are justified.
Our intraday outlook is neutral, and our short-term outlook is neutral. Our medium-term outlook remains bearish, as the S&P 500 index extends its lower highs, lower lows sequence:
Intraday outlook (next 24 hours): neutral
Short-term outlook (next 1-2 weeks): neutral
Medium-term outlook (next 1-3 months): bearish
Long-term outlook (next year): neutral
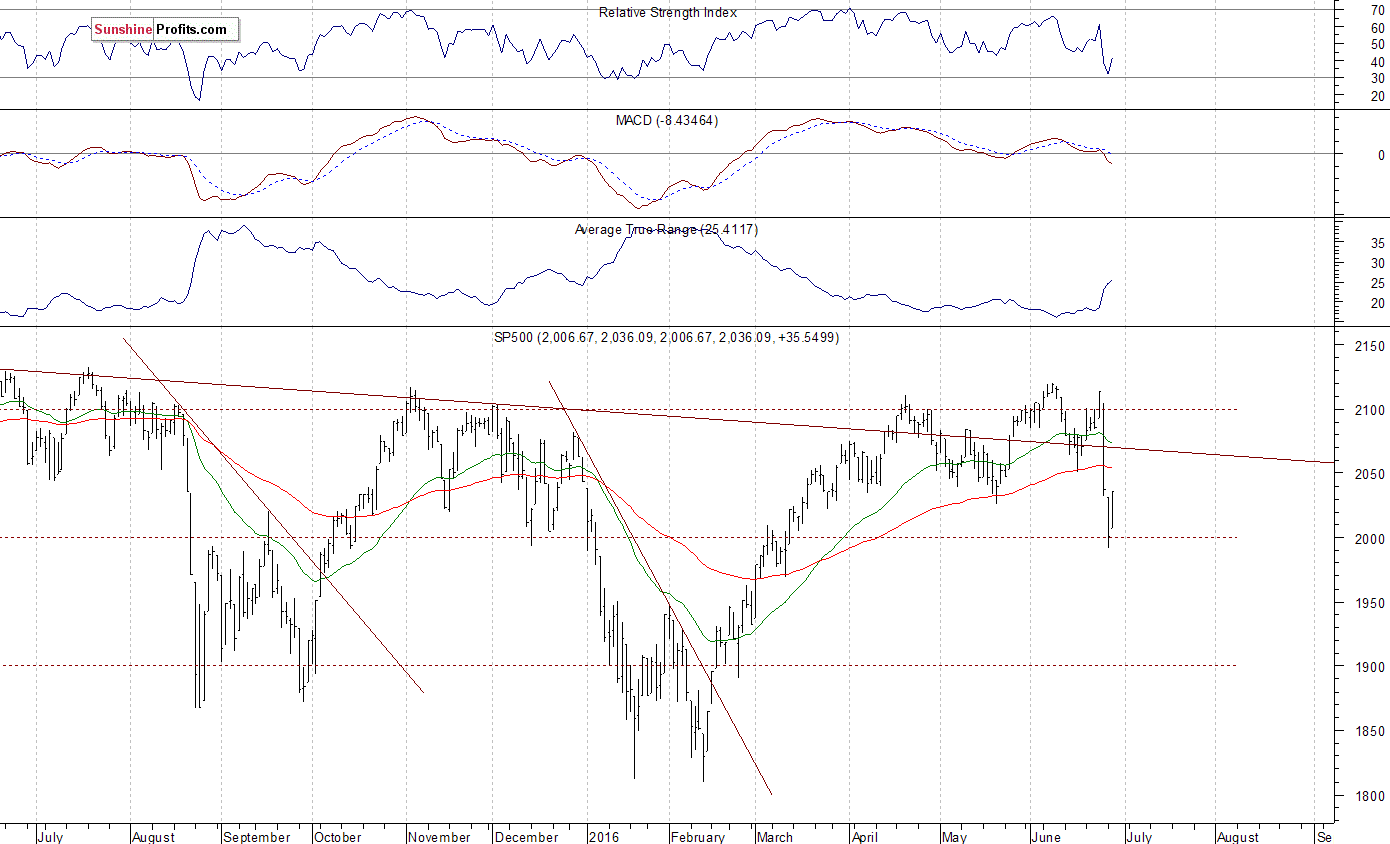
The U.S. stock market indexes gained 1.6-2.1% on Tuesday, retracing some of their recent selloff, as investors reacted to economic data announcements, among others. The S&P 500 index bounced off support level at around 2,000, before closing above Tuesday's daily gap down of 2,031.45-2,032.57. The next important level of resistance is at 2,050, marked by previous level of support. On the other hand, support level is at 2,020-2,025, among others. Last year's highs along the level of 2,100 continue to act as medium-term resistance level. Is this some long-term topping pattern or just medium-term consolidation following a rebound off February low?
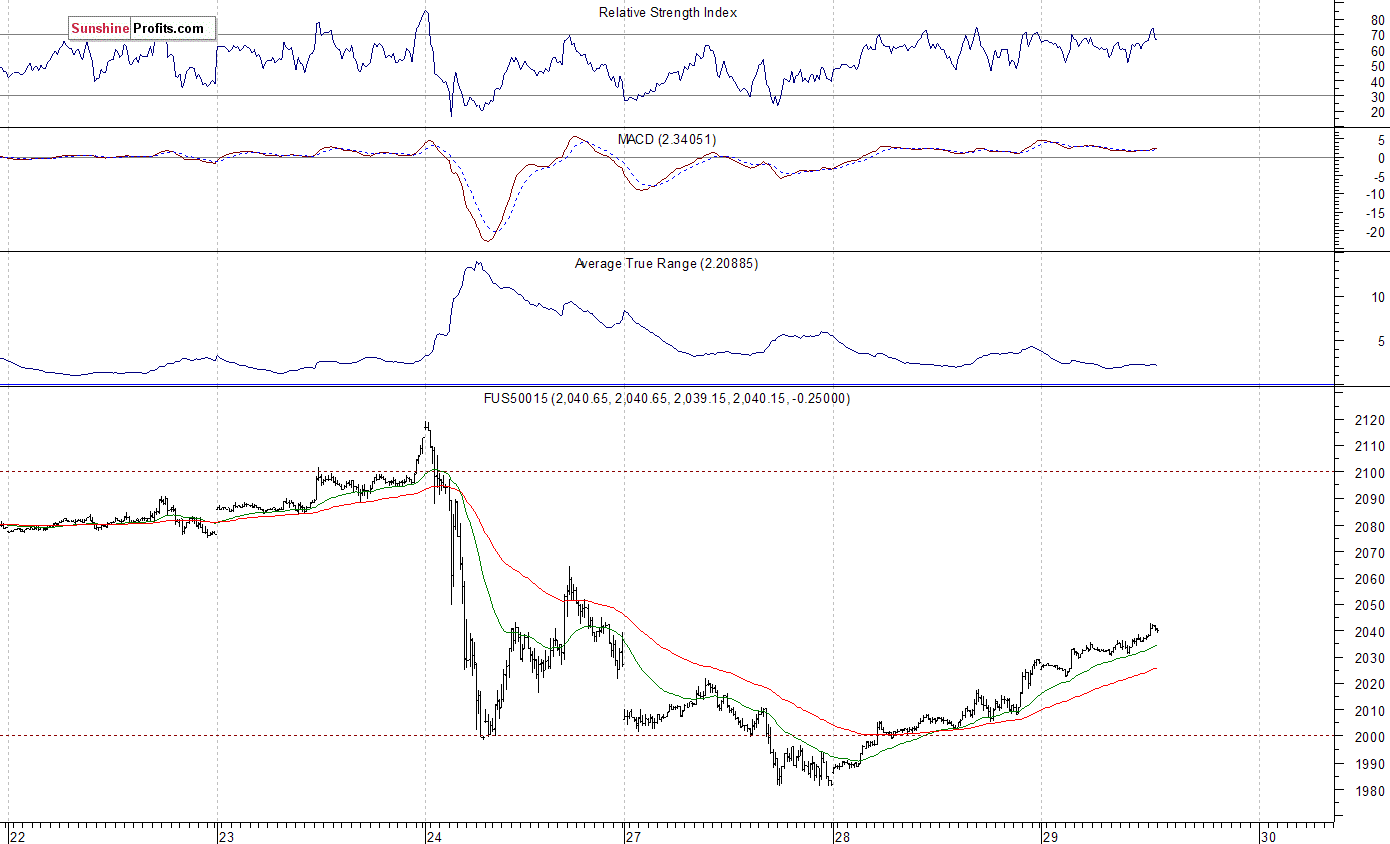
Expectations before the opening of today's trading session are positive, with index futures currently up 0.5-0.6%. The European stock market indexes have gained 1.9-2.5% so far. The S&P 500 futures contract trades within an intraday uptrend, as it extends its yesterday's rebound. The nearest important level of support is at 2,010-2,020, and the next support level remains at 1,980-2,000, marked by short-term local lows. On the other hand, resistance level is at around 2,050-2,065, among others, as we can see on the 15-minute chart:
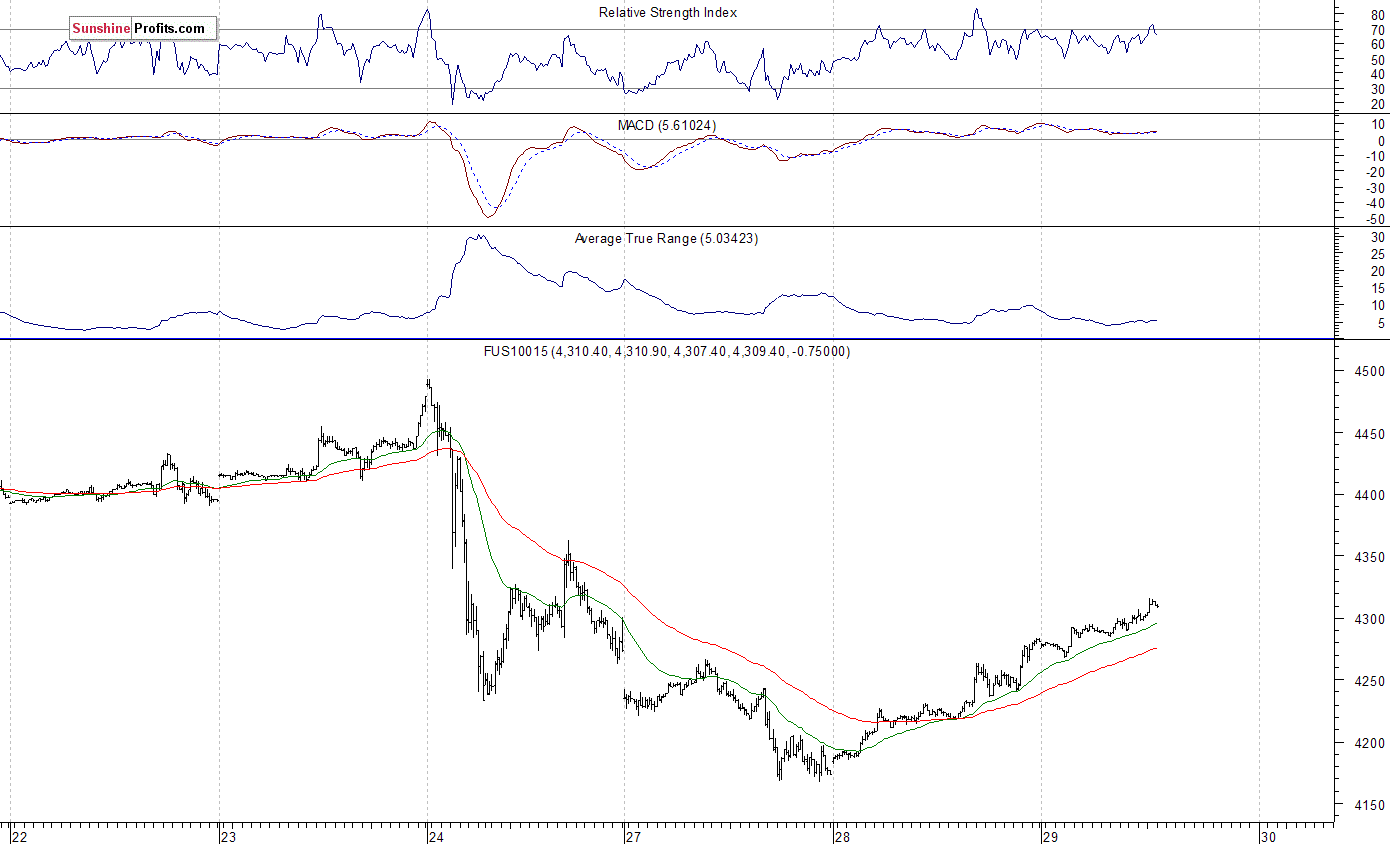
The technology Nasdaq 100 futures contract follows a similar path, as it continues its short-term uptrend. The nearest important support level is at 4,250-4,270, and potential resistance level is at around 4,350-4,360, marked by recent local high, as the 15-minute chart shows:
Concluding, the broad stock market retraced some of its recent move down yesterday, as investors hunted price bargains. For now, it looks like an upward correction following recent selloff. We decided to close our speculative short position (opened on June 1 at 2,093.94 - S&P 500 index) at the opening of Friday's trading session - the average opening price of the S&P 500 index was at 2,060. Overall, we gained around 34 index points on that trade. Currently, we prefer to be out of the market, avoiding low risk/reward ratio trades. We will let you know when we think it is safe to get back in the market.
Thank you.
Paul Rejczak
Stock Trading Strategist
Stock Trading Alerts

