

Briefly: In our opinion, no speculative positions are justified.
Our intraday outlook is neutral, and our short-term outlook is neutral. Our medium-term outlook remains bearish, as the S&P 500 index extends its lower highs, lower lows sequence:
Intraday outlook (next 24 hours): neutral
Short-term outlook (next 1-2 weeks): neutral
Medium-term outlook (next 1-3 months): bearish
Long-term outlook (next year): neutral
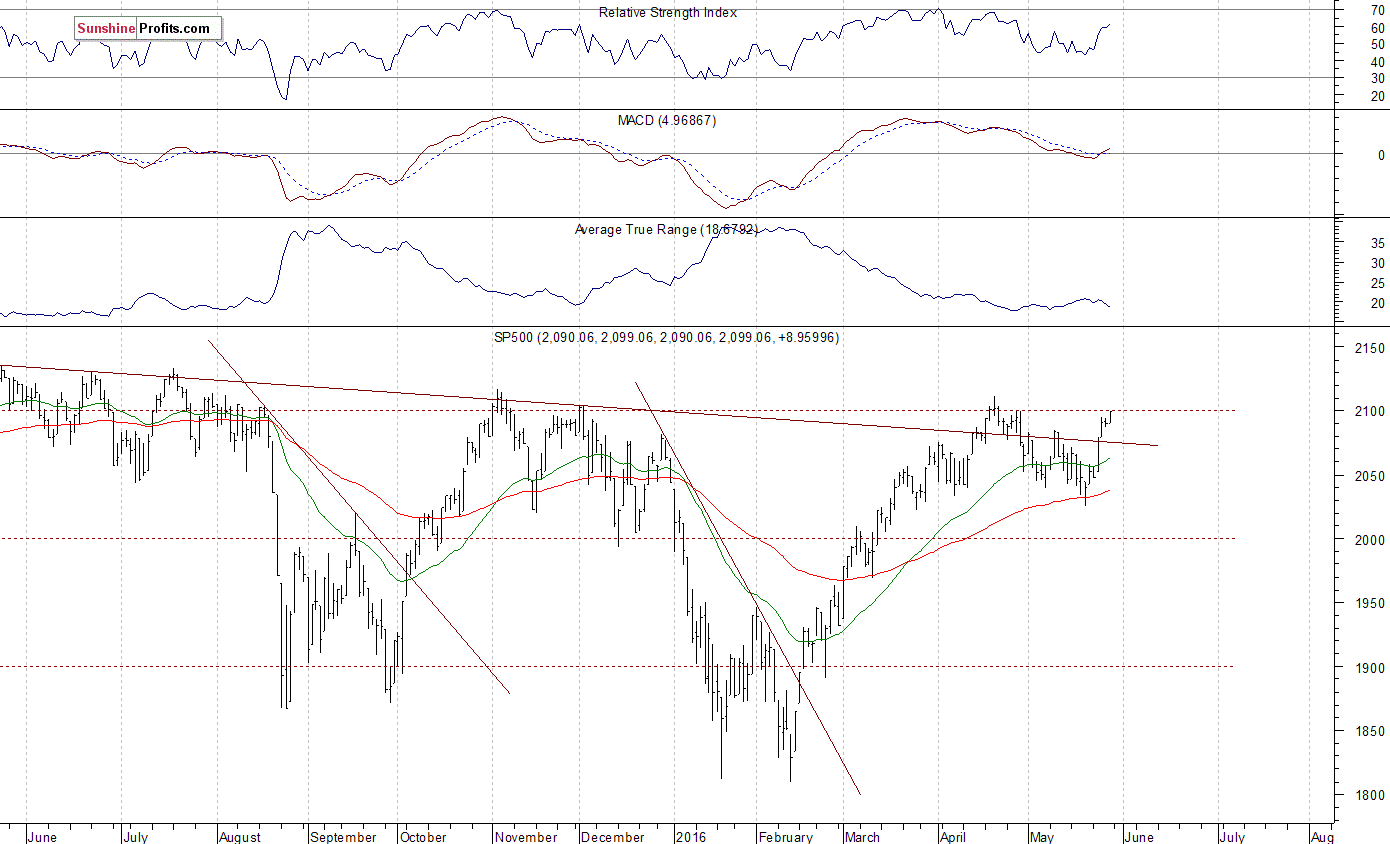
The U.S. stock market indexes gained 0.3-0.6% on Friday, extending their short-term uptrend, as investors reacted to some economic data releases, among others. The S&P 500 index got closer to its April local high of 2,111.05. The nearest important level of resistance is at 2,110-2,115. The next resistance level is at around 2,130, marked by last year's all-time high of 2,134.72. On the other hand, support level is at 2,070-2,085, marked by previous level of resistance. The next important level of support is at 2,030-2,050. Last year's highs along the level of 2,100 continue to act as medium-term resistance level. Will the market break above these medium-term highs and continue its seven-year long bull market?
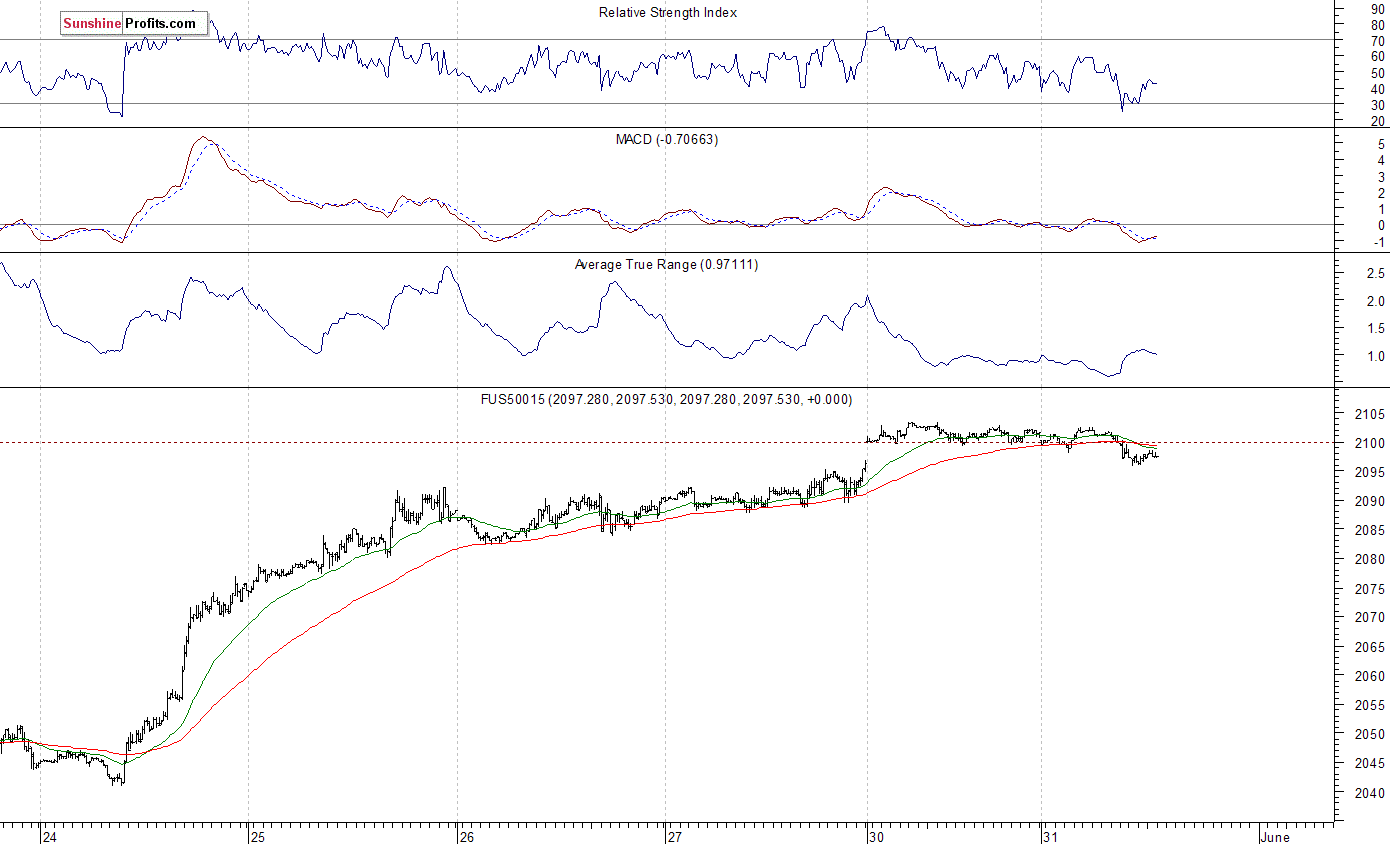
Expectations before the opening of today's trading session are slightly negative, with index futures currently down 0.1-0.2%. The main European stock market indexes have lost 0.1-0.3% so far. Investors will now wait for series of economic data announcements: Personal Income, Personal Spending, PCE Prices number at 8:30 a.m., Case-Shiller 20-city Index at 9:00 a.m., Chicago PMI at 9:45 a.m., Consumer Confidence at 10:00 a.m. The S&P 500 futures contract trades within an intraday downtrend, following its yesterday's move up. The nearest important level of resistance remains at around 2,100-2,105. On the other hand, support level is at 2,090-2,095, among others. There have been no confirmed negative signals so far. For now, it looks like a correction following short-term uptrend:
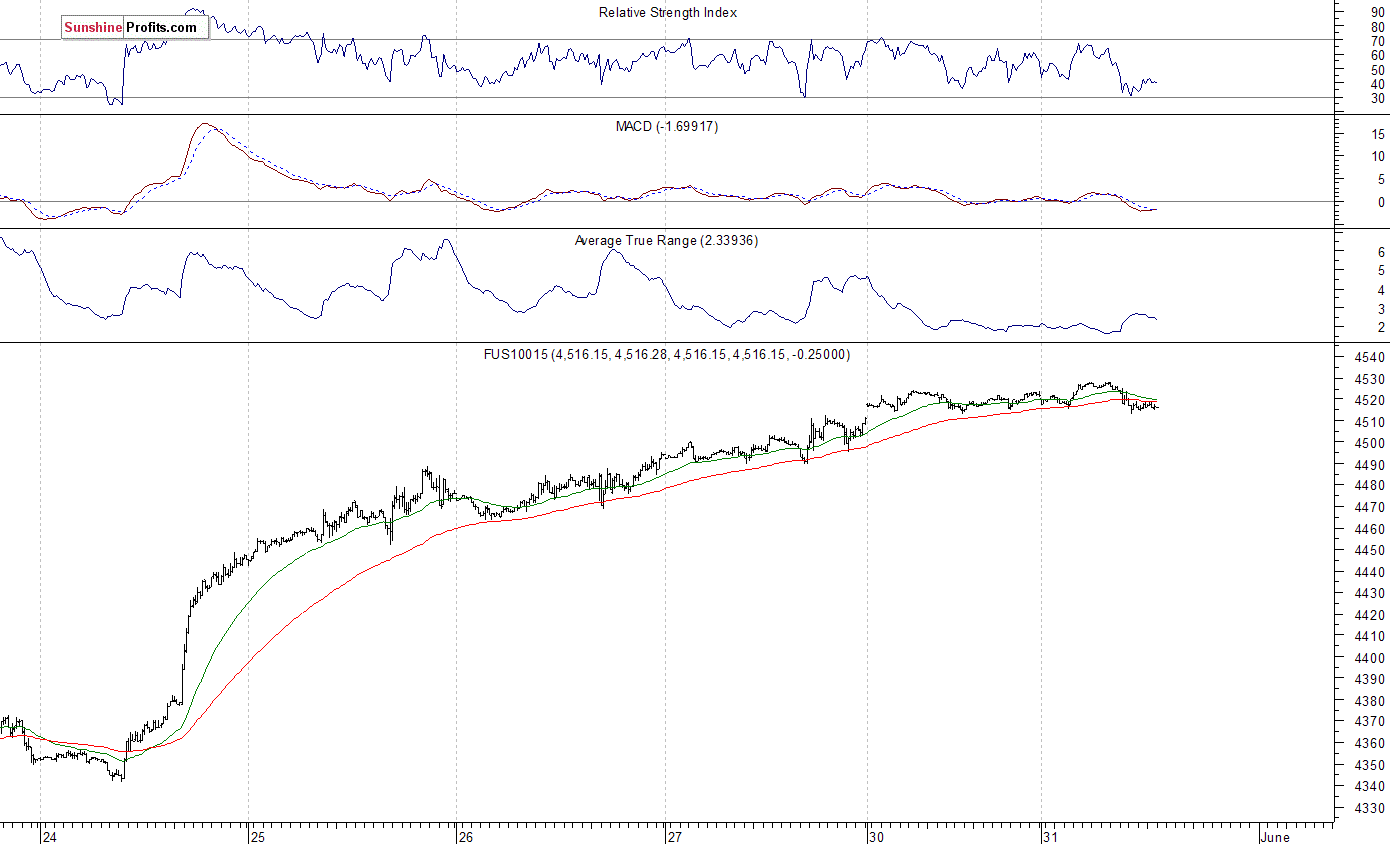
The technology Nasdaq 100 futures contract follows a similar path, as it retraces some of its recent move up. The nearest important level of resistance is at around 4,520-4,530. On the other hand, support level is at 4,500 mark, and the next important level of support is at 4,480-4,490, marked by some previous local lows, as we can see on the 15-minute chart:
Concluding, the broad stock market extended its short-term uptrend on Friday, as the S&P 500 index got close to 2,100 mark. The index is relatively close to last year's medium-term highs along the level of 2,100. But will it continue its seven-year long bull market and break above last May's all-time high? We still prefer to be out of the market, avoiding low risk/reward ratio trades. We will let you know when we think it is safe to get back in the market.
Thank you.
Paul Rejczak
Stock Trading Strategist
Stock Trading Alerts

