

Briefly: In our opinion, no speculative positions are justified.
Our intraday outlook is neutral, and our short-term outlook is neutral. Our medium-term outlook remains bearish, as the S&P 500 index extends its lower highs, lower lows sequence:
Intraday outlook (next 24 hours): neutral
Short-term outlook (next 1-2 weeks): neutral
Medium-term outlook (next 1-3 months): bearish
Long-term outlook (next year): neutral
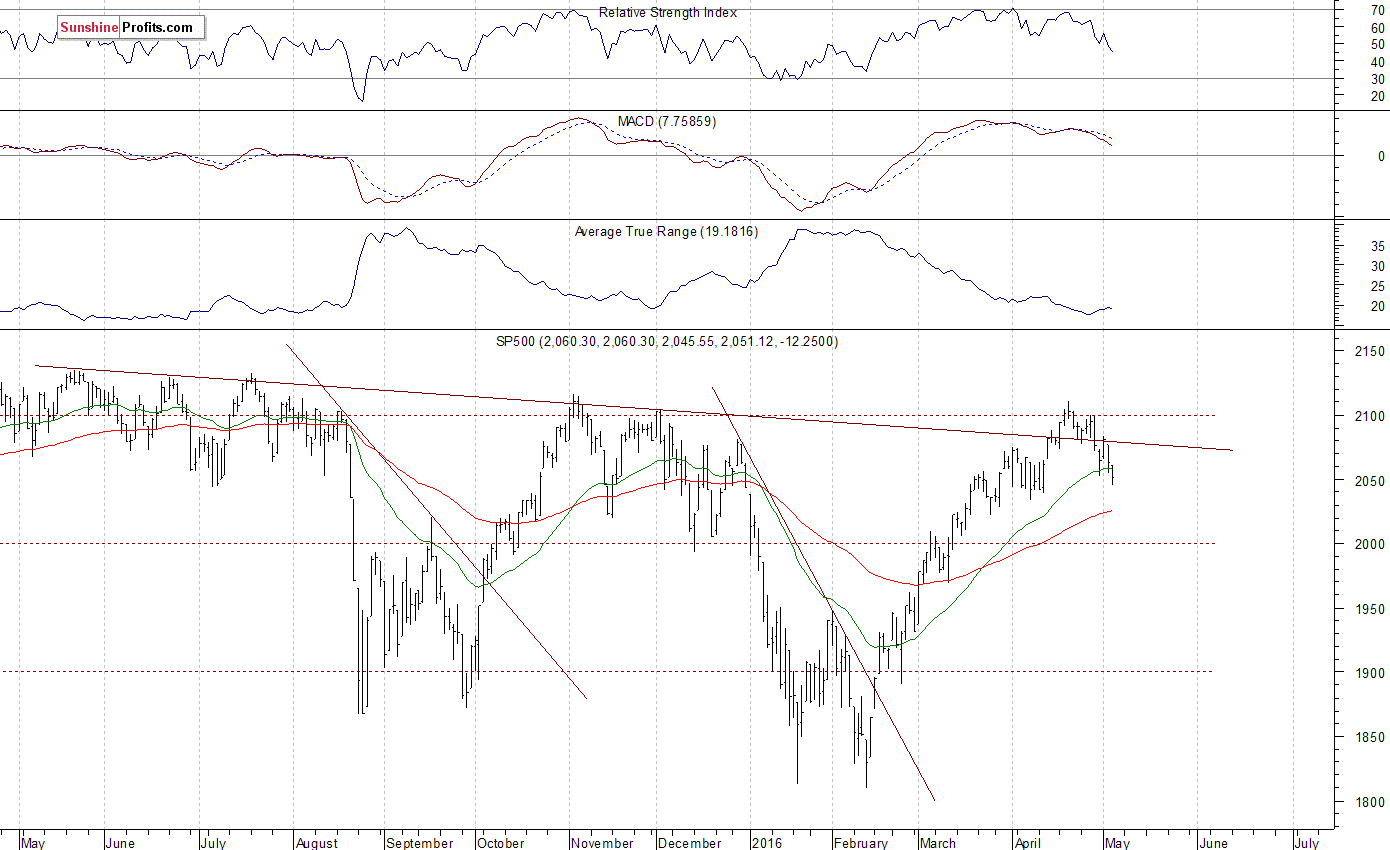
The U.S. stock market indexes lost 0.6-0.7% on Wednesday, extending their short-term downtrend, as investors reacted to economic data releases, among others. The S&P 500 index remains close to its support level of 2,050. The next important level of support is at around 2,030-2,035, marked by some previous local lows. On the other hand, resistance level is at 2,070-2,075, marked by the recent consolidation. The next level of resistance remains at 2,100-2,115, marked by medium-term local highs. Is this the end of two-month long uptrend? Or is this just correction before another leg up reaching last year's all-time high? Last year's highs along the level of 2,100 continue to act as medium-term resistance level, as we can see on the daily chart:
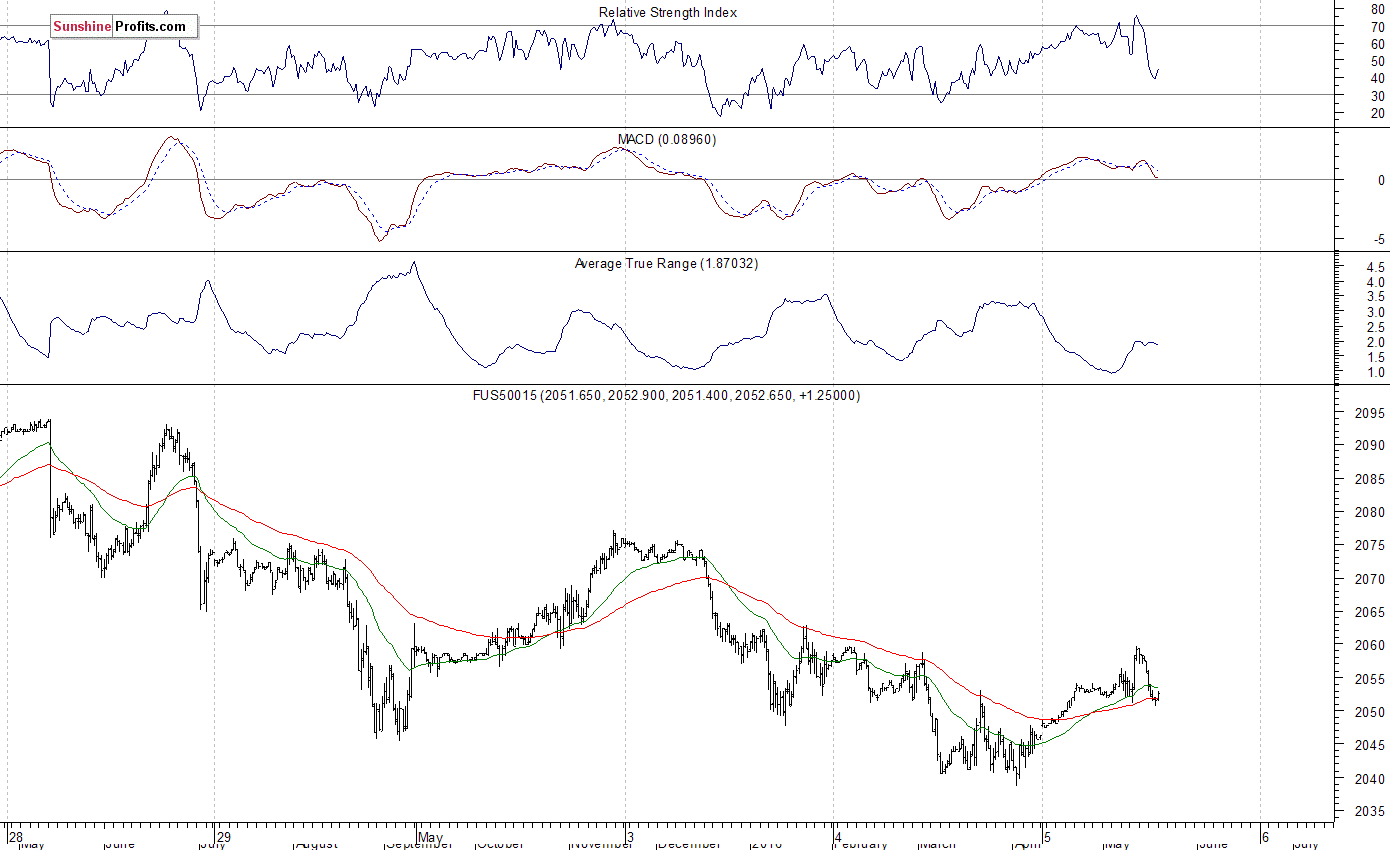
Expectations before the opening of today's trading session are positive, with index futures currently up 0.2-0.3%. The European stock market indexes have been mixed so far. Investors will now wait for the Initial Claims data release at 8:30 a.m., along with tomorrow's Monthly Nonfarm Payrolls number announcement. The S&P 500 futures contract trades within an intraday consolidation, following a rebound off yesterday's low at around 2,040. The nearest important level of resistance is at 2,060, marked by local highs, and support level is at 2,040. The market extends its slightly descending short-term trading channel, as we can see on the 15-minute chart:
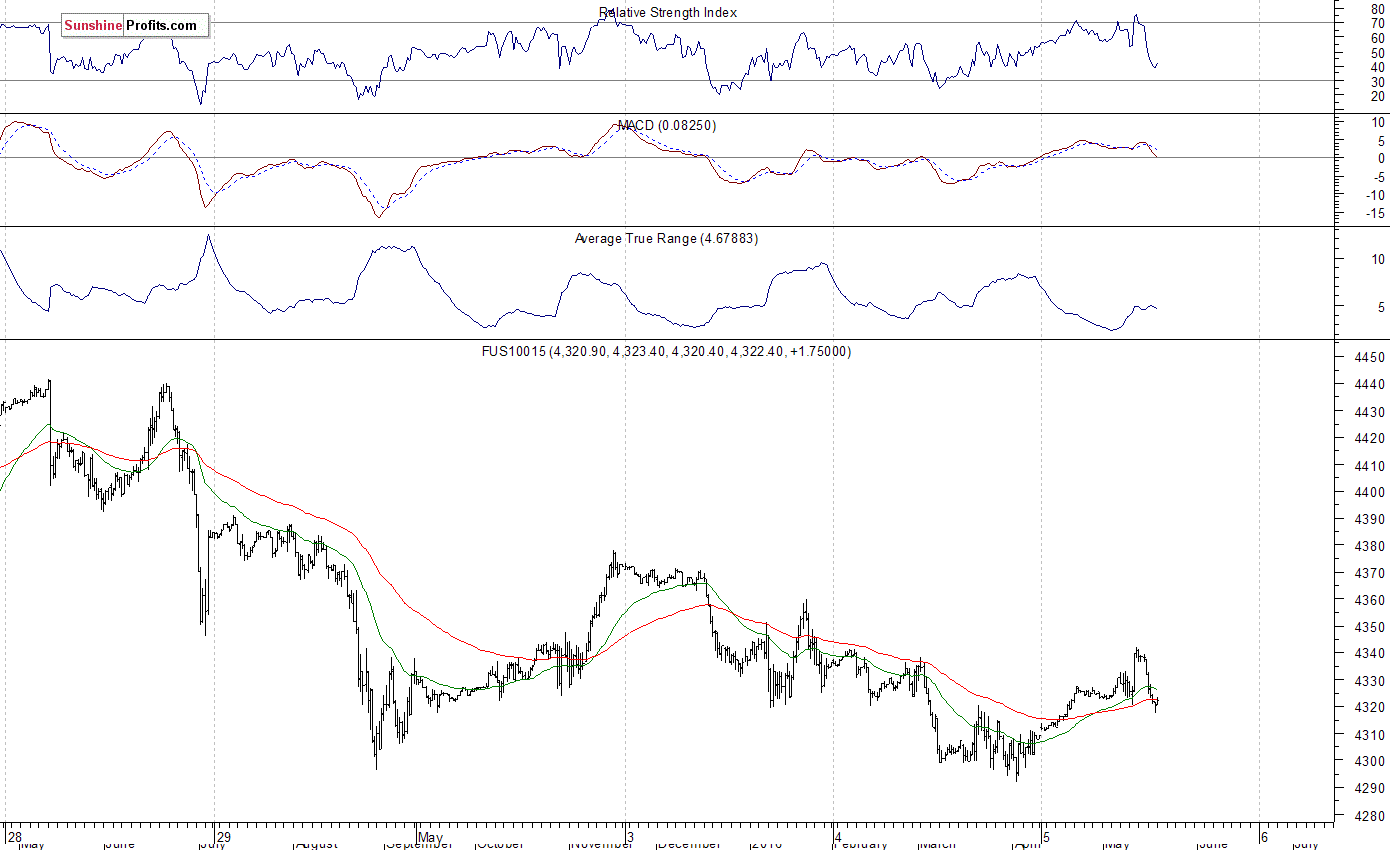
The technology Nasdaq 100 futures contract follows a similar path, as it currently trades above the level of 4,300. The nearest important level of resistance is at 4,340-4,350, marked by recent local highs. The nearest important support level is at 4,290-4,300, as the 15-minute chart shows:
Concluding, the broad stock market slightly extended its short-term downtrend on Wednesday. Is this just a downward correction following over two-month long rally or new medium-term downtrend? The S&P 500 index continues to trade above its late March - early April local lows. For now, it looks like a downward correction, so we prefer to be out of the market, avoiding low risk/reward ratio trades. We will let you know when we think it is safe to get back in the market.
Thank you.
Paul Rejczak
Stock Trading Strategist
Stock Trading Alerts

