
Briefly: In our opinion, no speculative positions are justified.
Our intraday outlook is neutral, and our short-term outlook is neutral. Our medium-term outlook remains bearish, as the S&P 500 index extends its lower highs, lower lows sequence. We decided to change our long-term outlook to neutral recently, following a move down below medium-term lows:
Intraday outlook (next 24 hours): neutral
Short-term outlook (next 1-2 weeks): neutral
Medium-term outlook (next 1-3 months): bearish
Long-term outlook (next year): neutral
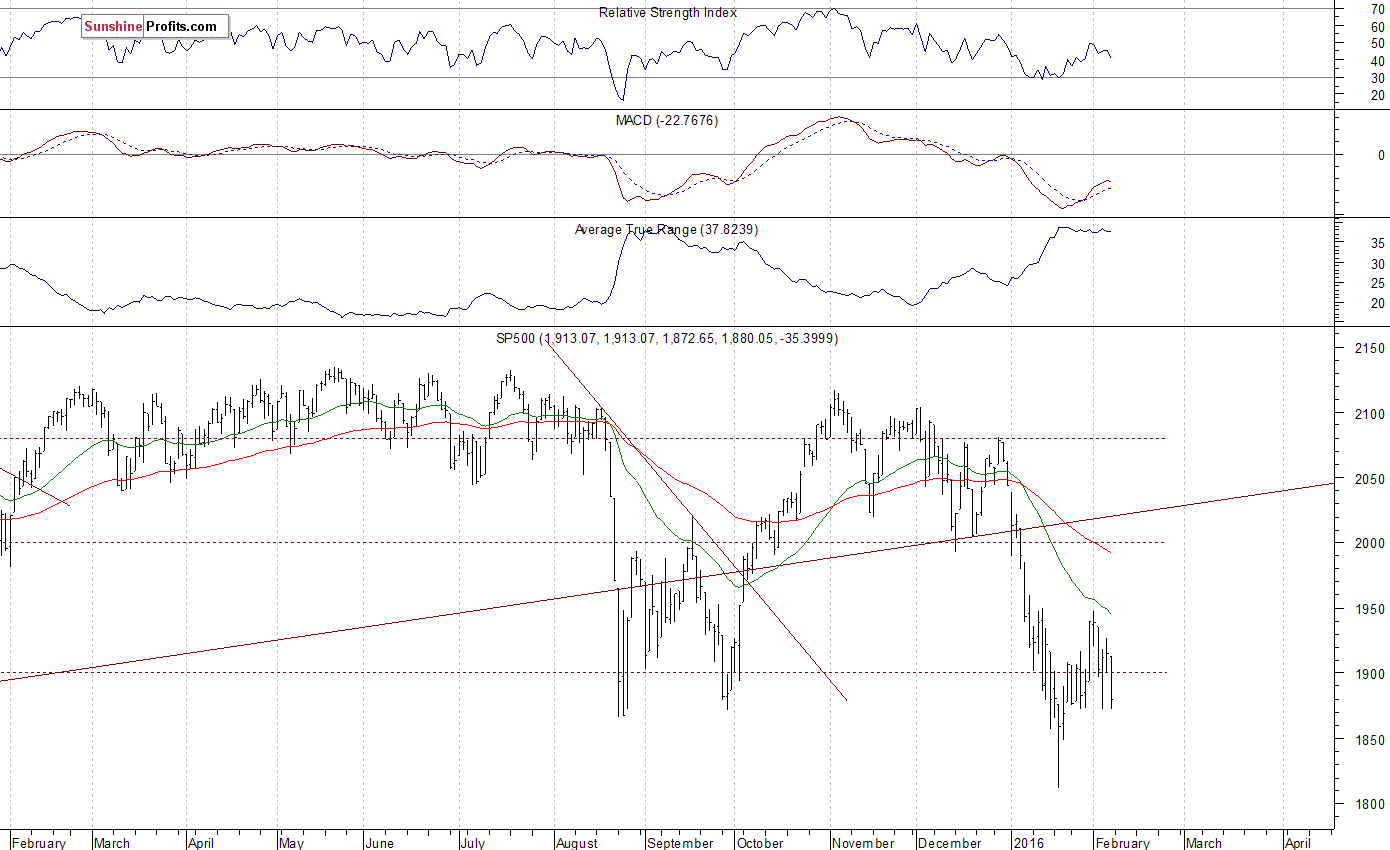
The U.S. stock market indexes lost between 1.3% and 3.4% on Friday, extending their short-term downtrend, as investors reacted to monthly jobs data release, among others. The S&P 500 index broke below the level of 1,900 again, as it got close to support level of 1,870. The next important support level is at around 1,800-1,850, marked by mid-January local low. On the other hand, resistance level is at 1,900. Last year's August - September lows continue to act as a medium-term support level. However, there have been no confirmed positive signals so far. Which direction is next? For now, it looks like a relatively flat correction following January move down, as we can see on the daily chart:
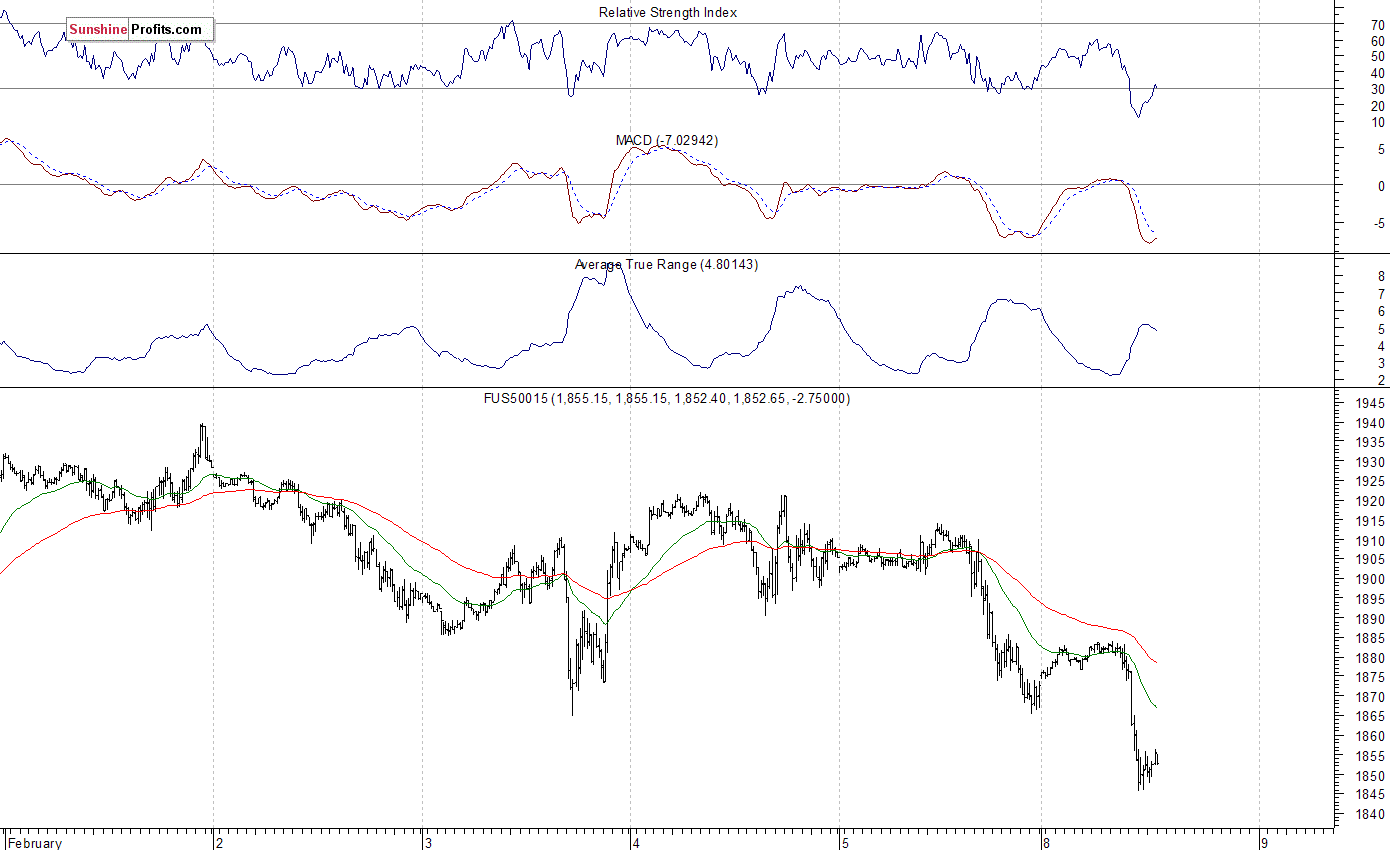
Expectations before the opening of today's trading session are very negative, with index futures currently down 1.1-1.6%. The main European stock market indexes have lost 1.8-2.4% so far. The S&P 500 futures contract trades within an intraday downtrend, following a breakdown below Friday's local low at around 1,865. The nearest important level of resistance is at 1,865-1,885, marked by short-term consolidation. On the other hand, potential support level is at 1,835-1,840, marked by previous local lows. There have been no confirmed short-term positive signals so far, however, we can see some oversold conditions:
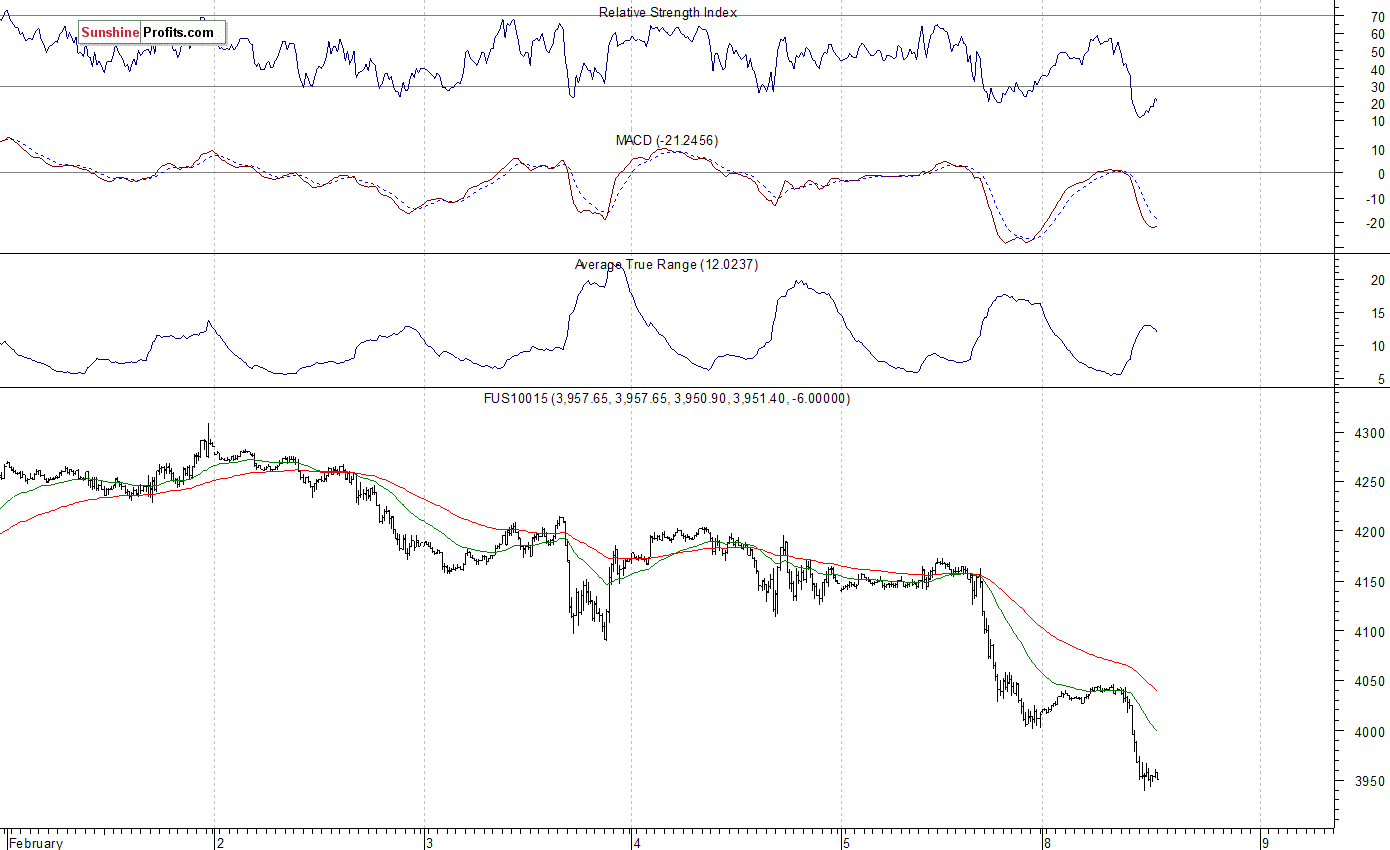
The technology Nasdaq 100 futures contract follows a similar path, as it currently trades below the level of 4,000. The nearest important level of resistance is at 3,980-4,000, and potential support level is at around 3,900, marked by last year's August low. We can see some short-term oversold conditions:
Concluding, the broad stock market sold off on Friday, as investors reacted to monthly jobs report release. Expectations before the opening of today's trading session are very negative, and the index may continue its short-term downtrend. Will it break below its mid-January low of 1,812.29? Or is this just a volatile bottoming consolidation before some more meaningful medium-term downtrend's reversal? For now, the index continues to trade along its last year's August - September local lows, as they act as a medium-term level of support. We still prefer to be out of the market, avoiding low risk/reward ratio trades. We will let you know when we think it is safe to get back in the market.
Thank you.
Paul Rejczak
Stock Trading Strategist
Stock Trading Alerts

