
Briefly: In our opinion, no speculative positions are justified.
Our intraday outlook remains neutral, and our short-term outlook is neutral:
Intraday outlook (next 24 hours): neutral
Short-term outlook (next 1-2 weeks): neutral
Medium-term outlook (next 1-3 months): neutral
Long-term outlook (next year): bullish
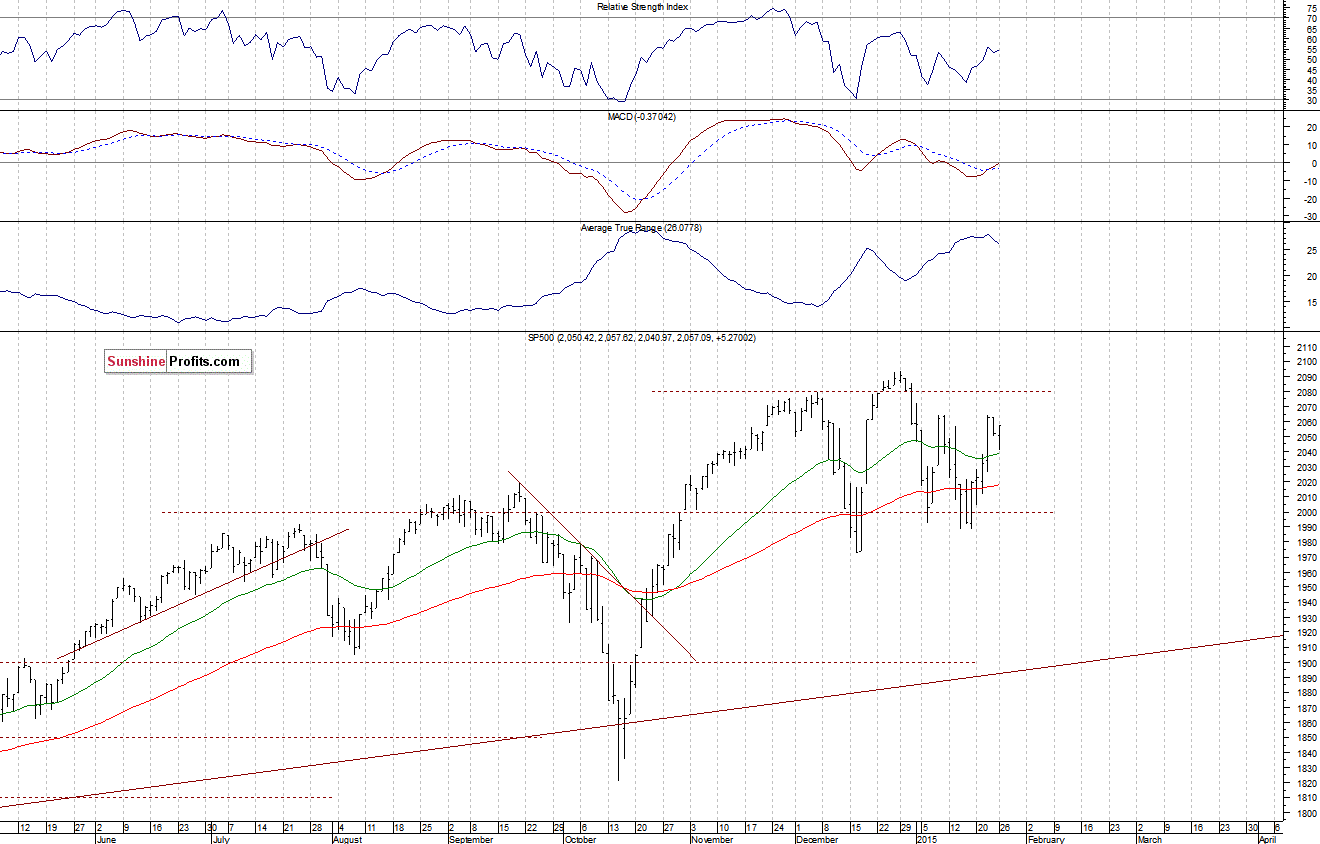
The main U.S. stock market indexes were mixed between -0.1% and +0.3% on Monday, extending their short-term consolidation, as investors continued to hesitate following last week's economic data announcements, quarterly corporate earnings releases. Our yesterday's neutral intraday outlook has proved accurate. The S&P 500 index continues to trade along the level of 2,050. The nearest important level of resistance remains at 2,060-2,065, marked by previous local highs. On the other hand, support level is at 2,020-2,040, among others. There is no clear medium-term direction, as the index is within a three-month long consolidation, following last year's October-November rally:
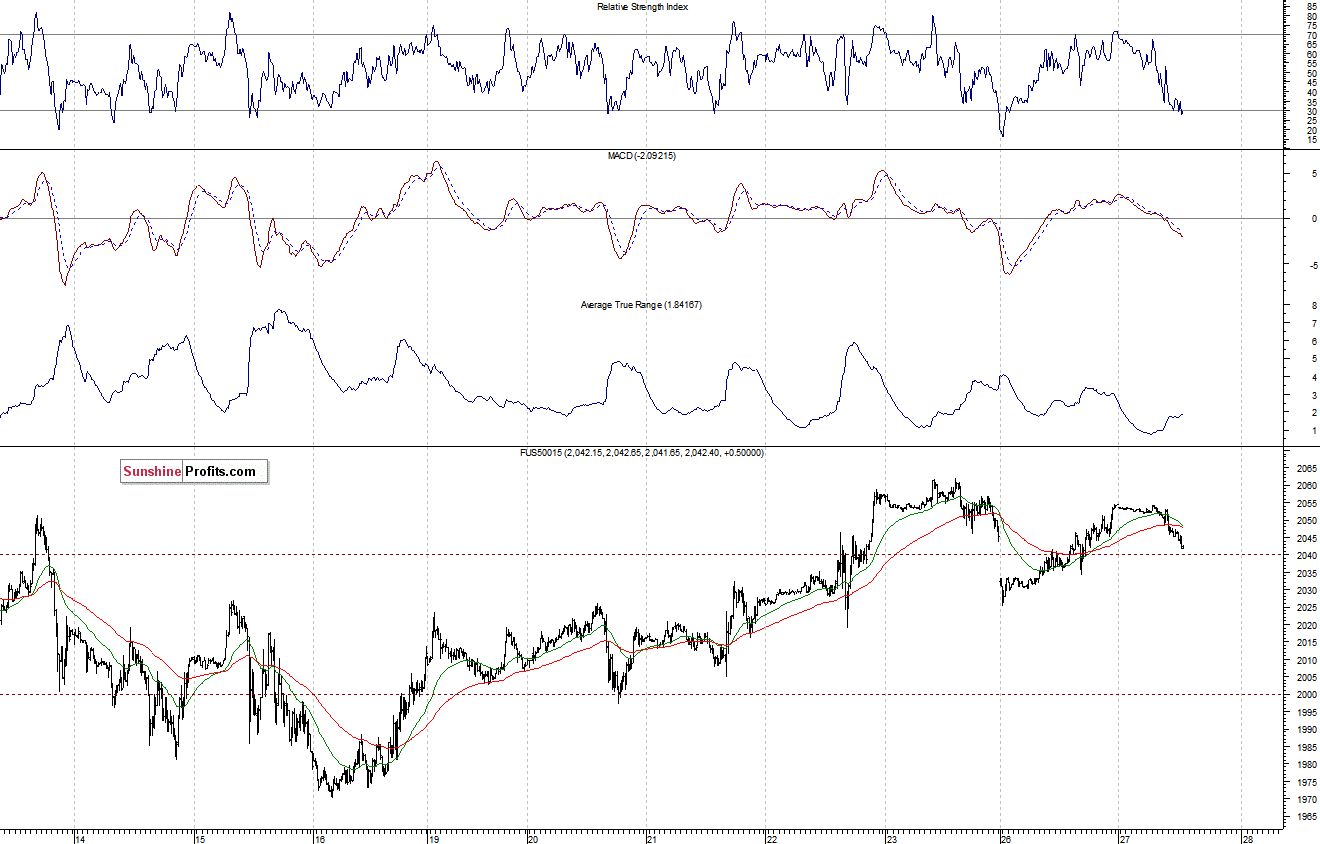
Expectations before the opening of today's trading session are negative, with index futures currently down 0.5%. The European stock market indexes have lost 0.4-0.8% so far. Investors will now wait for some economic data announcements: Durable Orders at 8:30 a.m., Case-Shiller 20-city Index at 9:00 a.m., Consumer Confidence, New Home Sales numbers at 10:00 a.m. The S&P 500 futures contract (CFD) extends its short-term consolidation. The nearest important resistance level is at around 2,050-2,055, marked by local highs. On the other hand, support level is at 2,025-2,030, as we can see on the 15-minute chart:
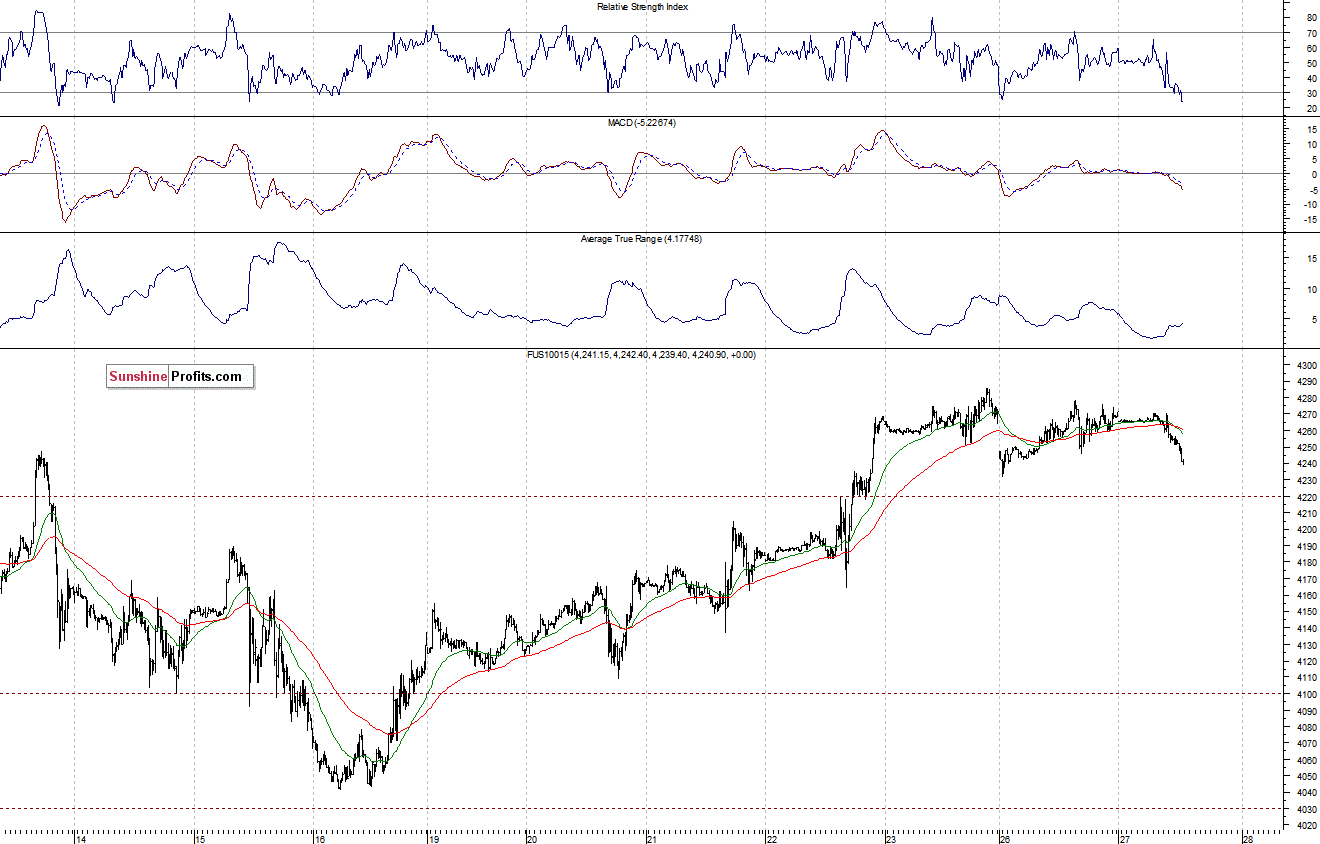
The technology Nasdaq 100 futures contract (CFD) follows a similar path as it trades along the level of 4,250. There is a resistance level at around 4,280-4,300, and support level at 4,230-4,240, as the 15-minute chart shows:
Concluding, the broad stock market extended its short-term fluctuations yesterday, as investors decided to wait on the sidelines ahead of some further quarterly corporate earnings releases, economic data announcements. It continues to look like a volatile medium-term consolidation following last year's October-November rally. We prefer to be out of the market, avoiding low risk/reward ratio trades. We will let you know when we think it is safe to get back in the market.
Thank you.
Paul Rejczak
Stock Trading Strategist
Stock Trading Alerts

