
Briefly: In our opinion, no speculative positions are justified at this moment.
Our intraday outlook is neutral, and our short-term outlook is neutral:
Intraday
(next 24 hours) outlook: neutral
Short-term (next 1-2 weeks) outlook: neutral
Medium-term (next 1-3 months) outlook: neutral
Long-term outlook (next year): bullish
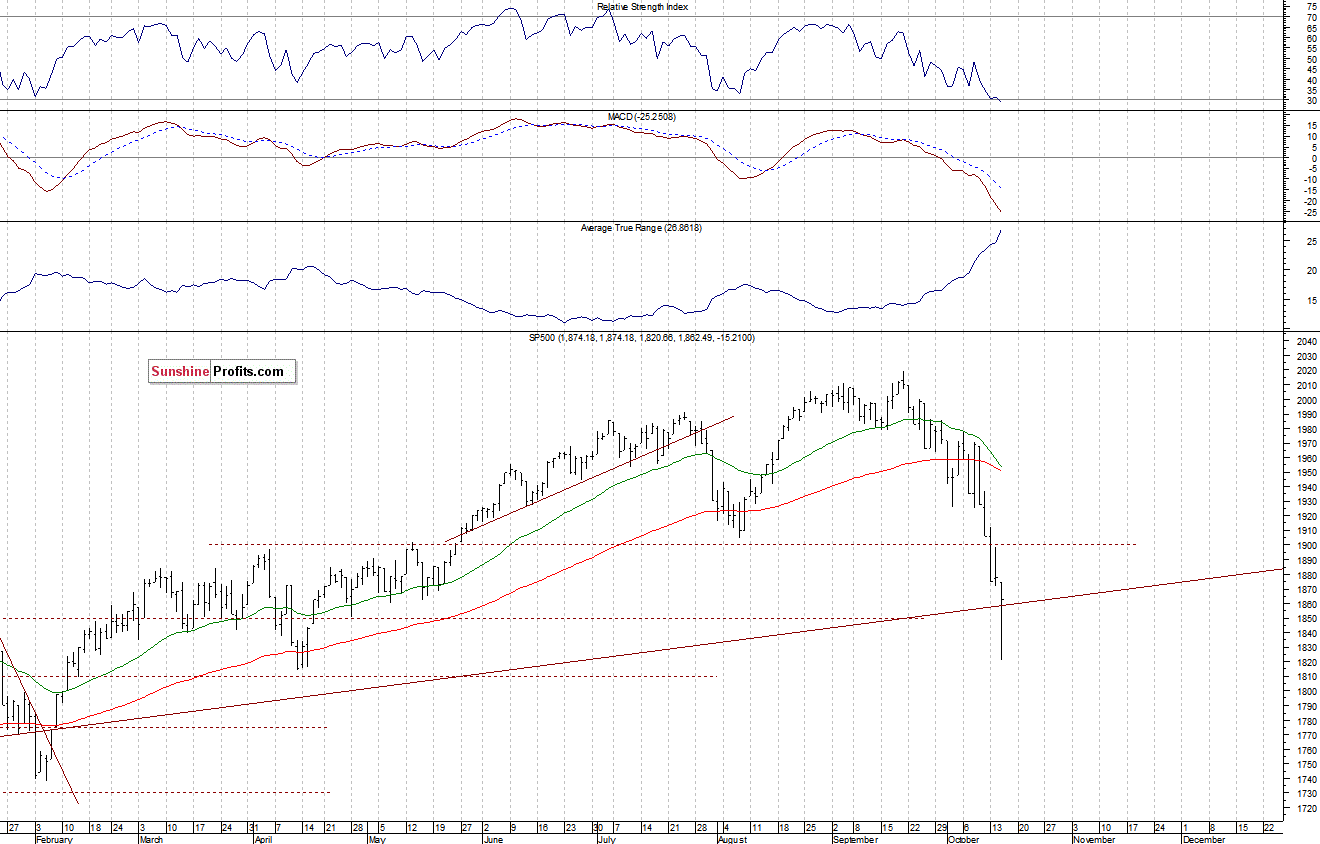
The U.S. stock market indexes lost between 0.6% and 1.1% on Wednesday, extending their recent move down, as investors kept selling stocks ahead of quarterly corporate earnings releases, economic data announcements. The S&P 500 index bounced off sharply following a quick sell-off to new medium-term low at 1,820.66, which is almost 200 points below the September 19th all-time high of 2,019.26. The nearest important resistance level is at around 1,870-1,875, marked by previous support level. On the other hand, potential level of support is at 1,800-1,820. There have been no confirmed positive signals so far, however, we can see some oversold conditions:
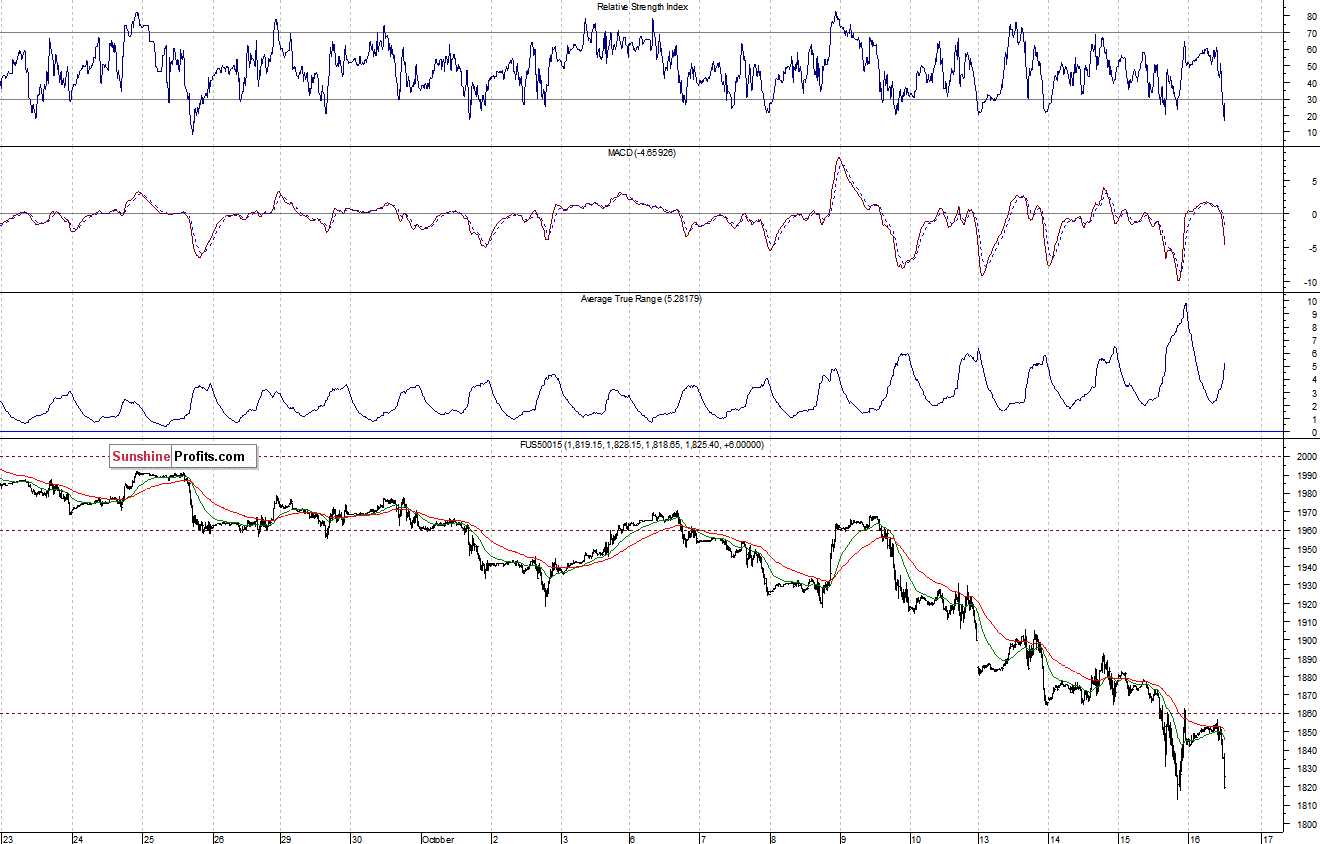
Expectations before the opening of today’s trading session are negative, with index futures currently down 0.9-1.1%. The main European stock market indexes have lost 1.8-2.8% so far. Investors will now wait for some economic data announcements: Initial Claims at 8:30 a.m., Industrial Production at 9:15 a.m., Philadelphia Fed, NAHB Housing Market Index at 10:00 a.m. The S&P 500 futures contract (CFD) is in an intraday downtrend, as it trades closer to yesterday’s low. The nearest important level of support is at around 1,810-1,820, as we can see on the 15-minute chart:
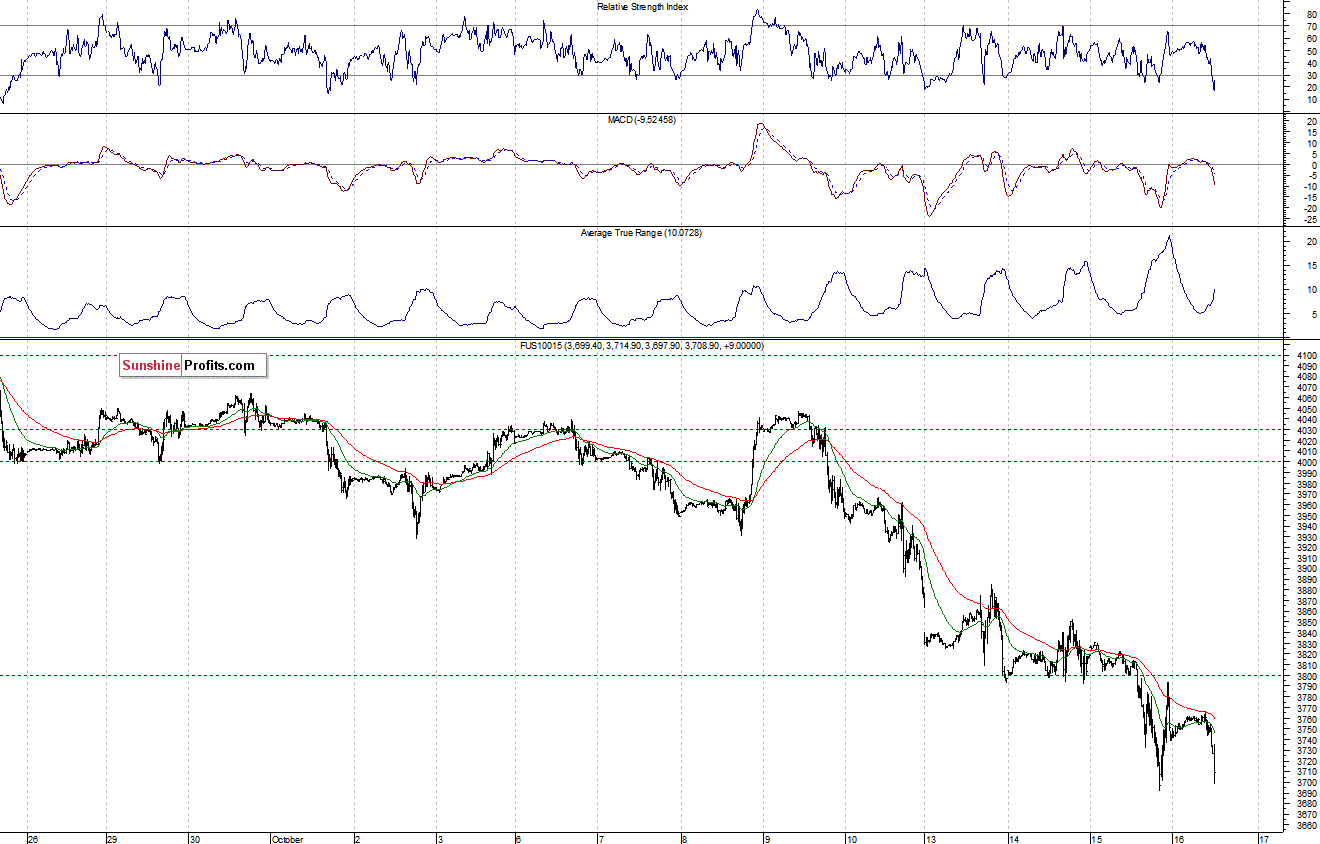
The technology Nasdaq 100 futures contract (CFD) follows a similar path, as it is close to yesterday’s low. Support level remains at around 3,690-3,700. On the other hand, the level of resistance is at 3,750-3,760, among others:
Concluding, the broad stock market extended its recent sell-off, as the S&P 500 index fell almost 10% below its September all-time high above the level of 2,000. There are some short-term oversold conditions which may lead to an upward correction or downtrend reversal at some point. Therefore, we prefer to be out of the market at this moment. We will let you know when we think it is safe to get back in the market.
Thank you.
Paul Rejczak
Stock Trading Strategist
Stock Trading Alerts

