
Briefly: In our opinion, speculative short positions are favored (entry point at 2,000.5 with stop-loss at 2,030 and a profit target at 1,900, S&P 500 index)
Our intraday outlook is bearish, and our short-term outlook is bearish:
Intraday
(next 24 hours) outlook: bearish
Short-term (next 1-2 weeks) outlook: bearish
Medium-term (next 1-3 months) outlook: neutral
Long-term outlook (next year): bullish
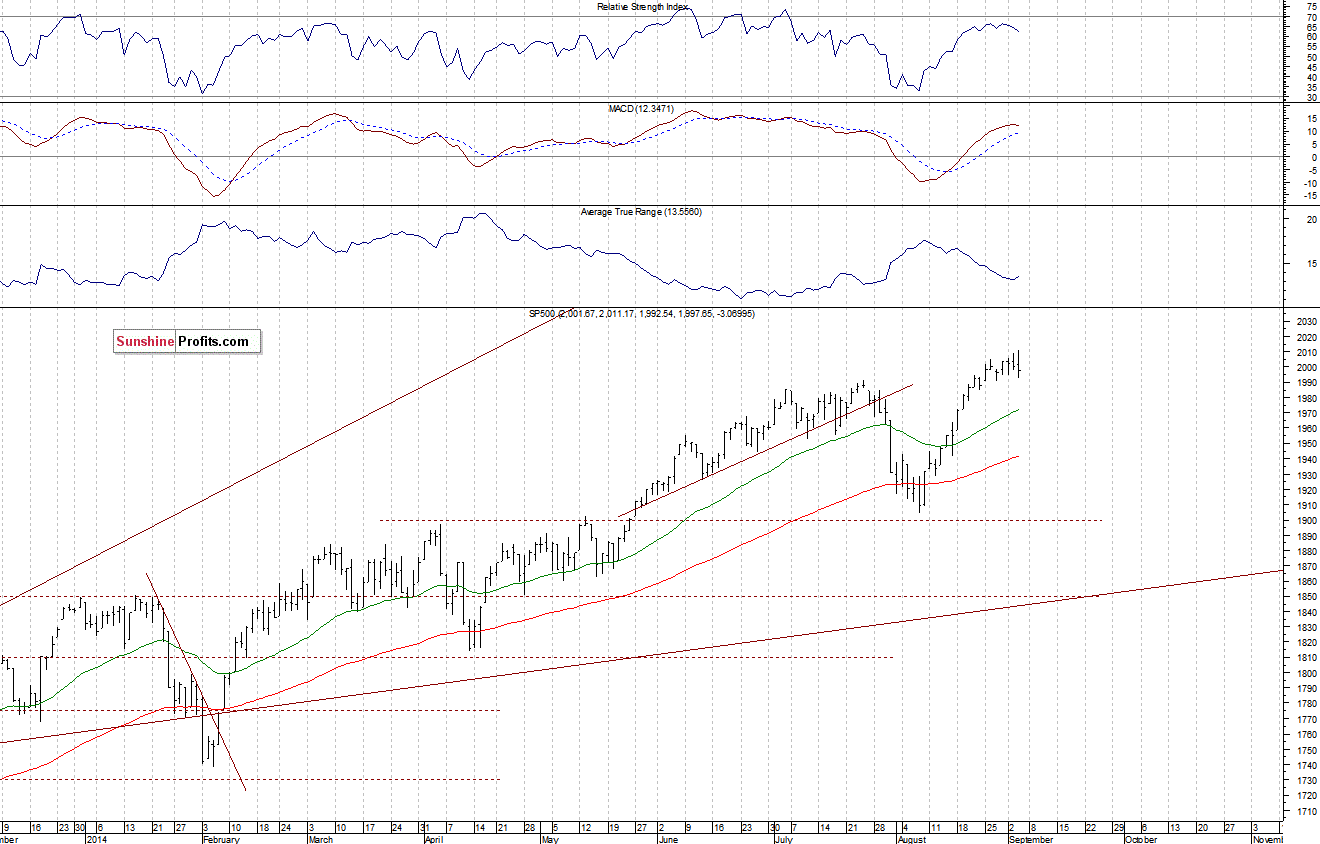
The main U.S. stock market indexes lost 0.1-0.2% on Thursday, extending their short-term fluctuations, as investors continued to hesitate following some recent economic data releases. The S&P 500 index has reached yet another intraday all-time high at 2,011.17, before closing lower. The level of resistance remains at 2,000-2,010, marked by recent highs. On the other hand, the support level is at 1,990-1,995, and the next support level is at 1,980-1,985, among others. There have been no confirmed negative signals so far, however, we can see negative technical divergences, accompanied by overbought conditions:
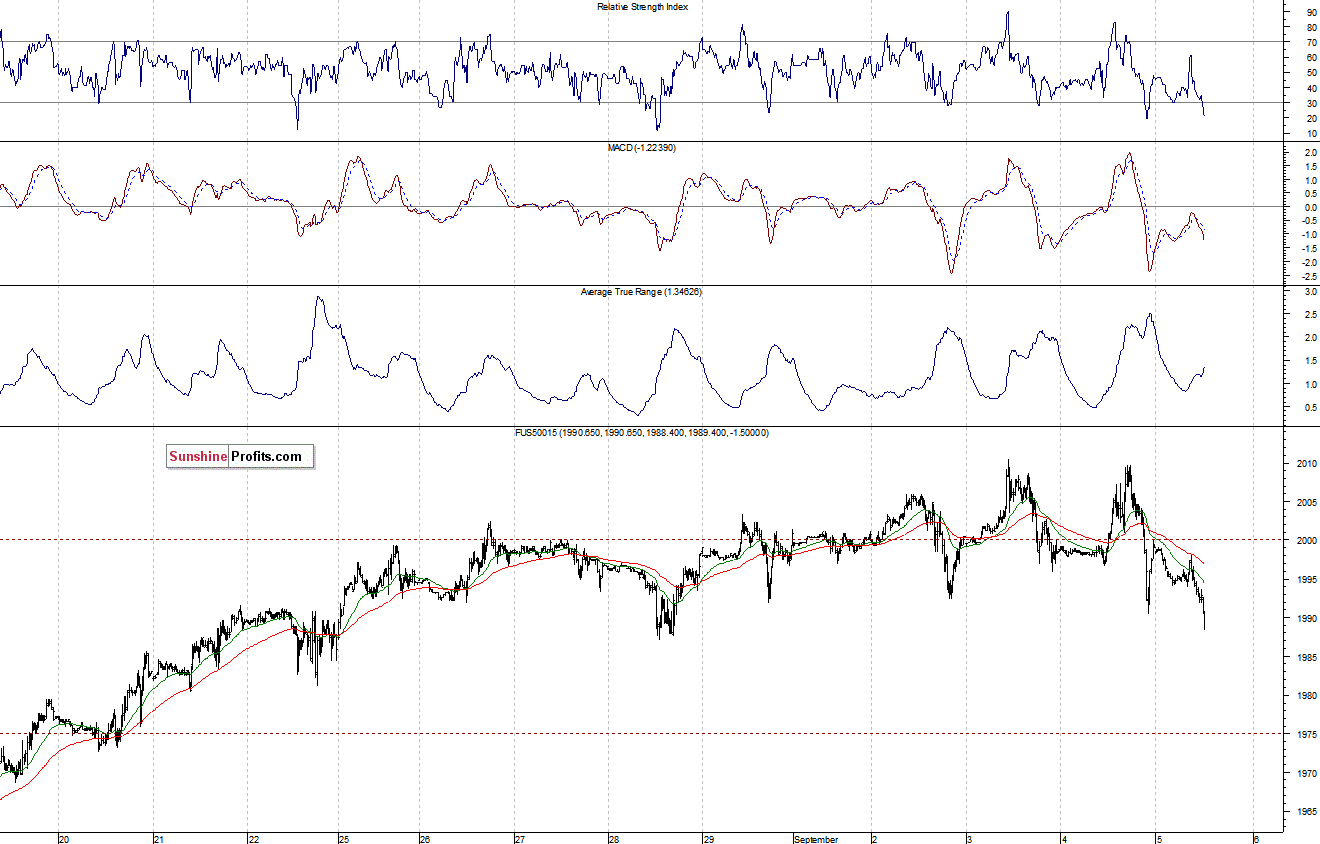
Expectations before the opening of today’s session are slightly negative, with index futures currently down 0.2%. The European stock market indexes have lost 0.3-0.5% so far. Investors will now wait for some important economic data announcements: Nonfarm Payrolls, Unemployment Rate at 8:30 a.m. Monthly Nonfarm Payroll is a statistic researched, recorded and reported by the U.S. Bureau of Labor Statistics. It represents the total number of paid business workers. It remains one of the most closely watched economic report releases. The S&P 500 futures contract (CFD) trades below its recent consolidation, as it moves away from the level of 2,000. The resistance level remains at 2,000-2,010, and the nearest important level of support is at around 1,985-1,990, as we can see on the 15-minute chart:
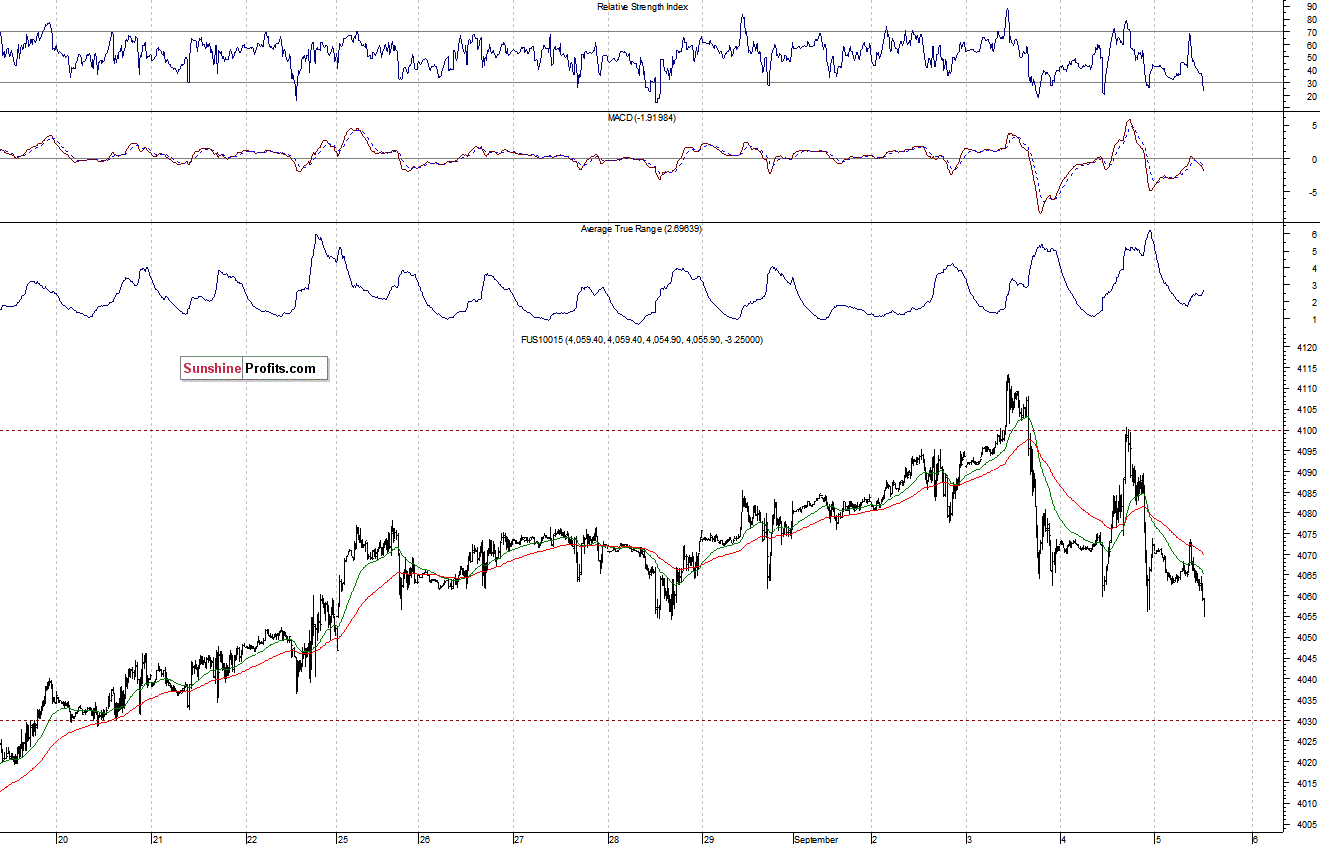
The technology Nasdaq 100 futures contract (CFD) is close to support level of 4,060, following some volatile trade along the level of 4,100. For now, it looks like a correction within an uptrend, however, a trend reversal cannot be excluded here:
Concluding, the broad stock market remains relatively close to all-time high as the S&P 500 index continues to fluctuate along the level of 2,000. However, we remain bearish, expecting a downward correction or uptrend reversal. We continue to maintain our already profitable speculative short position with entry point at 2,000.5 (S&P 500 index). The stop-loss is at the level of 2,030 and potential profit target is at 1,900 (S&P 500 index).
Thank you.
Paul Rejczak
Stock Trading Strategist
Stock Trading Alerts

