
Briefly: In our opinion, no speculative positions are justified.
Our intraday outlook is neutral, and our short-term outlook is neutral:
Intraday
(next 24 hours) outlook: neutral
Short-term (next 1-2 weeks) outlook: neutral
Medium-term (next 1-3 months) outlook: neutral
Long-term outlook (next year): bullish
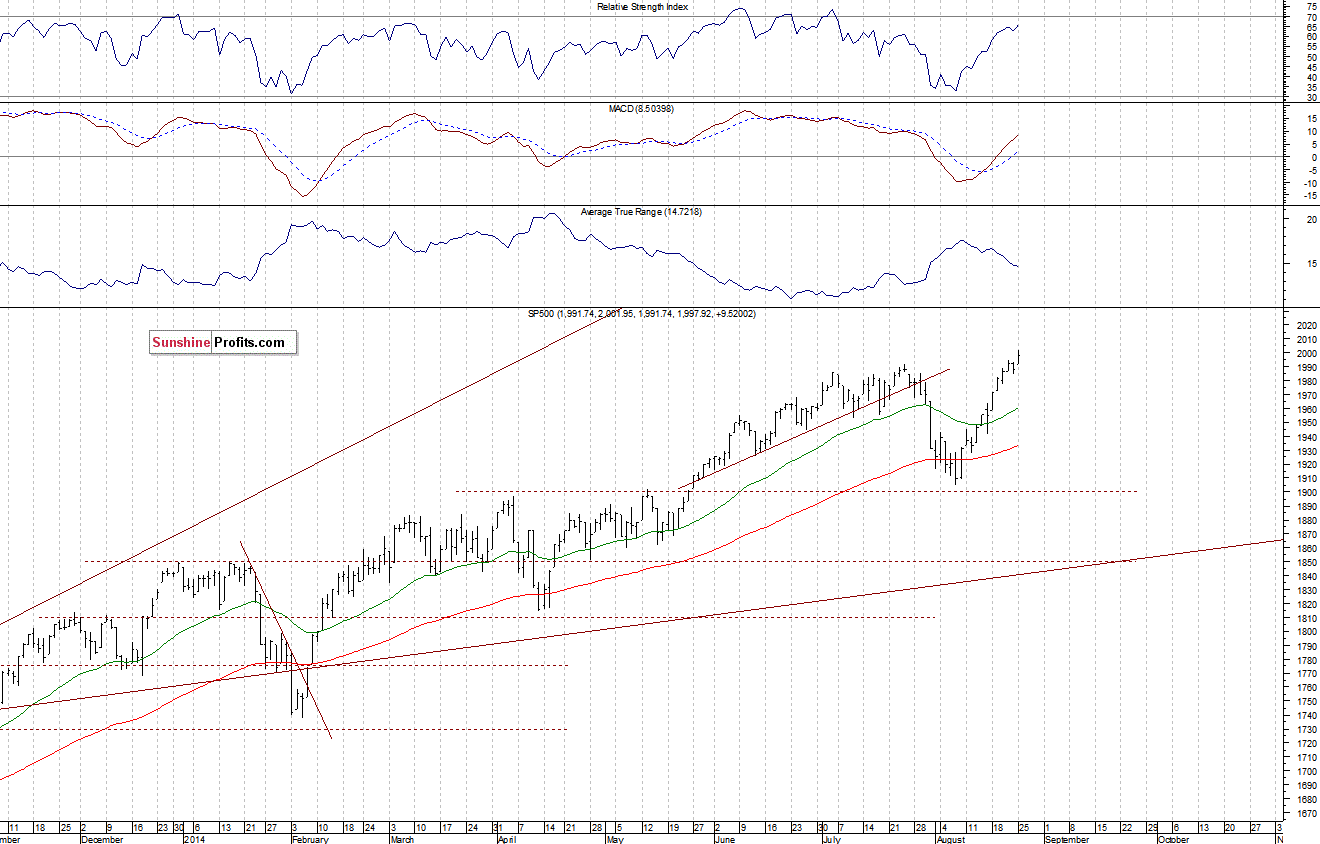
The U.S. stock market indexes gained 0.4-0.5% on Monday, extending their recent move up, as investors’ sentiment remained very positive following Fed’s Jackson Hole conference. The S&P 500 index has reached yet another new all-time high at the level of 2,001.95. However, it closed slightly below the resistance level of 2,000. On the other hand, the nearest important level of support is at around 1,980-1,985, marked by recent local extremes. There have been no confirmed negative signals so far. However, we can see negative technical divergences, accompanied by some short-term overbought conditions:
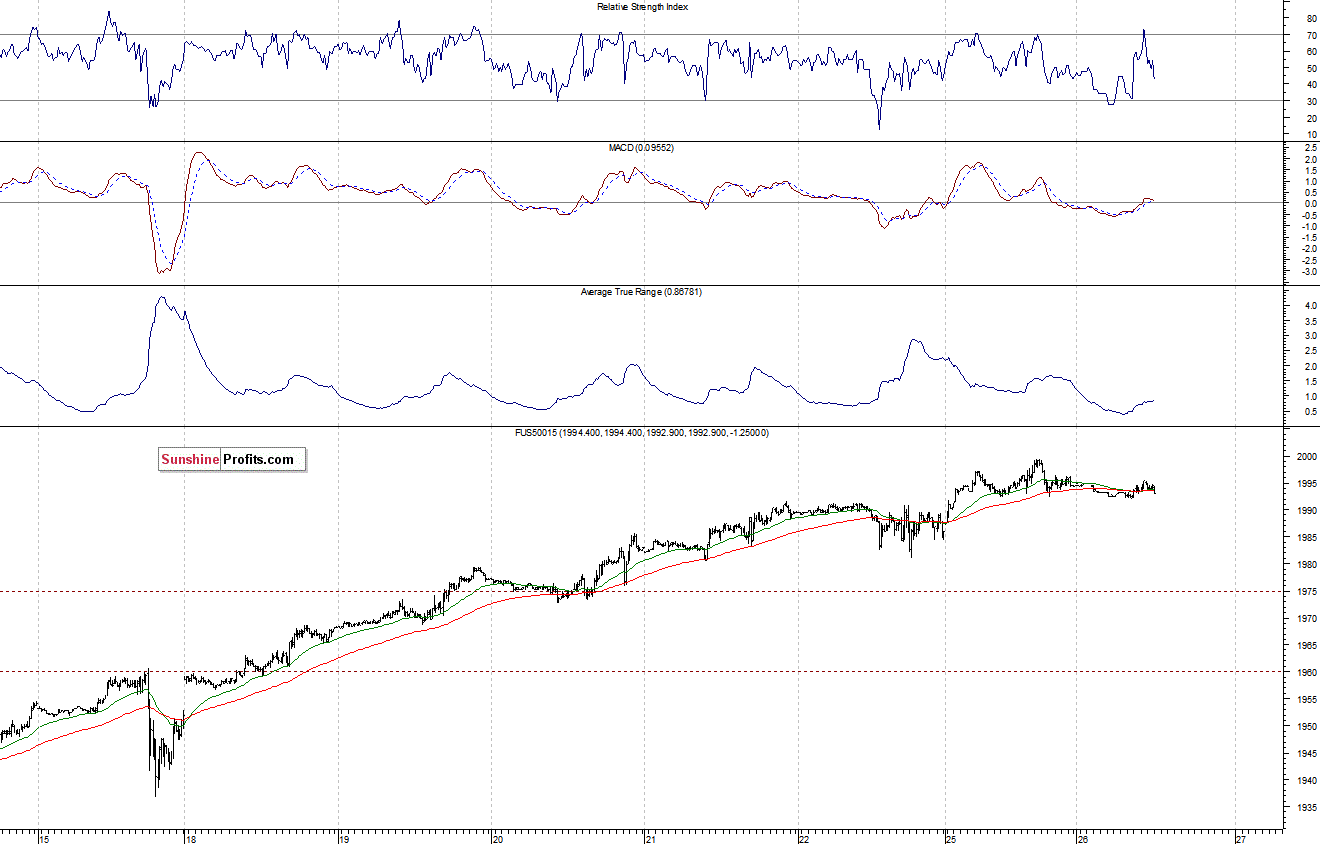
Expectations before the opening of today’s session are virtually flat. The main European stock market indexes have been mixed so far. Investors will now wait for some economic data announcements: Durable Goods Orders at 8:30 a.m., Case-Shiller 20-city Index, FHFA Housing Price Index at 9:00 a.m., Consumer Confidence at 10:00 a.m. The Durable Goods Orders is an economic indicator released monthly by the government. It reflects new orders placed with domestic manufacturers for delivery of factory durable goods. The measure, when compared with expectations, can provide indication of future economic growth. The S&P 500 futures contract (CFD) is in a relatively narrow trading range, following yesterday’s move up. The nearest important resistance level is at around the psychological 2,000. On the other hand, the level of support is at 1,980-1,985, marked by recent local lows, among others, as we can see on the 15-minute chart:
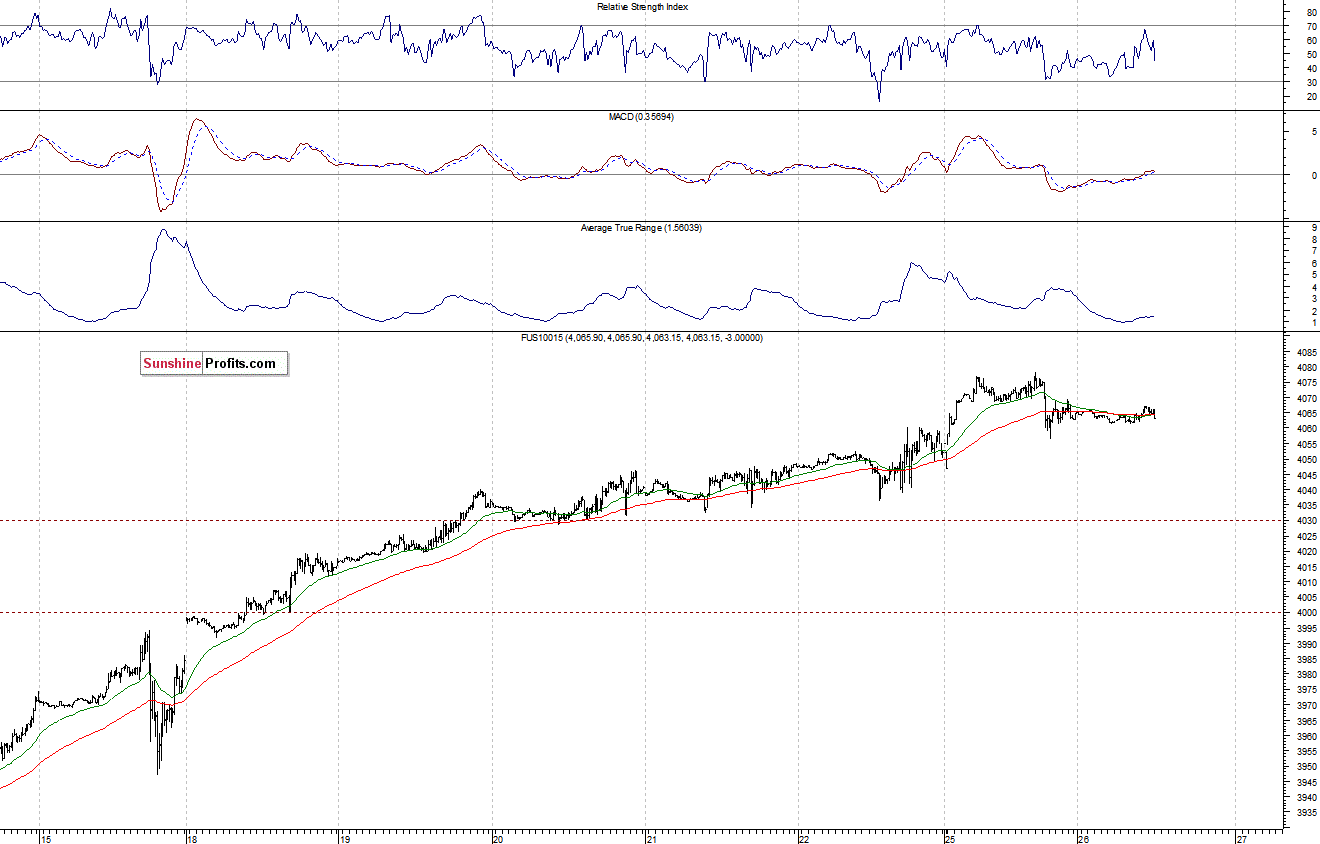
The technology Nasdaq 100 futures contract (CFD) is in a similar short-term consolidation, as it trades below the resistance of 4,080-4,100. The nearest important support level is at around 4,040-4,050, marked by some of the previous local extremes, as the 15-minute chart shows:
Concluding, the broad stock market remains close to its all-time highs, as the S&P 500 index trades along the level of 2,000. There have been no confirmed negative signals so far. However, there are some negative technical divergences, accompanied by short-term overbought conditions. In our opinion, no speculative positions are justified. We still prefer to be out of the market. We will let you know when we think it is safe to get back in the market.
Thank you.
Paul Rejczak
Stock Trading Strategist
Stock Trading Alerts

