
Briefly: In our opinion, speculative short positions are favored (with stop-loss at 1,970 and a profit target at 1,850, S&P 500 index)
Our intraday outlook is bearish, and our short-term outlook remains bearish:
Intraday
(next 24 hours) outlook: bearish
Short-term (next 1-2 weeks) outlook: bearish
Medium-term (next 1-3 months) outlook: neutral
Long-term outlook (next year): bullish
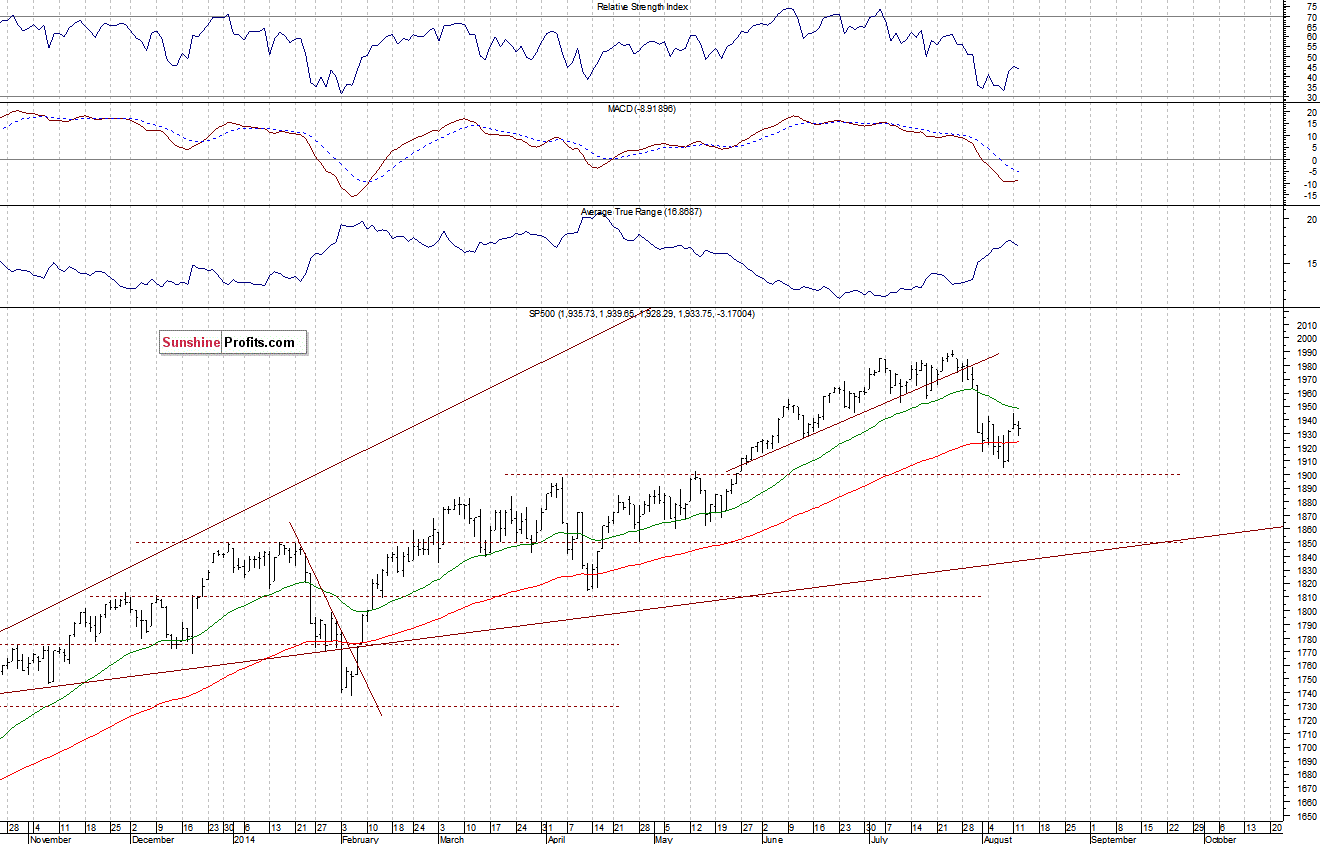
The U.S. stock market indexes lost 0.1-0.2% on Tuesday, retracing some of their recent move up, as investors took short-term profits. The S&P 500 index remains below the resistance level of 1,940-1,950, marked by 50% retracement of the downtrend at 1,948.1, among others. The level of support remains at 1,930-1,935, marked by Monday’s daily gap up of 1,932.4-1,933.4. For now, it looks like a correction within a short-term downtrend, as there have been no confirmed positive signals:
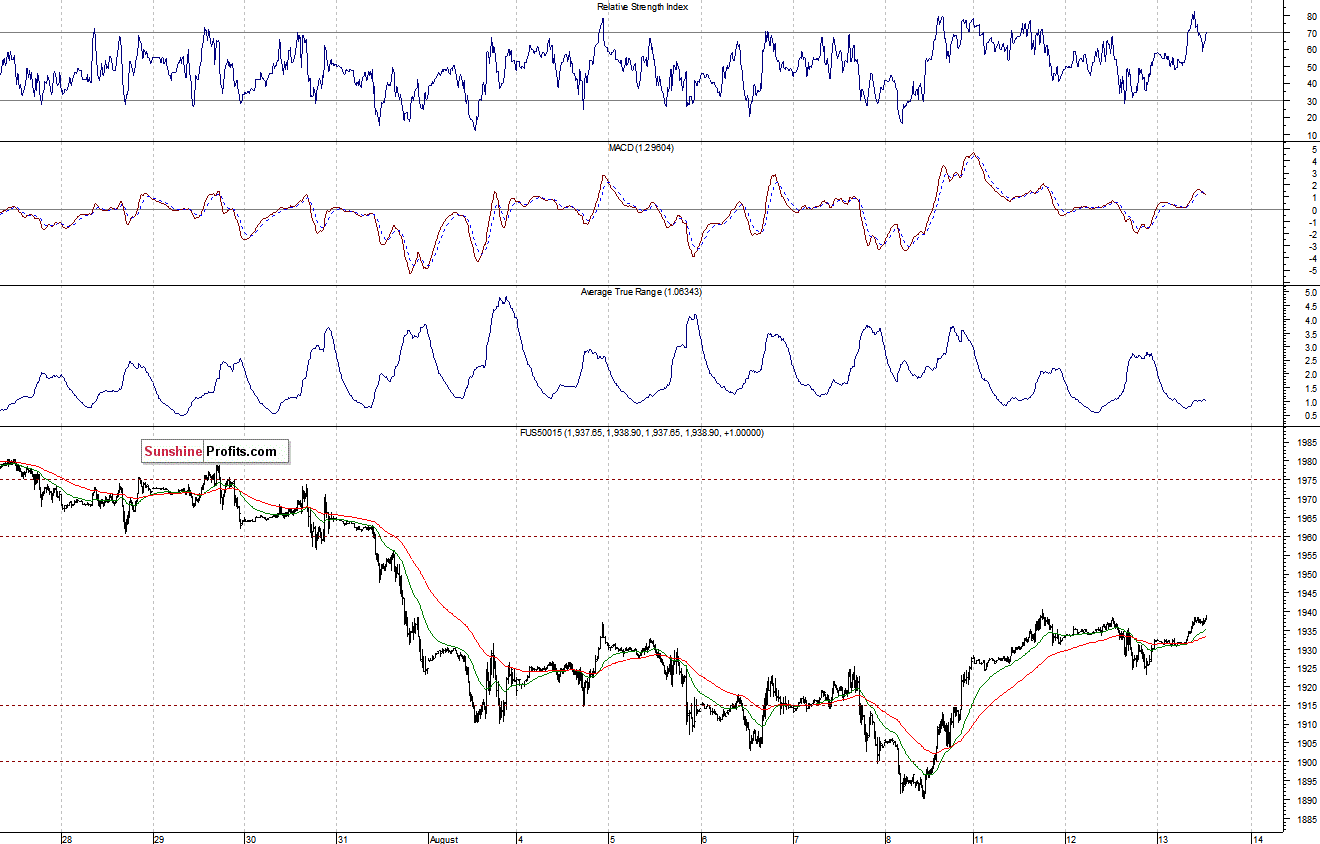
Expectations before the opening of today’s session are positive, with index futures currently up 0.40.5%. The European stock market indexes have gained 0.4-1.0% so far. Investors will now wait for some economic data announcements: Retail Sales at 8:30 a.m., Business Inventories at 10:00 a.m. Retail Sales data release for the month of July seems more important as it will show the level of all retail sales in the U.S. This number is a widely watched economic indicator because individual spending is a major driver of the U.S. economy. Therefore, better-than-expected data shows companies’ earnings increasing. The S&P 500 futures contract (CFD) extends its short-term fluctuations, as it trades along the level of 1,930-1,940. The level of support is at around 1,915-1,925, marked by recent local extremes, as we can see on the 15-minute chart:
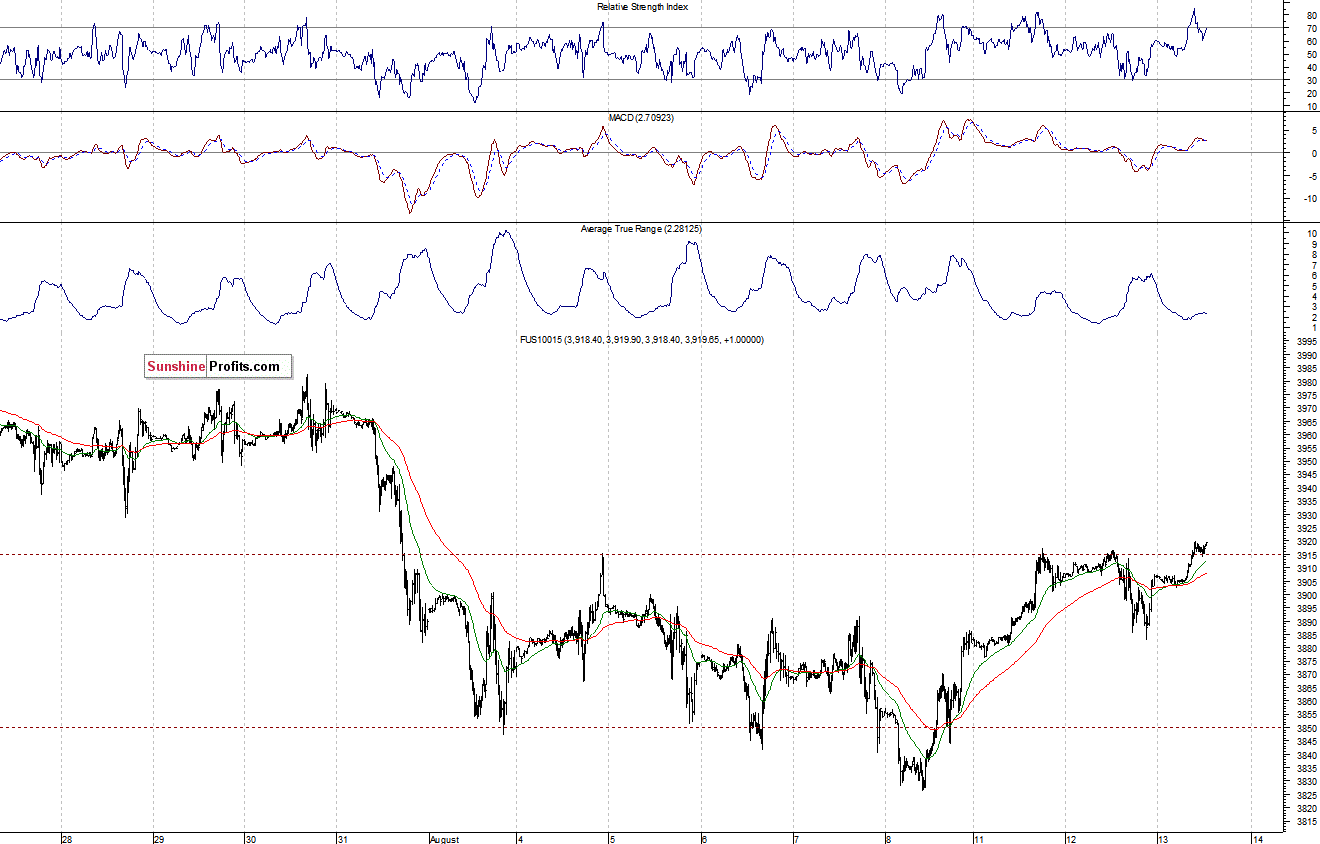
The technology Nasdaq 100 futures contract (CFD) fluctuates along the level of 3,900. The market has retraced more than half of its late July – early August decline. For now, it looks like a correction within a downtrend. The nearest important resistance level is at around 3,940, marked by previous consolidation, as the 15-minute chart shows:
Concluding, the broad stock market remains in a relatively narrow trading range, following Friday’s rebound. There have been no confirmed positive signals, however, a short-term downtrend reversal cannot be excluded. We remain cautiously pessimistic, maintaining our speculative short position. The stop-loss is at 1,970, and a profit target at 1,850 (S&P 500 index). It is always important to set some exit price level in case your analysis is wrong or your trading method fails at some point in time.
Thank you.
Paul Rejczak
Stock Trading Strategist
Stock Trading Alerts

