
Briefly: In our opinion, speculative short positions are favored (with stop-loss at 1,970 and a profit target at 1,850, S&P 500 index)
Our intraday outlook is bearish, and our short-term outlook remains bearish:
Intraday
(next 24 hours) outlook: bearish
Short-term (next 1-2 weeks) outlook: bearish
Medium-term (next 1-3 months) outlook: neutral
Long-term outlook (next year): bullish
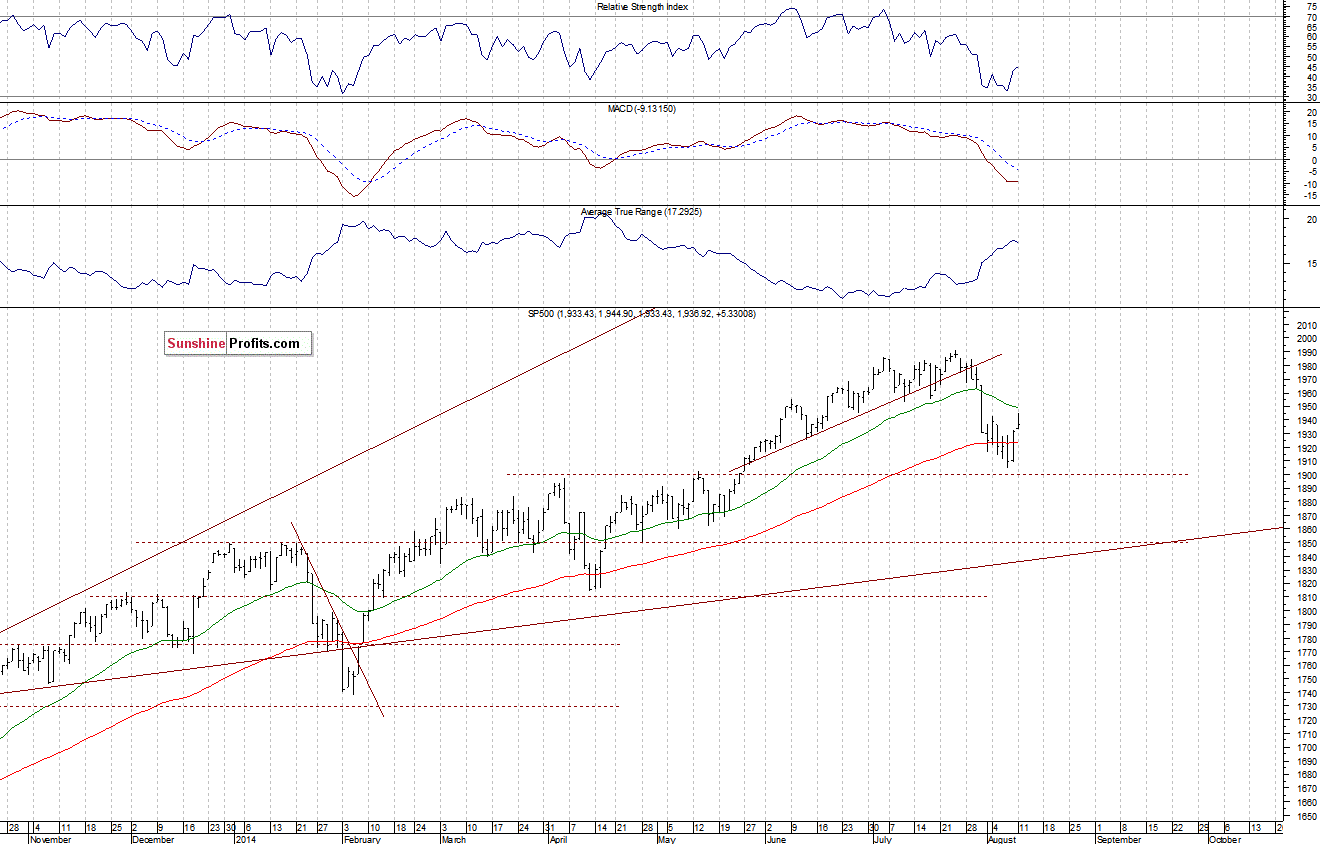
The U.S. stock market indexes gained 0.1-0.6% yesterday, extending their Friday’s move up, as investors bet that stocks would resume long-term uptrend following a downward correction. However, the S&P 500 index bounced off the resistance level of 1,940-1,950, marked by 50% retracement of the downtrend at 1,948.1, among others. On the other hand, the level of support is at around 1,930-1,935, marked by yesterday’s daily gap up of 1,932.4-1,933.4. The gap is a break between prices on a chart that occurs when the price makes a sudden move up or down with no trading in between. It may then serve as a quite strong support or resistance level, because it marks a price at which traders were very emotional about their trade and rushed to open a position. For now, it looks like an upward correction within a short-term downtrend, as there have been no confirmed positive signals so far:
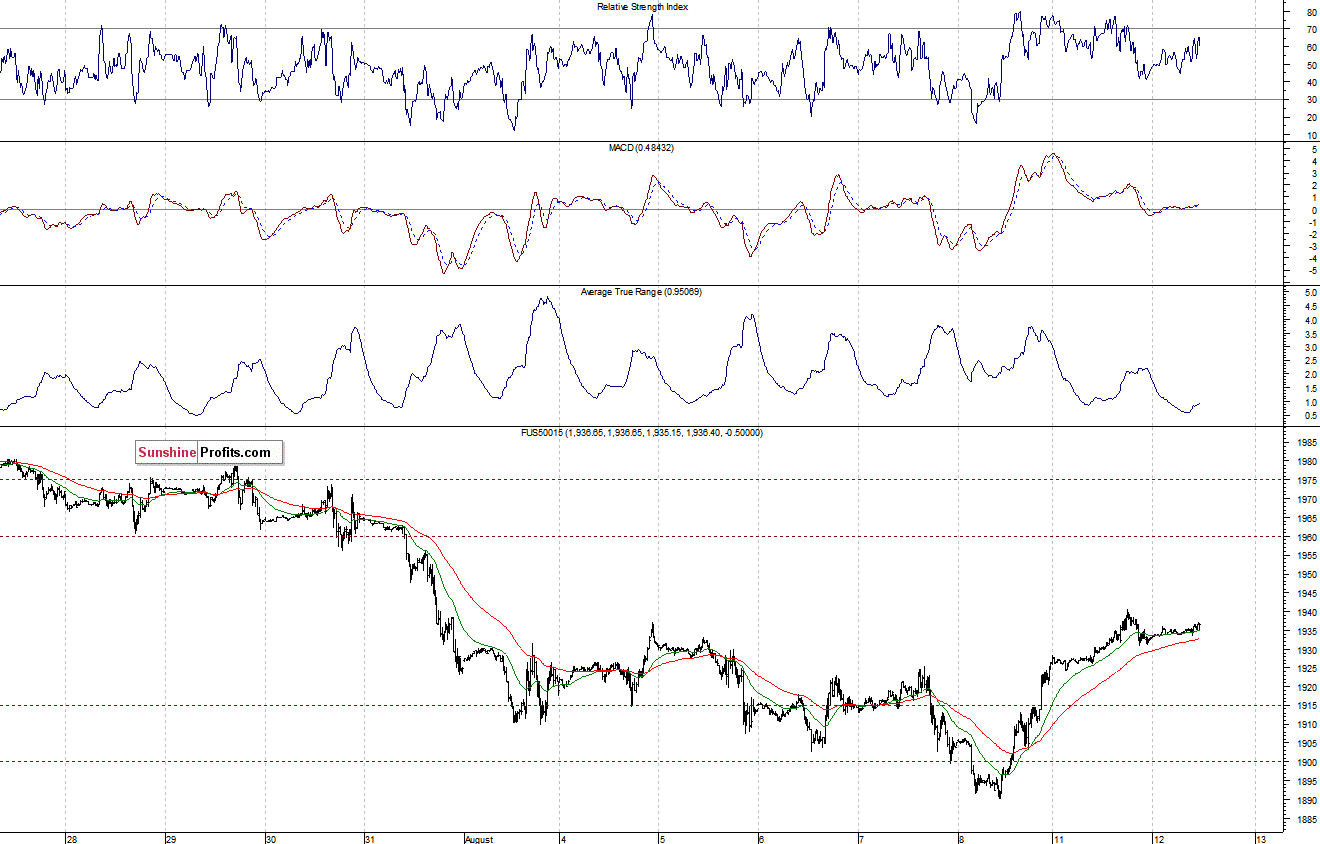
Expectations before the opening of today’s session are positive, with index futures currently up 0.2-0.3%. The main European stock market indexes have been mixed so far. The S&P 500 futures contract (CFD) is in an intraday trading range following yesterday’s move up. The nearest important resistance level is at around 1,935-1,940. On the other hand, the level of support remains at 1,915-1,925, among others, as we can see on the 15-minute chart:
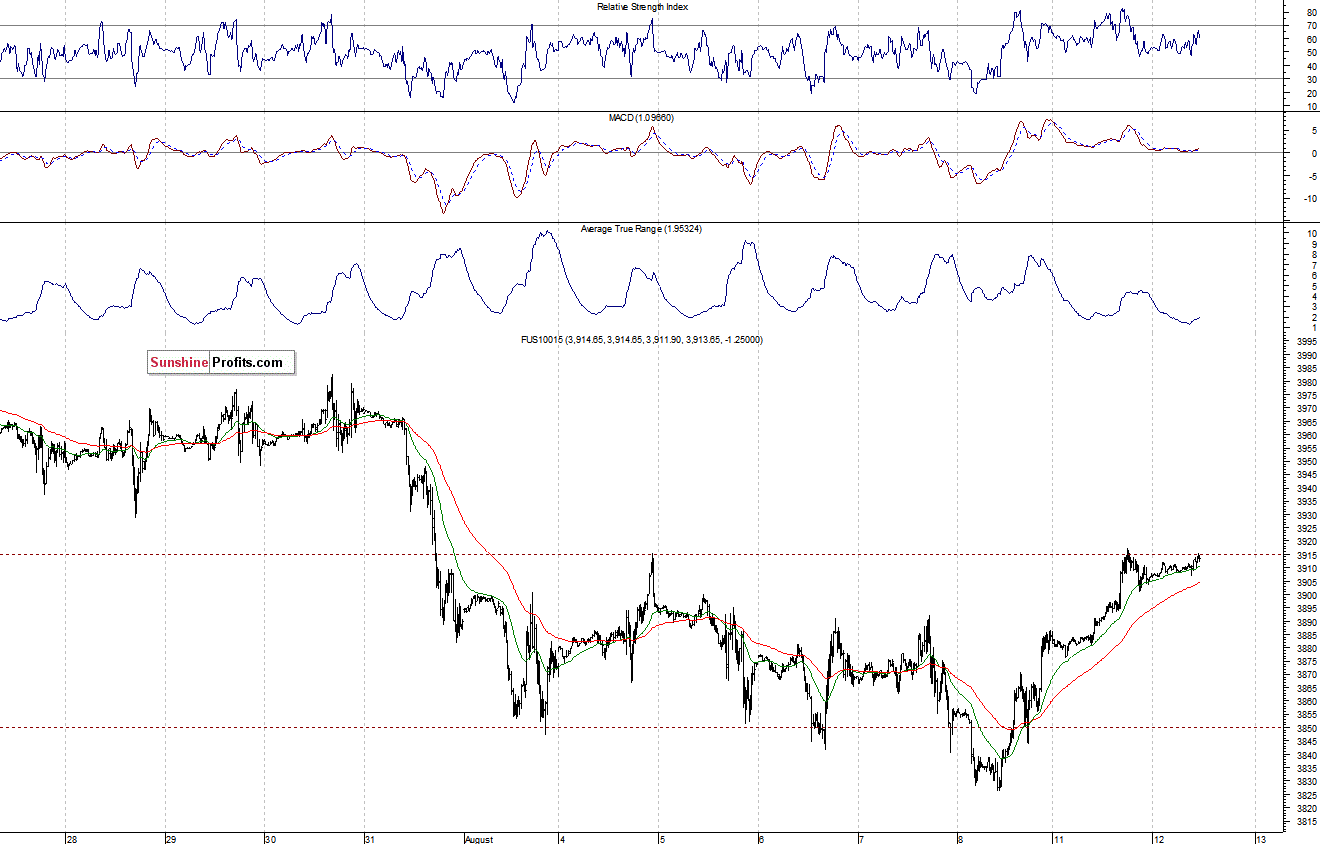
The technology Nasdaq 100 futures contract (CFD) trades in a relatively narrow range, close to the resistance level of 1,915-1,920, marked by previous local high. The support level is at 1,890-1,900. For now, it looks like a correction within a short-term downtrend, however, a bullish scenario cannot be excluded. The next resistance level is at around 3,940-3,950, as the 15-minute chart shows:
Concluding, the broad stock market rebounded following last weeks’ sell-off. However, the S&P 500 index still trades below its July consolidation, which is negative. We remain cautiously pessimistic and continue to maintain our speculative short position. The stop-loss is at 1,970, and a profit target remains at 1,850 (S&P 500 index). It is always important to set some exit price level in case your analysis is wrong or your trading method fails at some point in time.
Thank you.
Paul Rejczak
Stock Trading Strategist
Stock Trading Alerts

