
Briefly: In our opinion, speculative short positions are favored (with stop-loss at 1,970 and a profit target at 1,850, S&P 500 index)
Our intraday outlook is bearish, and our short-term outlook is bearish, following a breakout below recent consolidation:
Intraday (next
24 hours) outlook: bearish
Short-term (next 1-2 weeks) outlook: bearish
Medium-term (next 1-3 months) outlook: neutral
Long-term outlook (next year): bullish
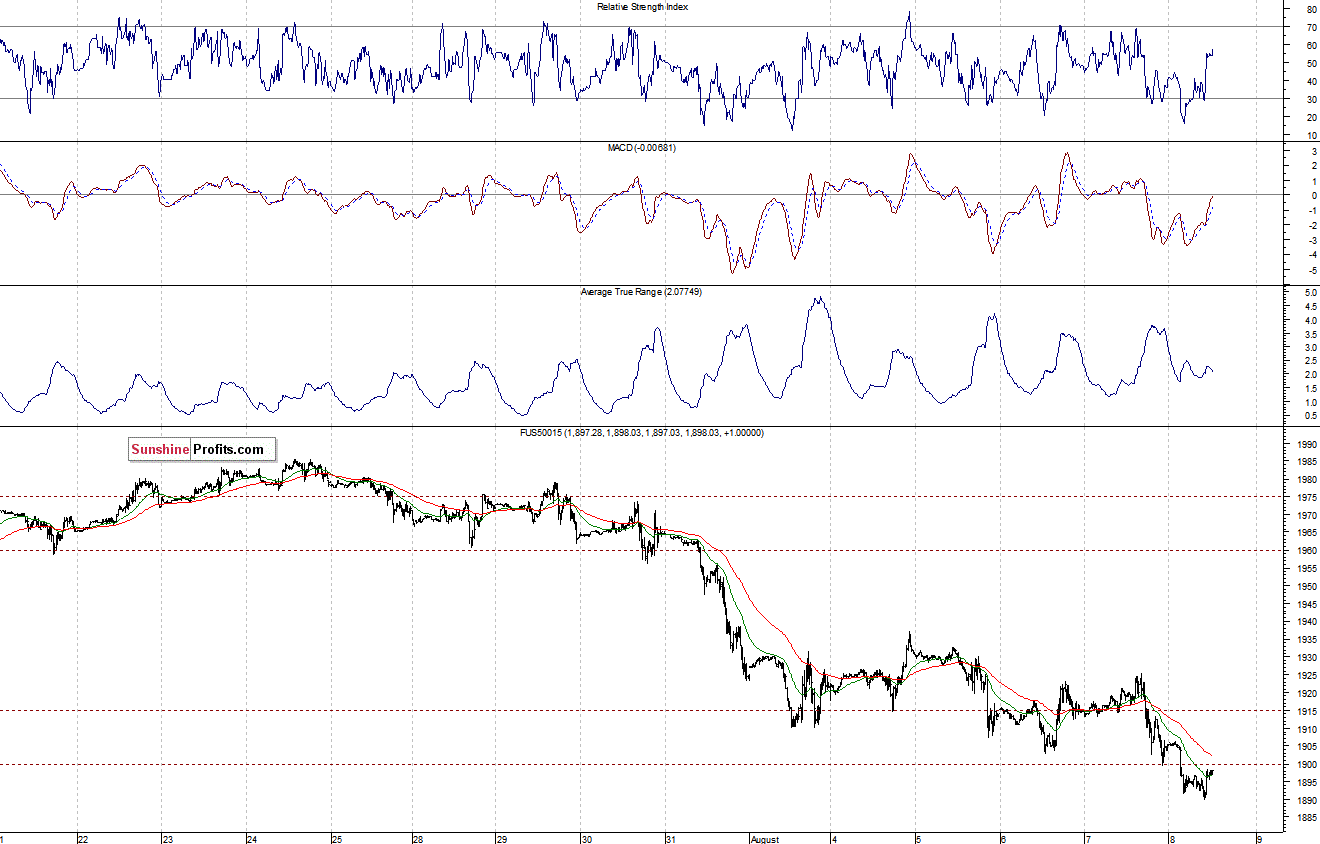
The main U.S. stock market indexes lost 0.5-0.6% on Thursday, extending their short-term downtrend, as investors’ sentiment remained negative. Our yesterday’s bearish intraday outlook has proved accurate. The S&P 500 index got closer to the support level of 1,900, marked by the March-May consolidation. On the other hand, the nearest important level of resistance is at around 1,940, marked by recent local highs. There have been no confirmed positive signals so far. However, we can see some short-term oversold conditions, which may lead to a bounce or consolidation along the level of 1,900:
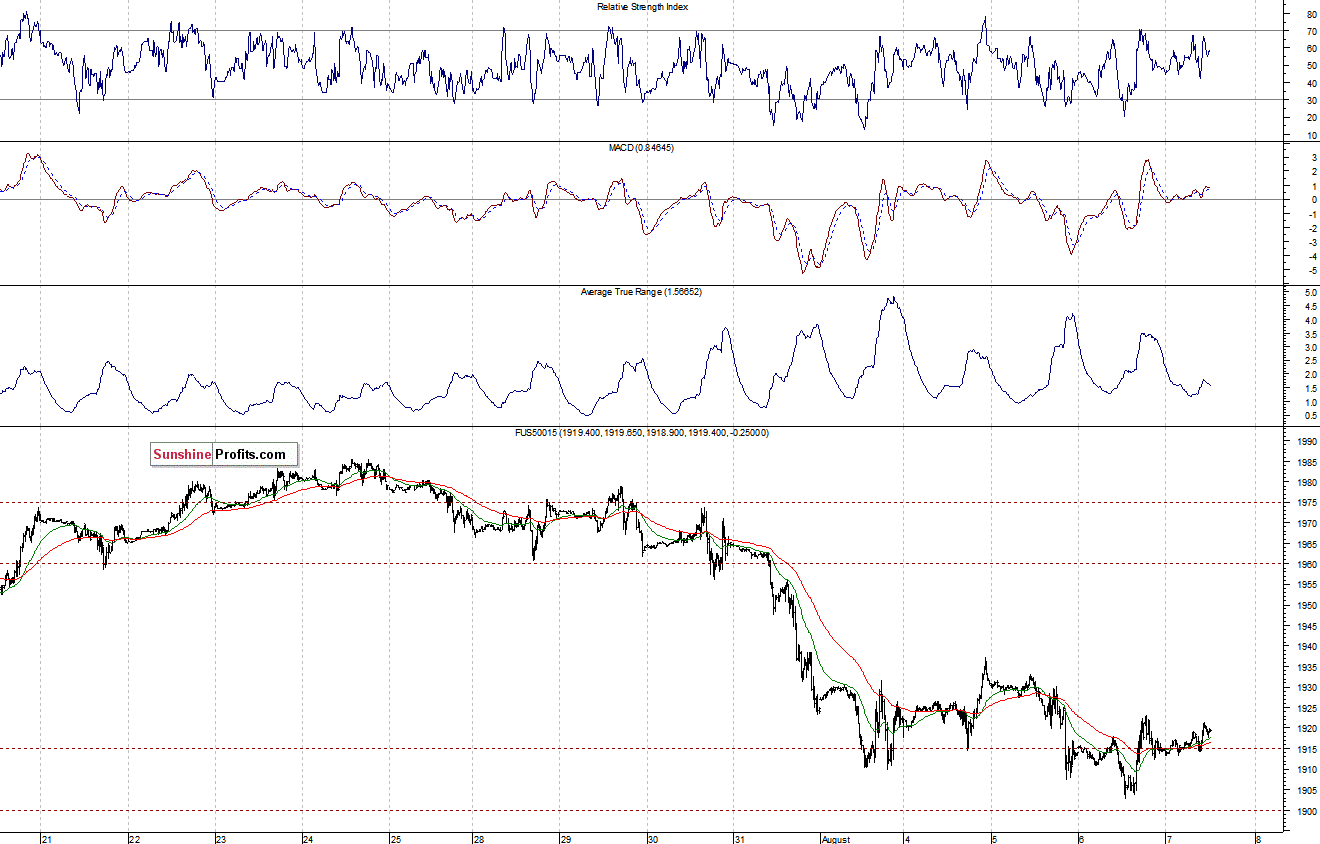
Expectations before the opening of today’s session are negative, with index futures currently down 0.3%. The European stock market indexes have lost 0.2-0.8% so far. Investors will now wait for some economic data announcements: Productivity number at 8:30 a.m., Wholesale Inventories at 10:00 a.m. The S&P 500 futures contract (CFD) trades below the level of 1,900, extending its short-term downtrend. Potential support level is at around 1,890, and the nearest level of resistance is at 1,920-1,925, marked by recent local highs, as we can see on the daily chart:
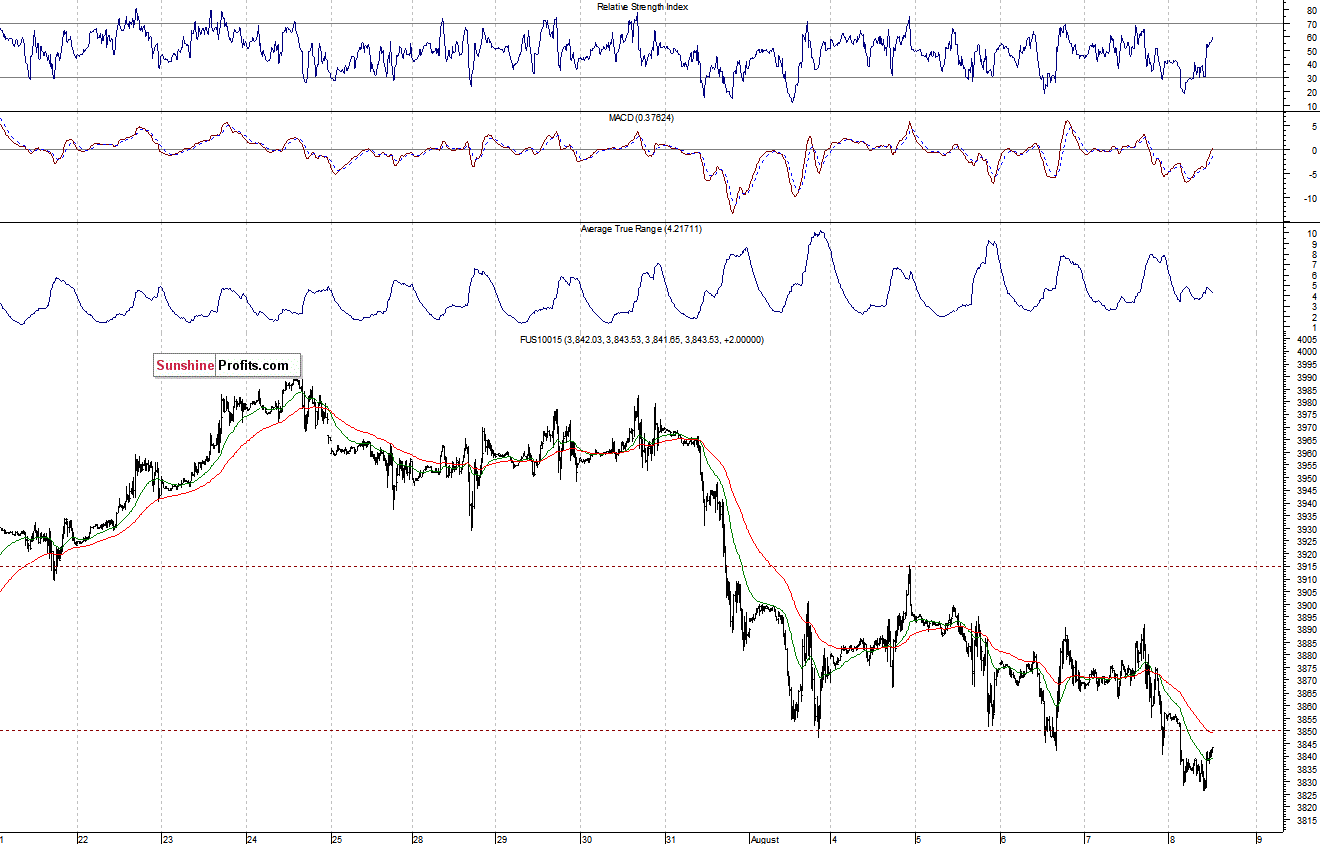
The technology Nasdaq 100 futures contract (CFD) broke below the support of 3,850. Therefore, the nearest important resistance level is at around 3,850, and a potential support level is at around 3,825-3,830, marked by local low, as the 15-minute chart shows:
Concluding, the broad stock market remains in a short-term downtrend, as the S&P 500 index trades closer to the level of 1,900. There have been no confirmed positive signals so far. Therefore, we expect some more downside, maintaining our already profitable speculative short position (with stop-loss at 1,970, and a profit target of 1,850, S&P 500 index). It is always important to set some exit price level in case your analysis is wrong or your trading method fails at some point in time.
Thank you.
Paul Rejczak
Stock Trading Strategist
Stock Trading Alerts

