
Briefly: In our opinion, no speculative positions are justified.
Our intraday outlook remains neutral, and our short-term outlook is neutral:
Intraday
(next 24 hours) outlook: neutral
Short-term (next 1-2 weeks) outlook: neutral
Medium-term (next 1-3 months) outlook: neutral
Long-term outlook (next year): bullish
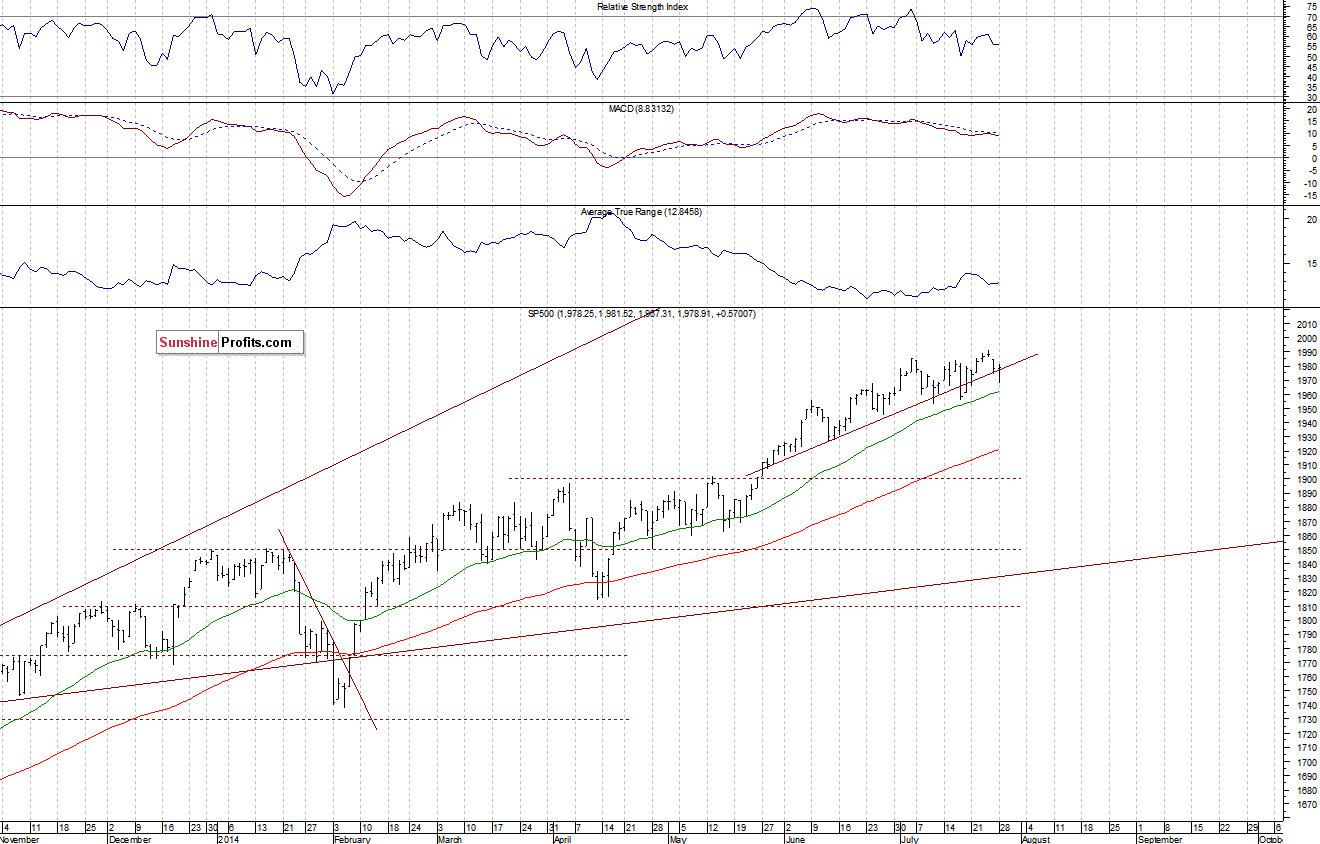
The main U.S. stock market indexes were virtually flat on Monday, following a quite volatile trading session, as investors awaited series of economic data announcements, quarterly corporate earnings releases. Our Monday’s neutral intraday outlook has proved accurate. The S&P 500 index bounced off the support level of 1,950-1,970, extending its month-long consolidation. The resistance level remains at around 1,990-2,000, marked by the July 24 all-time high of 1,991.38. There have been no confirmed negative signals so far. For now, it looks like a flat correction within long-term uptrend. However, a topping pattern followed by a downward correction cannot be excluded here:
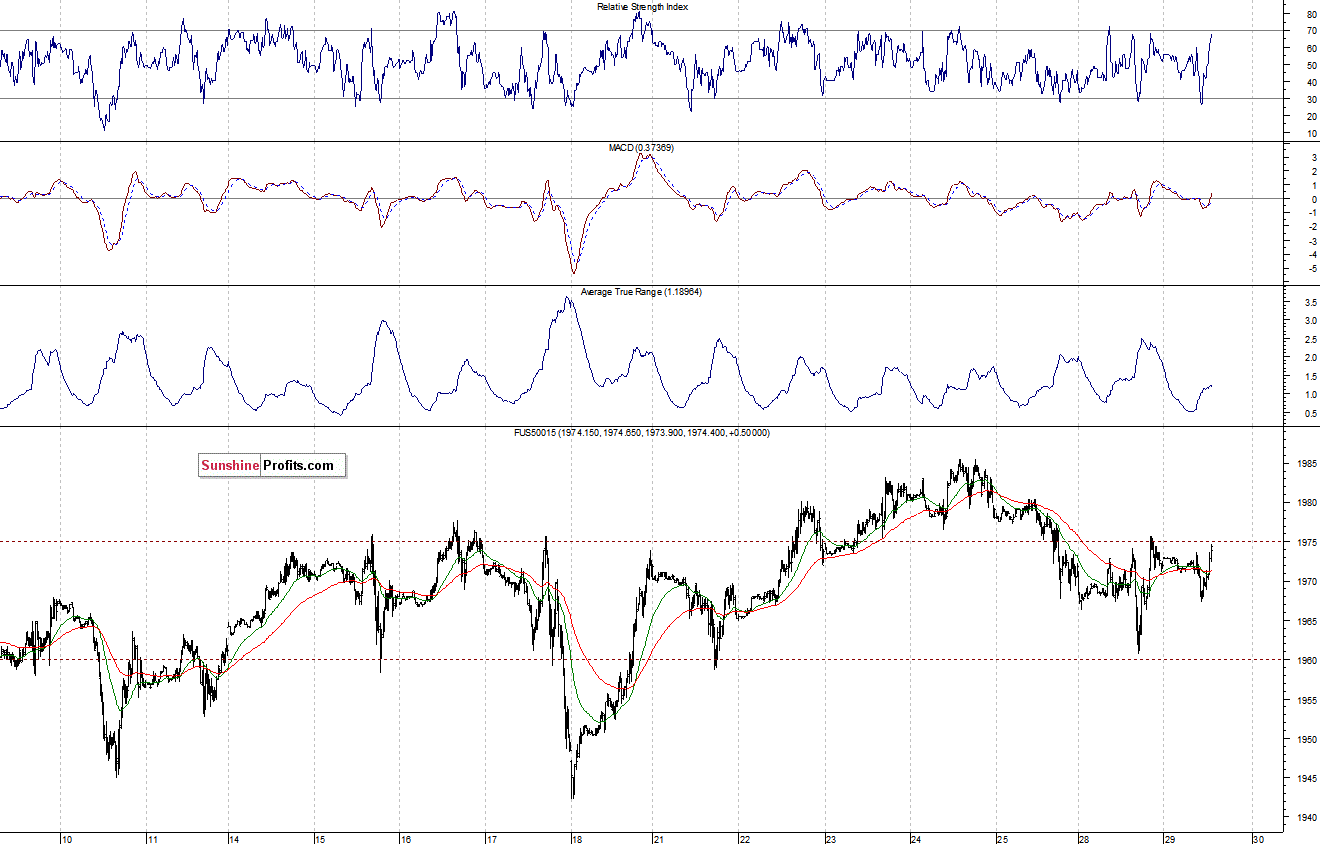
Expectations before the opening of today’s session are virtually flat. The European stock market indexes have been mixed between 0.0% and +0.2% so far. Investors will now wait for some economic data releases: Case-Shiller 20-city Index at 9:00 a.m., Consumer Confidence at 10:00 a.m. The Consumer Confidence number is an important economic indicator which shows how optimistic or pessimistic consumers are with respect to the economy in the near future. The S&P 500 futures contract (CFD) extends its recent consolidation, as it trades below the resistance level of 1,980-1,985. The nearest important level of support is at around 1,960, marked by yesterday’s local low, as we can see on the 15-minute chart:
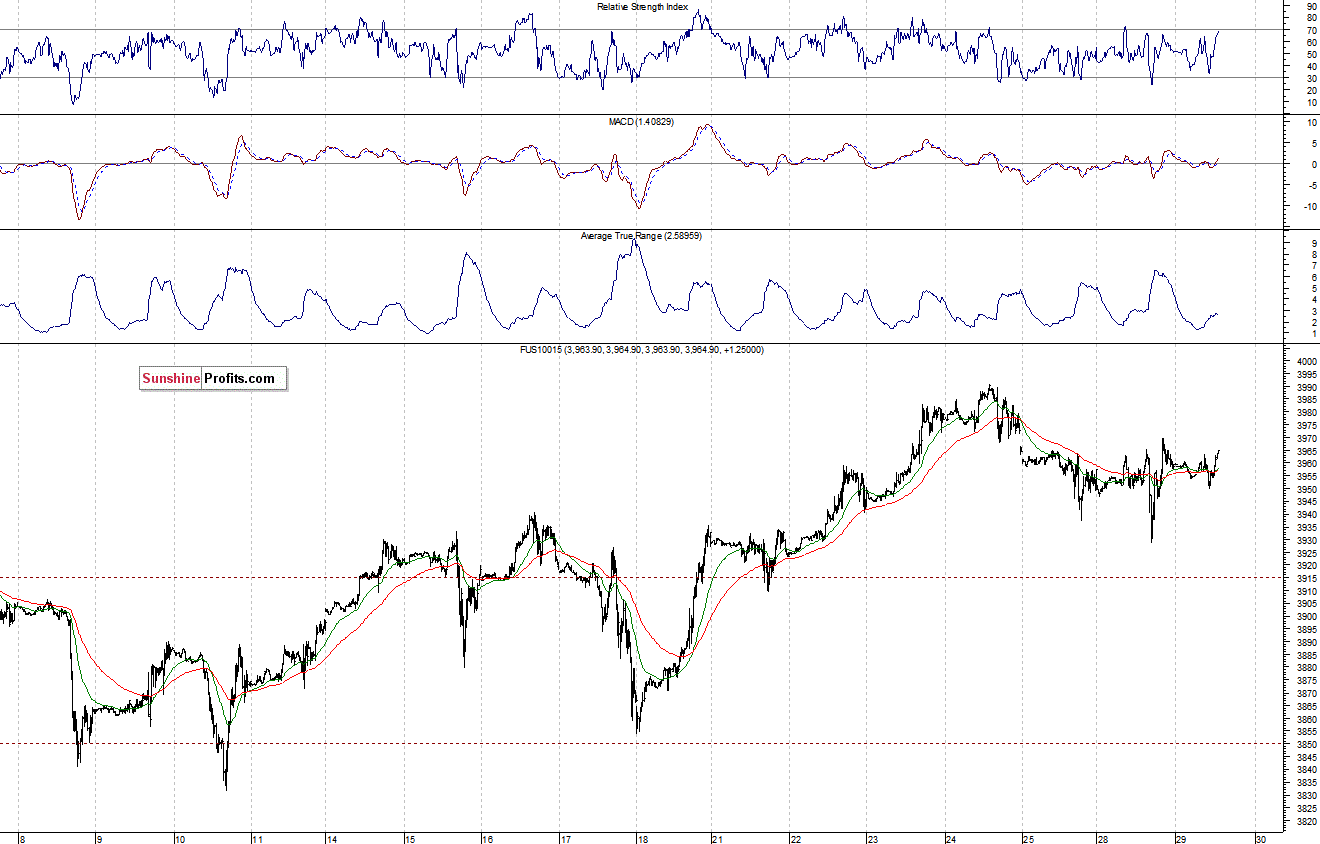
The technology Nasdaq 100 futures contract (CFD) remains close to its long-term highs, as it trades slightly below the resistance level of 3,980-4,000. For now, it looks like a flat correction within an uptrend. The nearest important support level is at 3,930-3,940, as the 15-minute chart shows:
Concluding, the broad stock market extends its consolidation, fluctuating slightly below record highs, as investors wait for some key economic data announcements – tomorrow’s U.S. GDP number and the FOMC Rate Decision, Friday’s Jobs report, among others. There have been no confirmed negative signals so far. The market remains in a long-term uptrend, however, a technical correction cannot be excluded at these levels. We think that it is better to stay out of the market at this moment, avoiding low risk/reward ratio trades. We will let you know when we think it is safe to get back in the market.
Thank you.
Paul Rejczak
Stock Trading Strategist
Stock Trading Alerts

