
Briefly: In our opinion, no speculative positions are justified.
Our intraday outlook remains neutral, and our short-term outlook is neutral:
Intraday
(next 24 hours) outlook: neutral
Short-term (next 1-2 weeks) outlook: neutral
Medium-term (next 1-3 months) outlook: neutral
Long-term outlook (next year): bullish
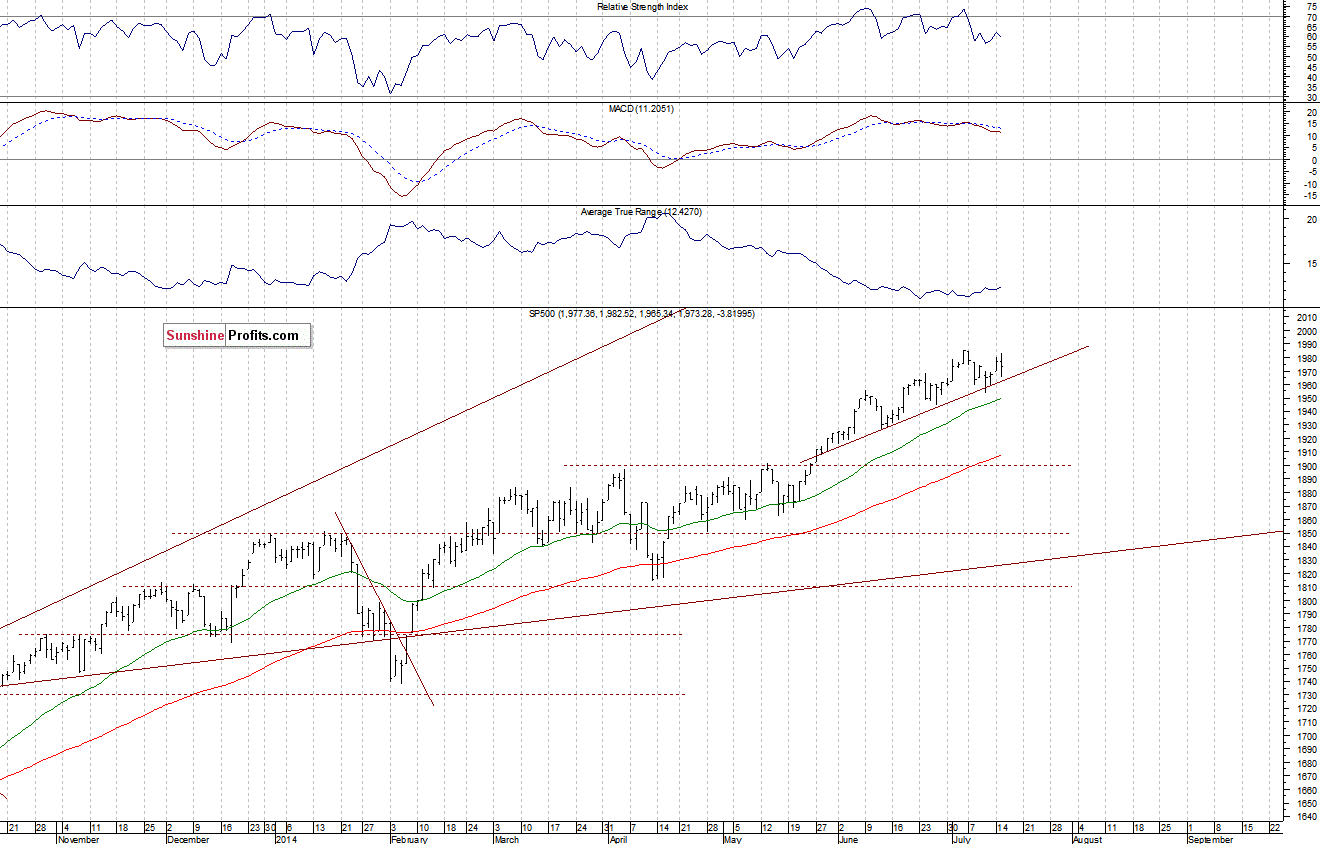
The main U.S. stock market indexes were mixed between -0.4% and 0.0% on Tuesday, extending their short-term consolidation, as investors reacted to Fed Chairwoman Janet Yellen’s testimony before the Senate Banking Committee. Our Tuesday’s neutral outlook has been accurate. The S&P 500 index remains quite close to its July 3 all-time high of 1,985.59. The resistance level is at around 1,980-1,985, and the next resistance is at the psychological level of 2,000. On the other hand, the support is at around 1,950-1,960, marked by recent local lows, among others. The index trades above upward trend line, which is positive. There have been no confirmed negative signals so far:
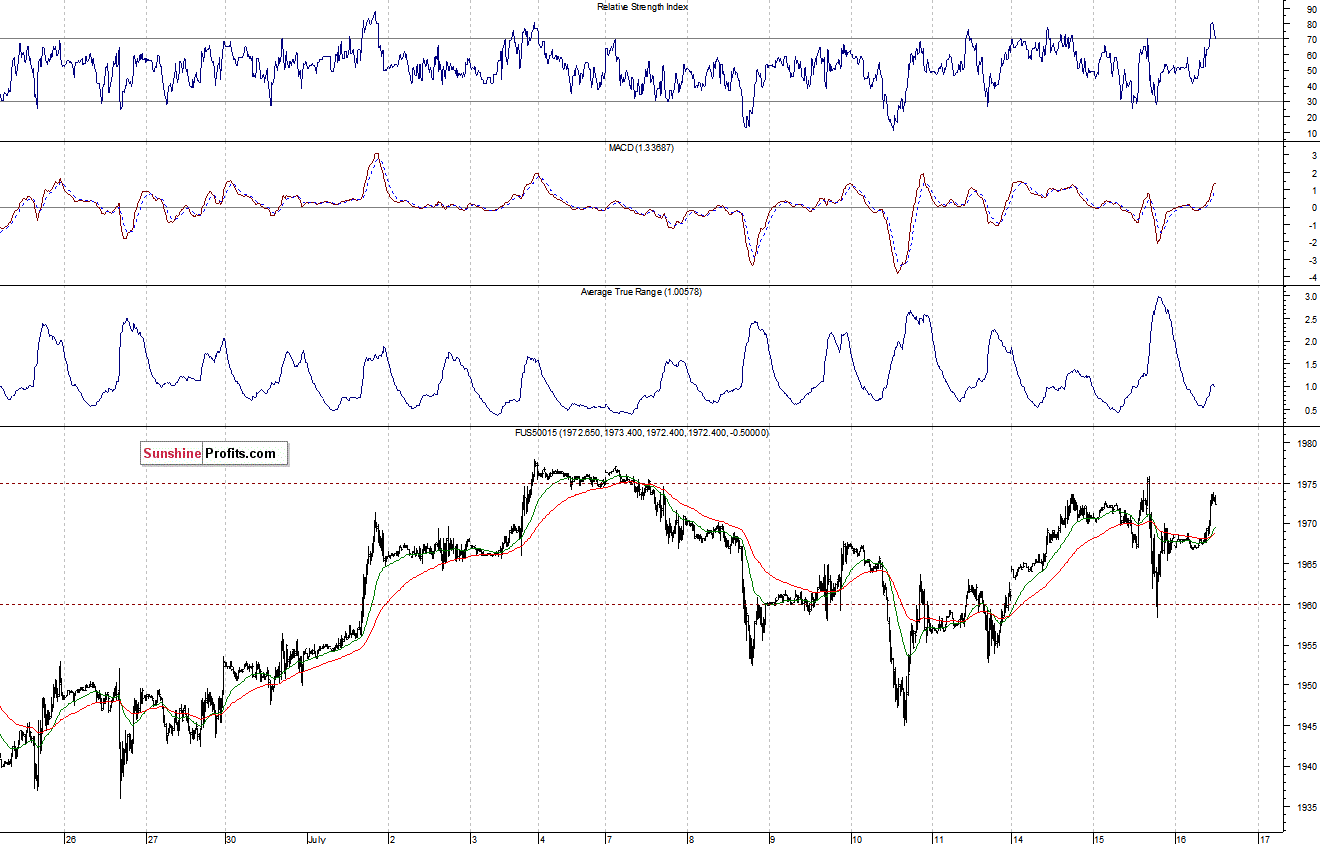
Expectations before the opening of today’s session are positive, with index futures currently up 0.3-0.5%. The European stock market indexes have gained 0.9-1.4% so far. Investors will now wait for some further quarterly earnings releases and the economic data announcements: Producer Price Index at 8:30 a.m., Industrial Production, Capacity Utilization at 9:15 a.m., NAHB Housing Market Index at 10:00 a.m., and the Fed’s Beige Book release at 2:00 p.m. The so-called “Beige Book” is Federal Reserve’s report of the U.S. economy. Published eight times per year, it is used to set monetary policy at the FOMC meetings. Therefore, it is quite important for the investors, who may treat it as a leading indicator for the future monetary policy adjustments. We will monitor its contents and report to you accordingly. The S&P 500 futures contract (CFD) is close to its all-time high, as it fluctuates slightly the level of 1,975. The nearest important support level is at around 1,960, marked by yesterday’s local low, as we can see on the 15-minute chart:
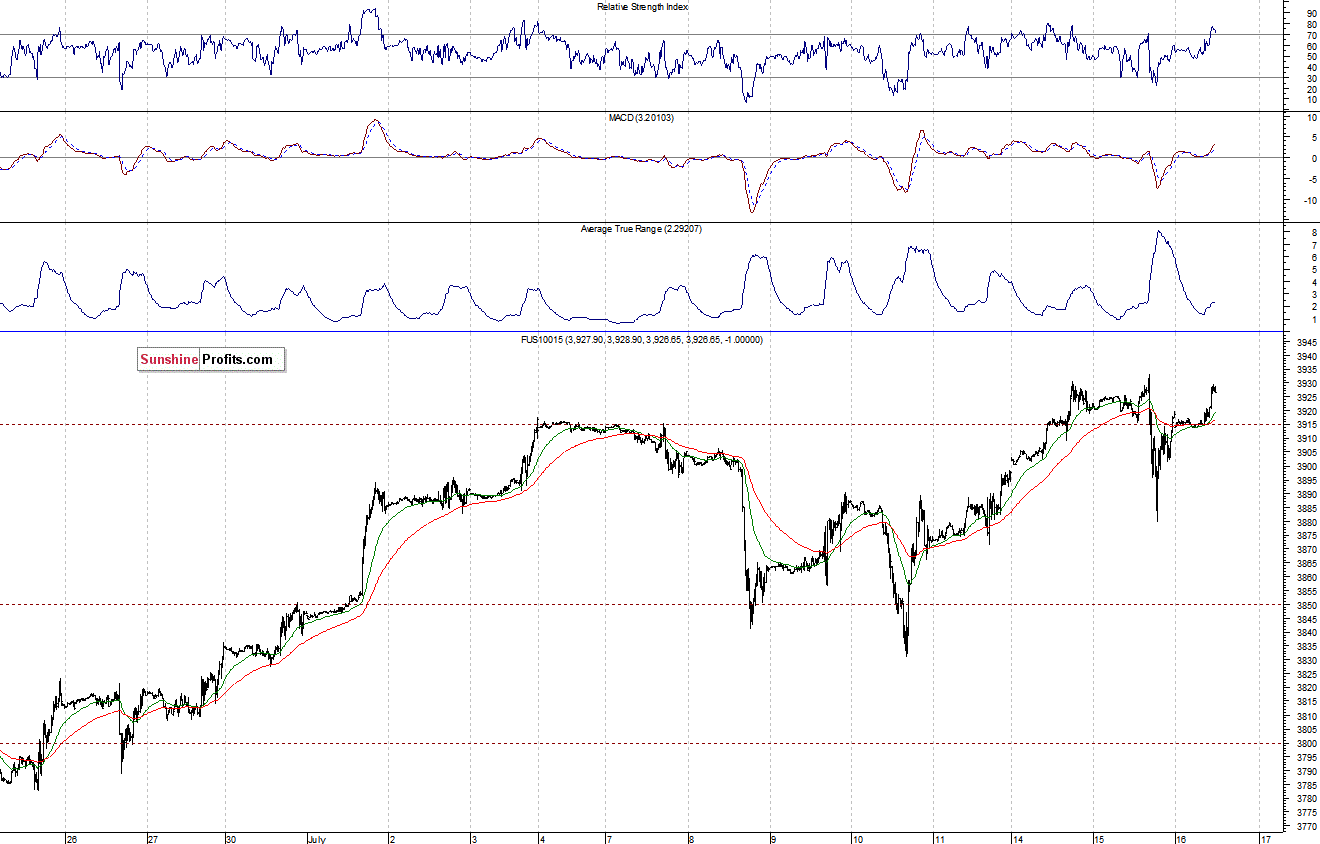
The technology Nasdaq 100 futures contract (CFD) is in a short-term consolidation, just below long-term high. The resistance level is at around 3,930, and the nearest important level of support is at around 3,880-3,900, as the 15-minute chart shows:
Concluding, the broad stock market extends its short-term consolidation, as it close to all-time highs. There have been no confirmed negative signals so far. However, we think that it is better to stay out of the market at this moment, as quarterly earnings releases, economic data announcements may lead to increased volatility. So, it may be better to cut back on your trading or even move to the sidelines completely, just to avoid low risk/reward ratio trades. We will let you know when we think it is safe to get back in the market.
Due to a holiday break, beginning from this Friday until Monday, July 28, there will be no Stock Trading Alerts. We apologize for inconvenience.
Thank you.
Paul Rejczak
Stock Trading Strategist
Stock Trading Alerts

