
Briefly: In our opinion, no speculative positions are justified.
Our intraday outlook remains neutral, and our short-term outlook is neutral:
Intraday
(next 24 hours) outlook: neutral
Short-term (next 1-2 weeks) outlook: neutral
Medium-term (next 1-3 months) outlook: neutral
Long-term outlook (next year): bullish
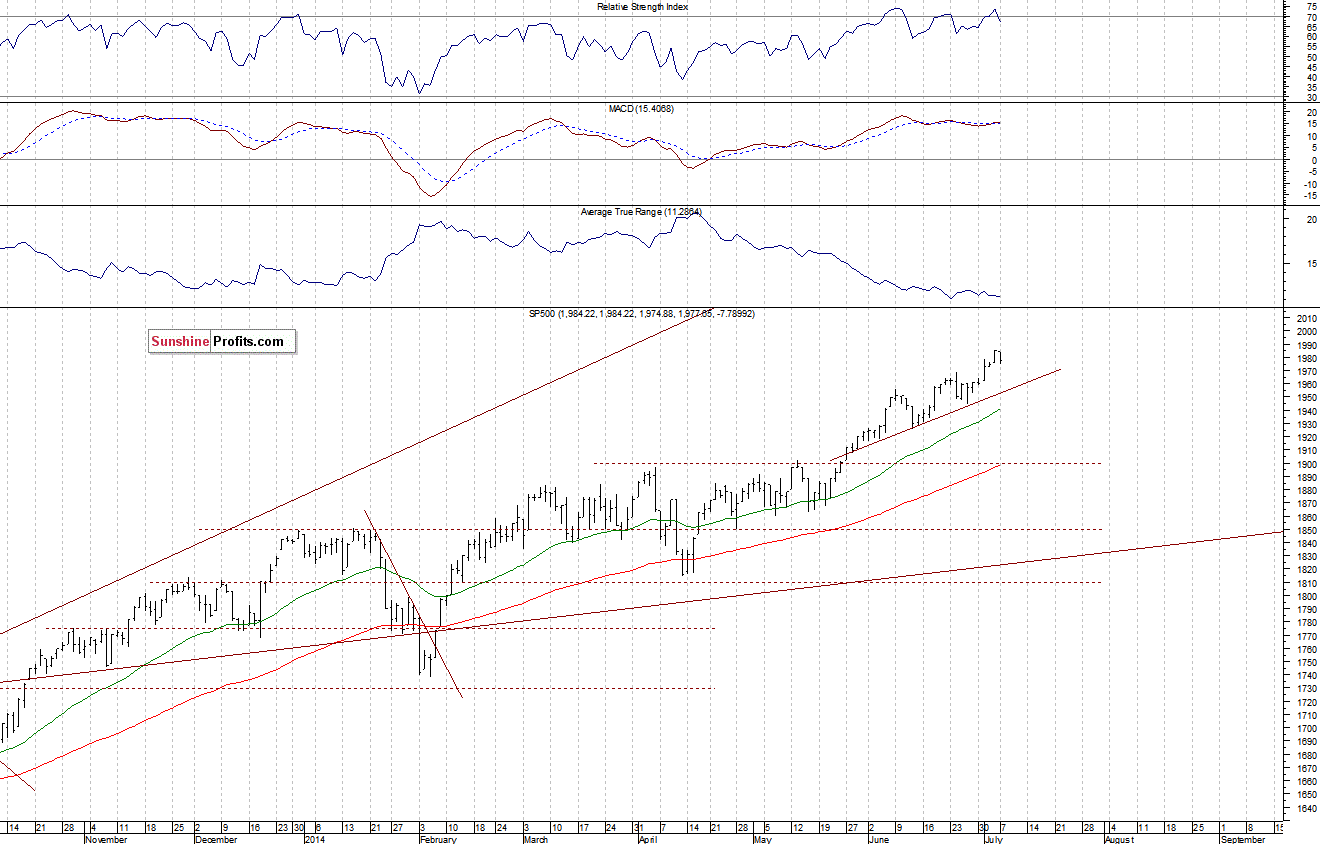
The main U.S. stock market indexes lost between 0.3% and 0.4%, retracing some of last Thursday’s move up, as investors took profits off the table. Our yesterday’s neutral intraday outlook has proved accurate. The S&P 500 index remains quite close to last Thursday’s all-time high of 1,985.59, which is positive. However, we can see some short-term overbought conditions. The resistance level is at around 1,980-1,985. On the other hand, the nearest important level of support is at 1,970, marked by some recent local extremes, and the next support is at 1,950-1,960. There have been no confirmed negative signals so far. The index continues to fluctuate above its month-long upward trend line, as we can see on the daily chart:
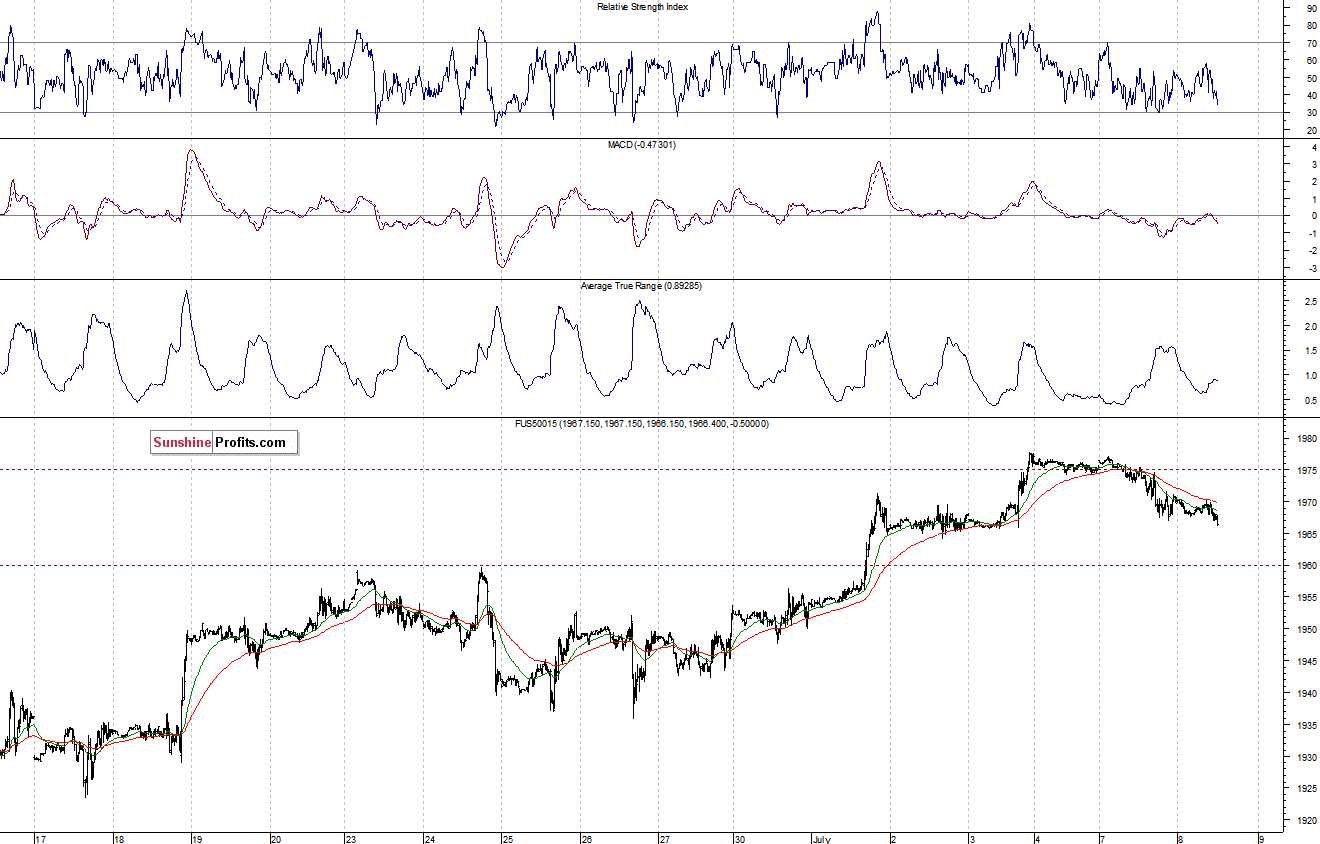
Expectations before the opening of today’s session are slightly negative, with index futures currently down 0.1-0.2%. The European stock market indexes have lost 0.4-0.6% so far. Investors will now wait for the JOLTS – Job Openings number announcement at 10:00 a.m. The S&P 500 futures contract (CFD) trades slightly below last week’s highs, below the level of resistance of 1,975-1,980. On the other hand, the nearest important support level is at 1,965, marked by recent consolidation, and the next support is at 1,960, marked by late June local highs, as the 15-minute chart shows:
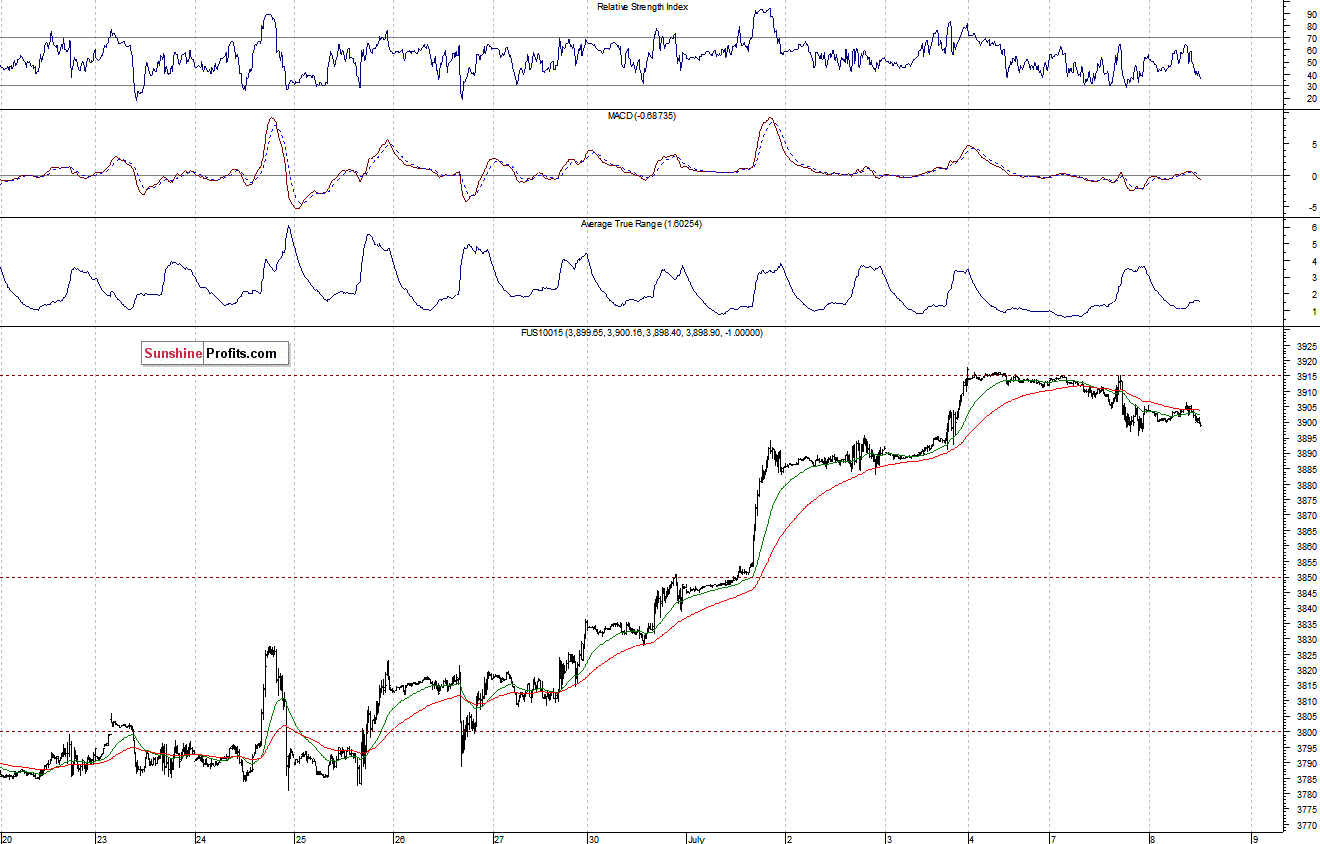
The technology Nasdaq 100 futures contract (CFD) is in a similar consolidation, just below its recent highs. The resistance level is at around 3,915, and the nearest important level of support is at 3,880-3,900, marked by previous resistance. For now, it looks like a flat correction within an uptrend:
Concluding, the broad stock market is in a rather flat correction, following last week’s rally to new all-time highs. There have been no confirmed negative signals so far, however, we can see some short-term overbought which may lead to a downward correction. Therefore, we think that it is better to stay out of the market at this moment.
Thank you.
Paul Rejczak
Stock Trading Strategist
Stock Trading Alerts

