
Briefly: In our opinion speculative long positions are still favored (with stop-loss at 1,910, S&P 500 index).
Our intraday outlook is neutral, and our short-term outlook remains bullish:
Intraday
(next 24 hours) outlook: neutral
Short-term (next 1-2 weeks) outlook: bullish
Medium-term (next 1-3 months) outlook: neutral
Long-term outlook (next year): bullish
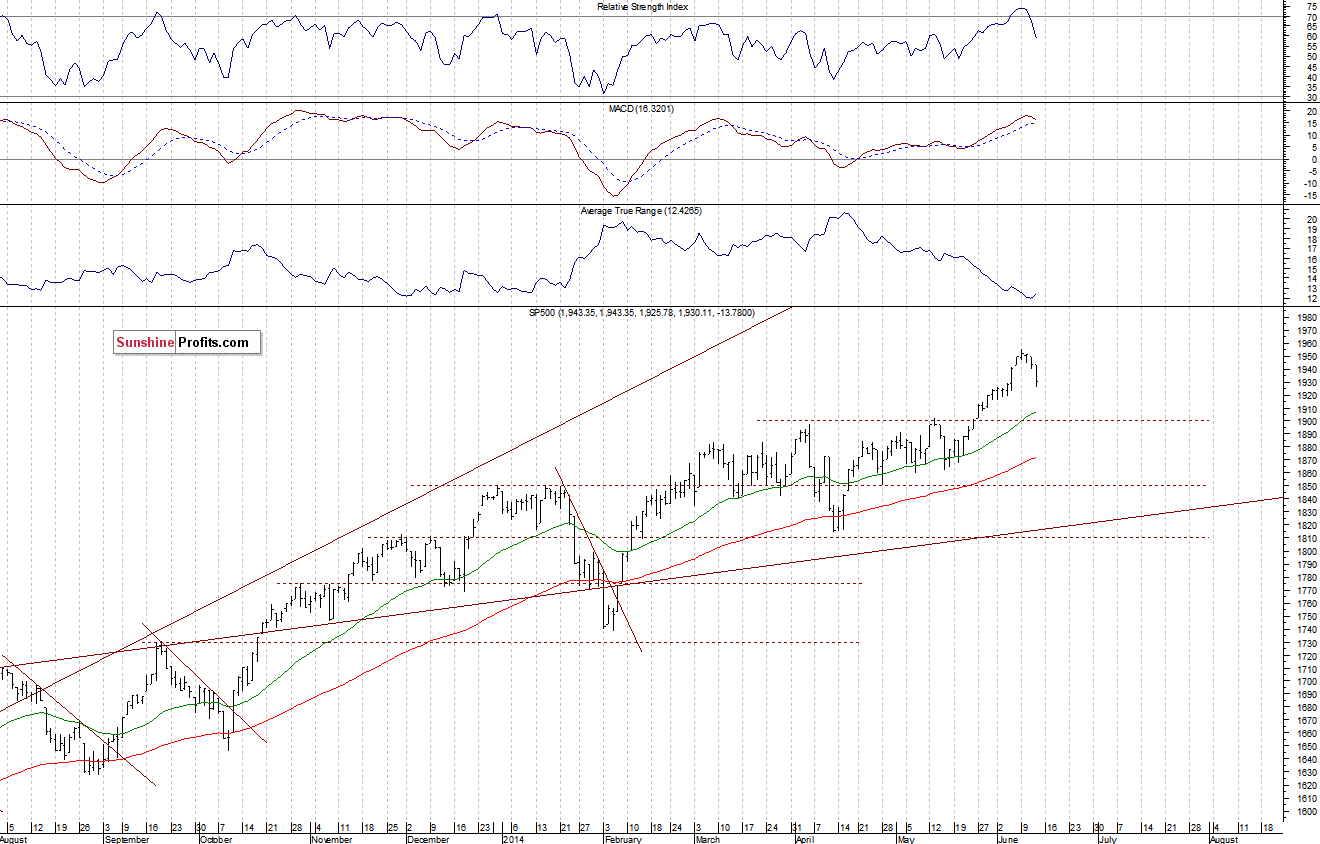
The U.S. stock market indexes lost between 0.7% and 0.9% on Thursday, extending their downward correction, as investors reacted to some worse-than-expected economic data announcements, Iraq crisis news. The S&P 500 index retraced some of its recent advance, as it bounced off the resistance level of 1,950-1,955, marked by Monday’s all-time high at 1,955.55. The nearest important support level is at around 1,915-1,925, marked by previous consolidation. The next support is at the psychological 1,900. For now, it looks like a downward correction within an uptrend. There have been no confirmed uptrend reversal signals so far, however, a breakdown below the above-mentioned support of 1,915-1,925 would be negative:
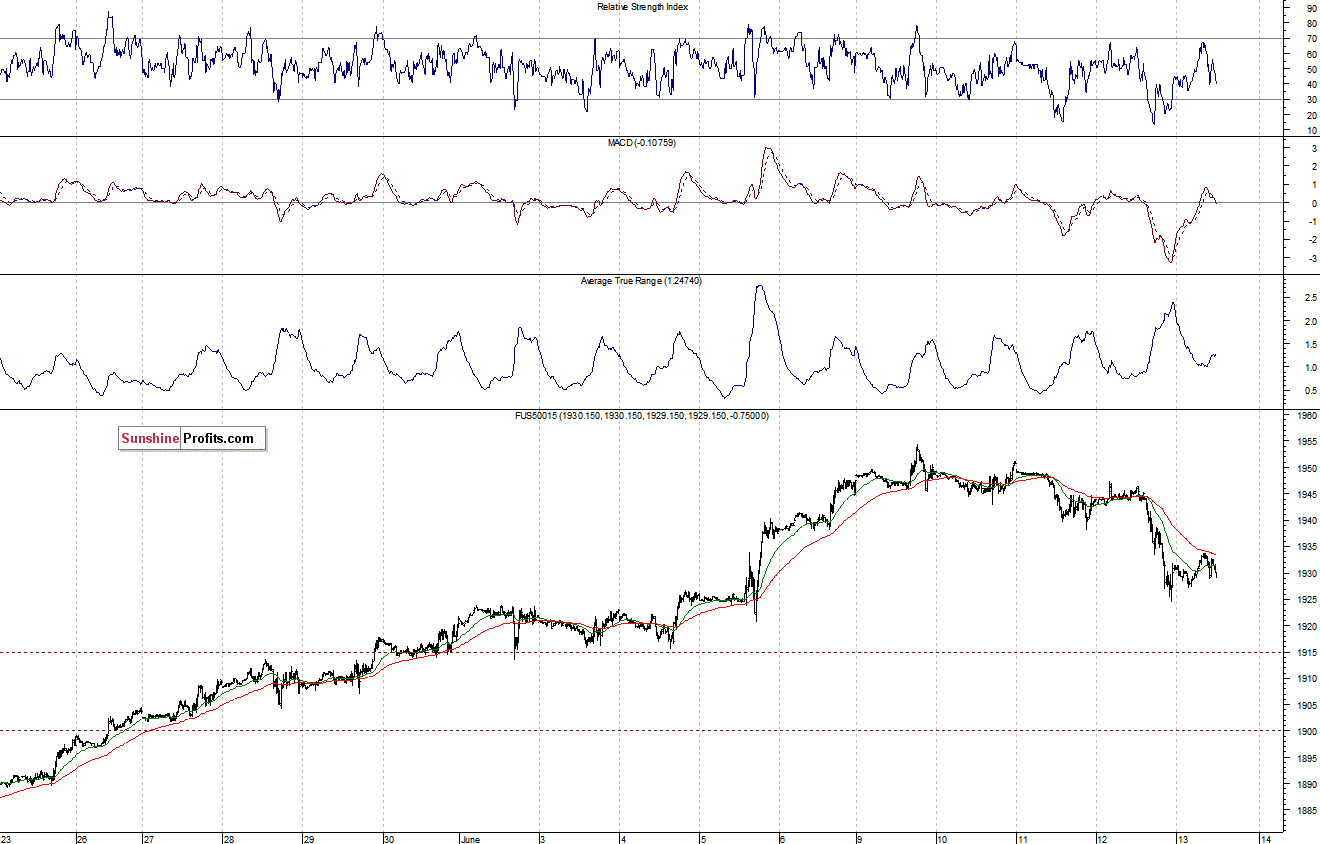
Expectations before the opening of today’s session are virtually flat. The main European stock market indexes have lost 0.6-0.9% so far. Investors will now wait for some economic data announcements: Producer Price Index at 8:30 a.m., Michigan Sentiment number at 10:00 a.m. The S&P 500 futures contract (CFD) is in a relatively narrow trading range, following yesterday’s decline. The nearest important support level is at around 1,925, and the level of resistance is at 1,935, as we can see on the 15-minute chart:
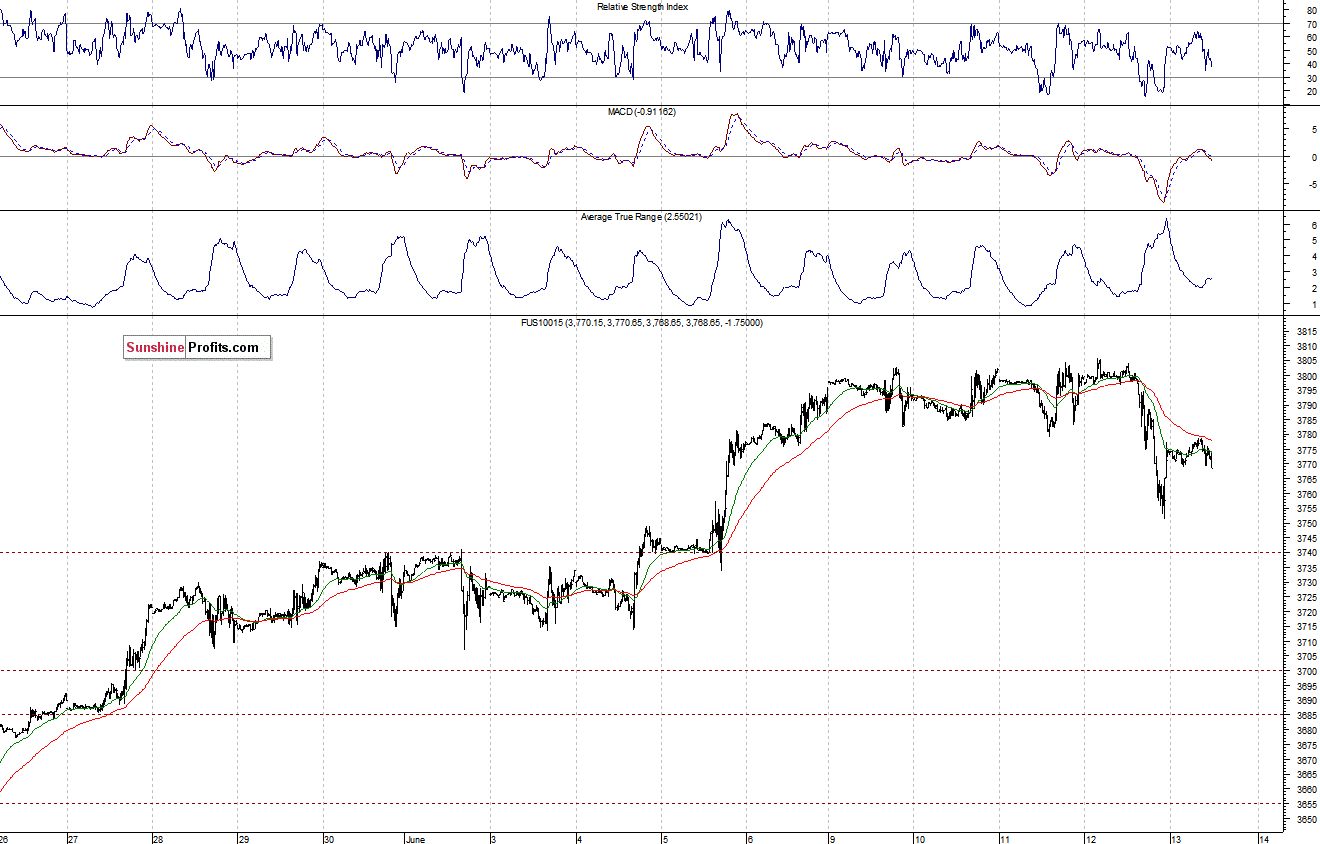
The technology Nasdaq 100 futures contract (CFD) bounced off slightly following yesterday’s move down. It fluctuates below the resistance of 3,780. The next resistance level is at the psychological 3,800. On the other hand, the support level is at around 3,750, as the 15-minute chart shows:
Concluding, the broad stock market is in a correction mode, as the S&P 500 index trades 25-30 points below Monday’s all-time high. We continue to maintain the long position, expecting some more uptrend. Our already profitable trade still seems justified, however, the stop-loss (or rather protect-gain in this case) remains at the level of 1,910 (S&P 500 index).
Thank you.
Paul Rejczak
Stock Trading Strategist
Stock Trading Alerts

