
Briefly: In our opinion speculative long positions are still favored (with stop-loss at 1,910, S&P 500 index).
Our intraday outlook is neutral, and our short-term outlook remains bullish:
Intraday
(next 24 hours) outlook: neutral
Short-term (next 1-2 weeks) outlook: bullish
Medium-term (next 1-3 months) outlook: neutral
Long-term outlook (next year): bullish
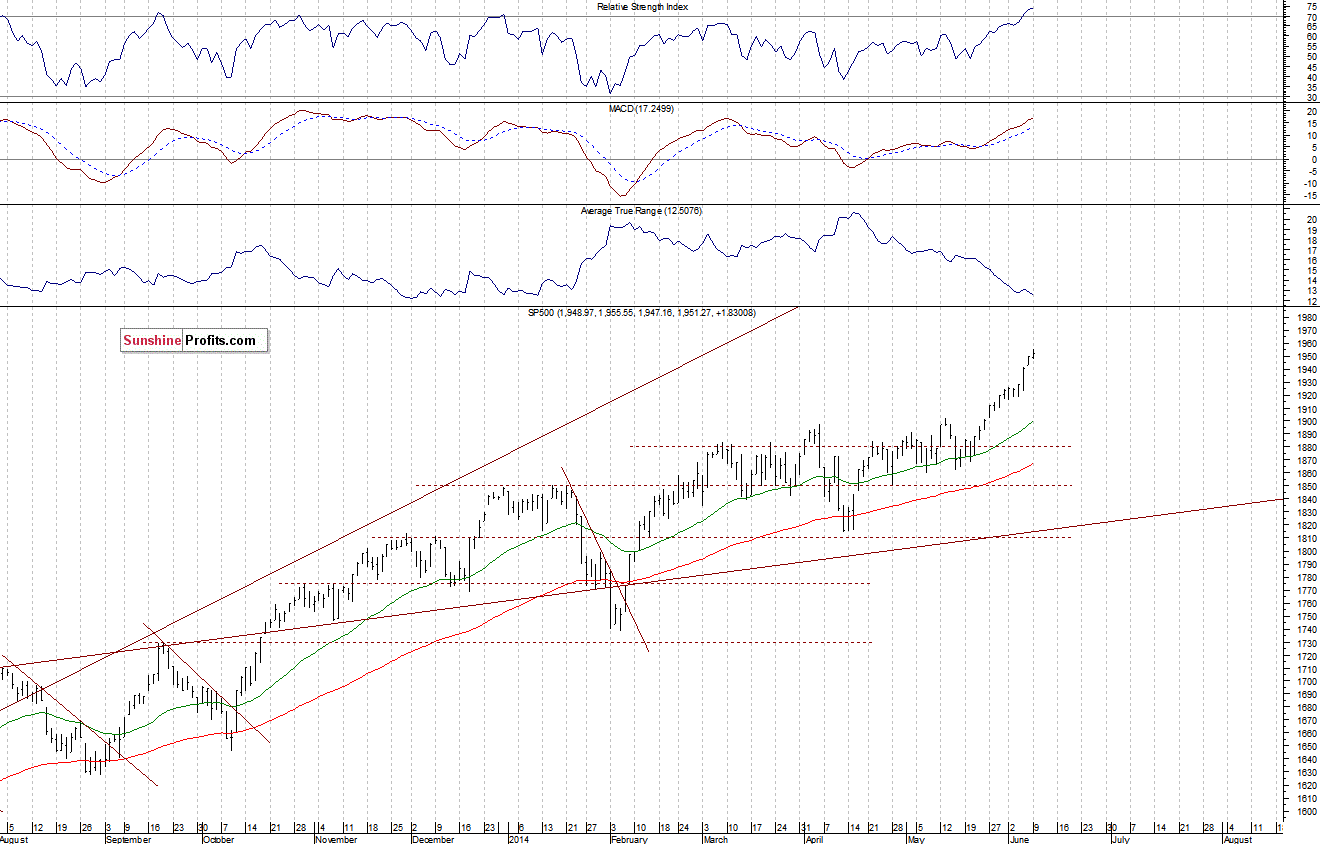
The main U.S. stock market indexes were virtually flat on Monday, following last week’s rally, as investors took some profits off the table. The S&P 500 index has managed to reach yet another new all-time high at 1,955.55. There have been no confirmed negative signals so far, however, we can see some short-term overbought. The nearest important resistance level is at around 1,950-1,955, and the support is at 1,940. The next support level is at 1,915-1,920, marked by recent consolidation, as we can see on the daily chart:
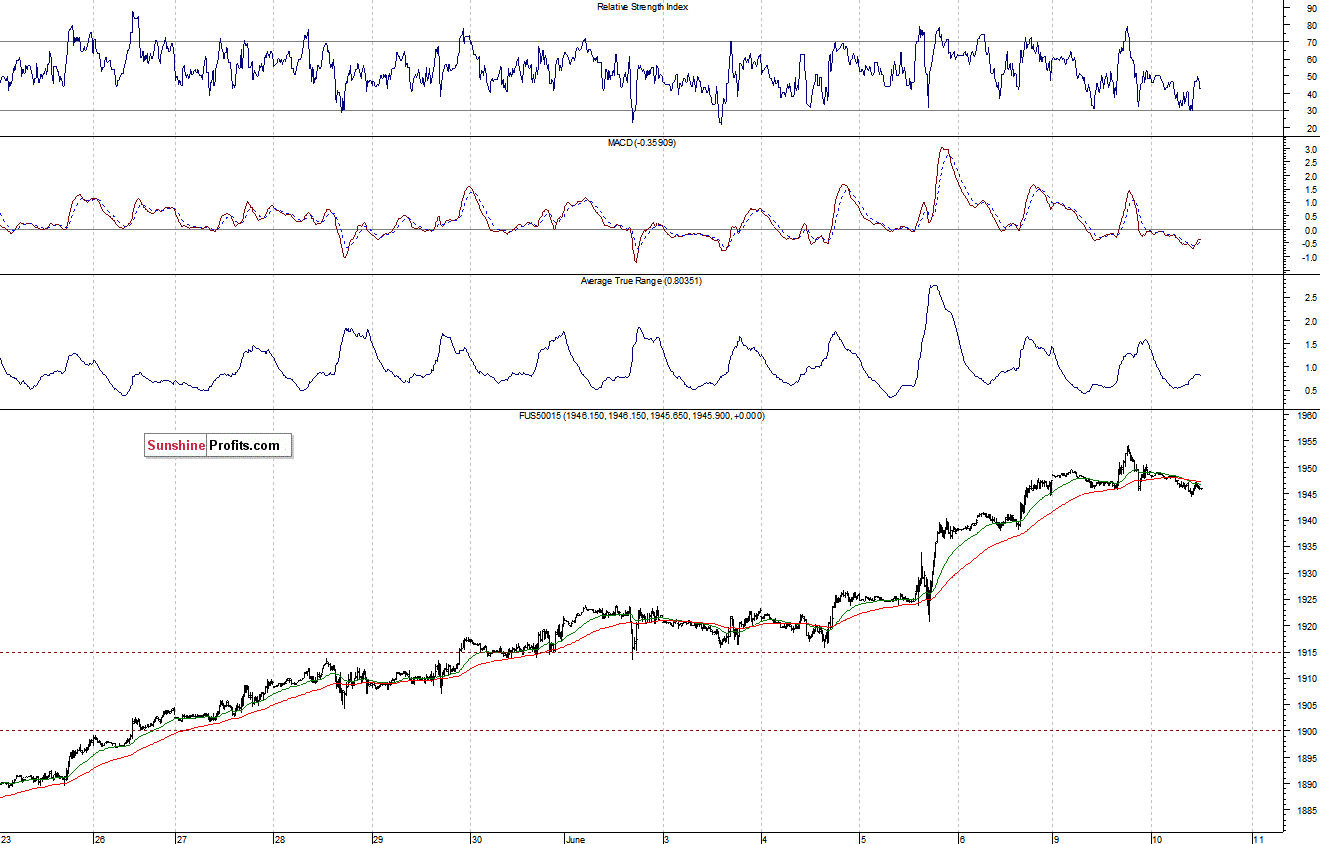
Expectations before the opening of today’s session are slightly negative, with index futures currently down 0.1-0.2%. The European stock market indexes have been mixed between -0.4% and +0.2% so far. Investors will now wait for the economic data announcements: Wholesale Inventories, JOLTS – Job Openings number at 10:00 a.m. The S&P 500 futures contract (CFD) is slightly below yesterday’s high, fluctuating in a relatively narrow trading range. The resistance level is at around 1,950-1,955, and the support is at 1,935-1,940, among others. For now, it looks like a flat correction within an uptrend:
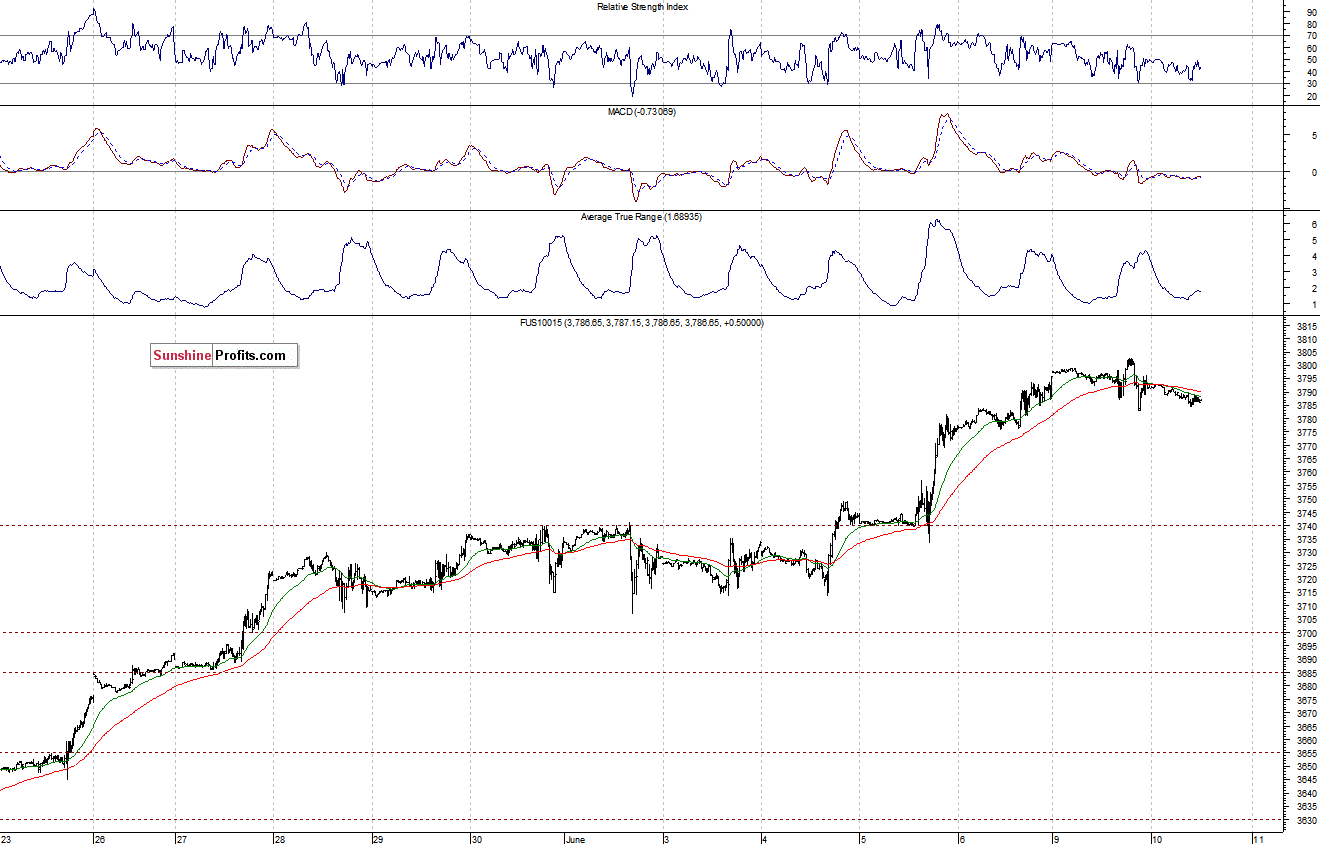
The technology Nasdaq 100 futures contract (CFD) is in a similar intraday trading range, as it consolidates following recent advance. The resistance level is at the psychological 3,800, and the nearest important level of support is at around 3,775-3,780, as the 15-minute chart shows:
Concluding, the broad stock market reached new all-time highs as it extended its long-term uptrend. We remain cautiously optimistic, expecting some further move up. Therefore, we continue to maintain our speculative long position, with stop loss at 1,910 (S&P 500 index).
Thank you.
Paul Rejczak
Stock Trading Strategist
Stock Trading Alerts

