
Briefly: In our opinion speculative long positions are still favored (with stop-loss at 1,850, S&P 500 index).
Our intraday outlook is bullish, and our short-term outlook remains neutral:
Intraday
(next 24 hours) outlook: bullish
Short-term (next 1-2 weeks) outlook: neutral
Medium-term (next 1-3 months) outlook: neutral
Long-term outlook (next year): bullish
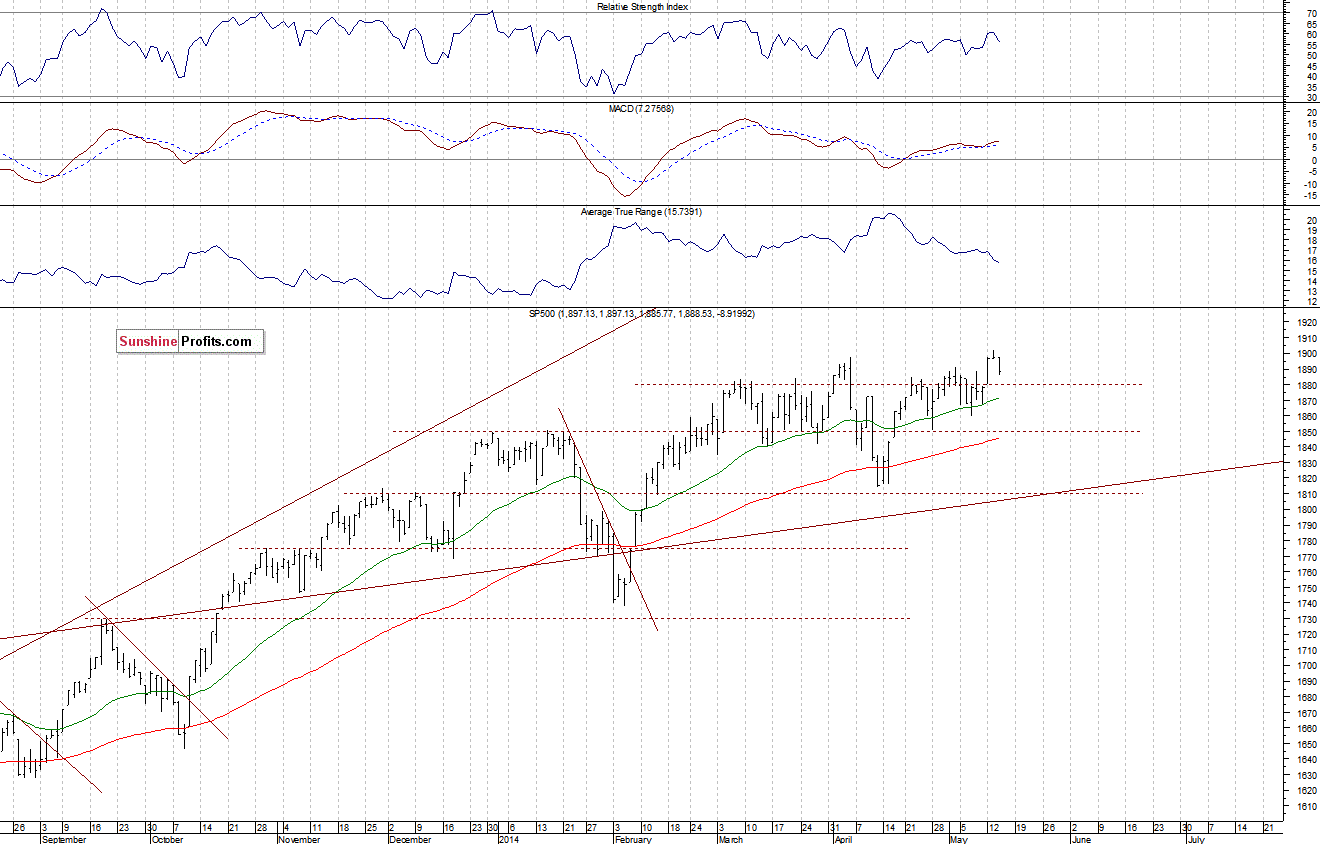
The U.S. stock market indexes lost between 0.5% and 0.6% on Wednesday, retracing some of their recent move up, as investors took profits off the table. The S&P 500 index bounced off the resistance level at around 1,900, marked by Tuesday’s all-time high of 1,902.17. On the other hand, the nearest level of support is at 1,860-1,870, and the next support is at 1,850. For now, it looks like a short-term correction within an uptrend, as we can see on the daily chart:
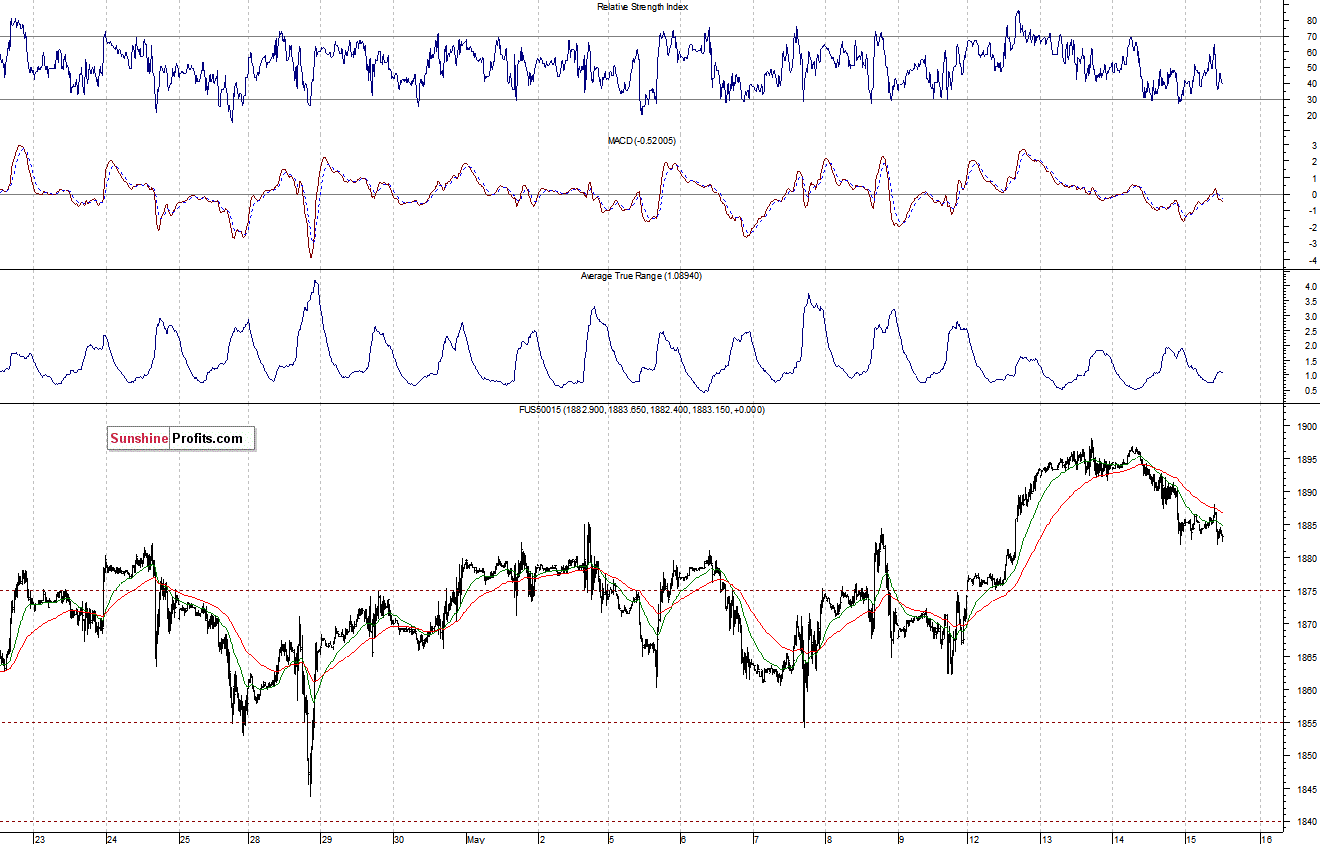
Expectations before the opening of today’s session are virtually flat, with index futures mixed between -0.1% and +0.1%. The main European stock market indexes have lost 0.1-0.2% so far, following some worse-than-expected economic data releases. Investors will now wait for the U.S. economic data announcements: Initial Claims, Consumer Price Index and Empire Manufacturing number at 8:30 a.m., Industrial Production, Capacity Utilization at 9:15 a.m., Philadelphia Fed, NAHB Housing Market Index at 10:00 a.m. The S&P 500 futures contract (CFD) is in a short-term downward correction, retracing some of its recent rally. The nearest important support is at 1,880-1,885, marked by previous resistance, and the resistance remains at the psychological 1,900:
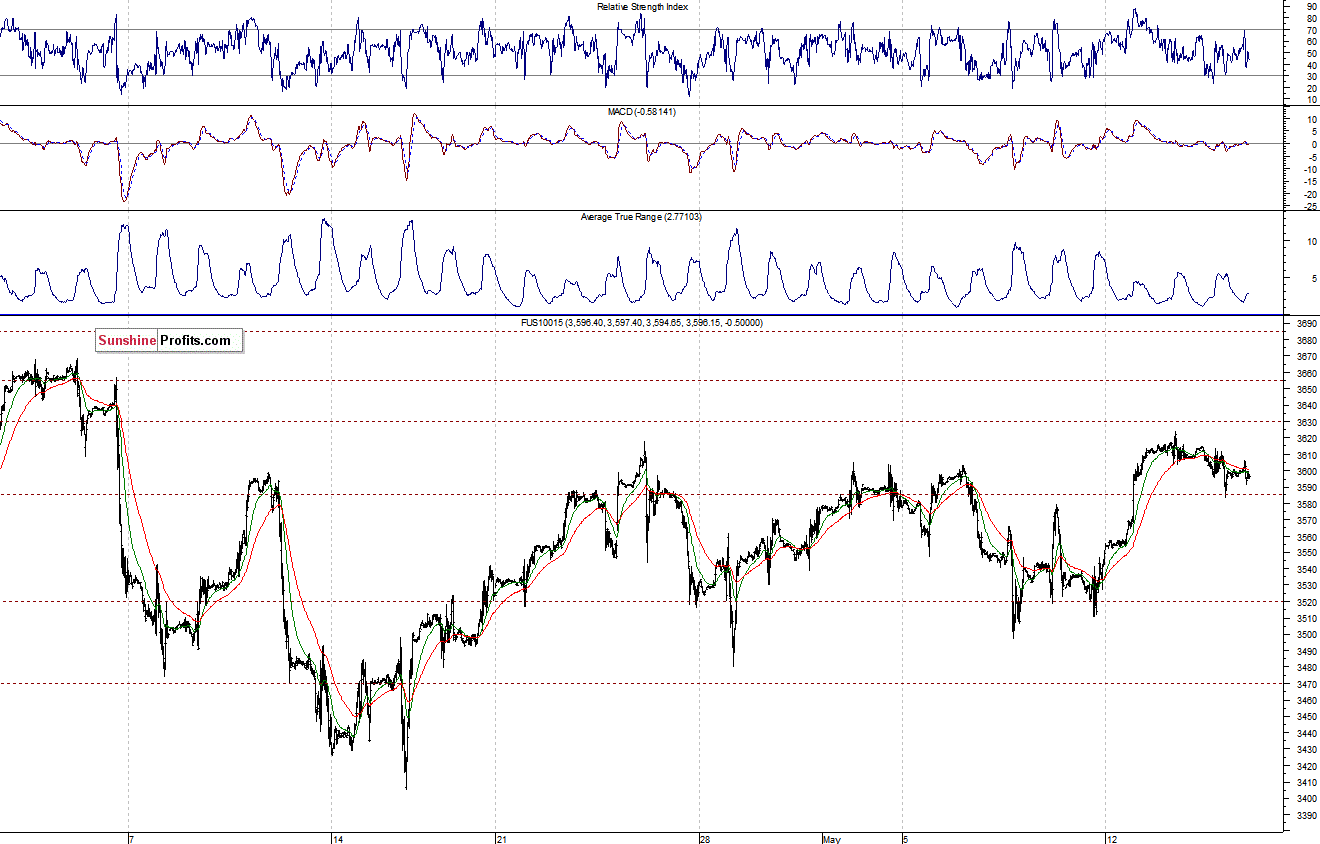
The technology Nasdaq 100 futures contract (CFD) trades in a relatively narrow range, following recent move up. The resistance is at 3,620-3,630, marked by the late April local high, among others. On the other hand, the support is at 3,580-3,600 (previous resistance). For now, it looks like a correction within short-term uptrend, as the 15-minute chart shows:
Concluding, there have been no confirmed negative signals so far, however, the broad stock market has retraced some of its recent uptrend. We continue to maintain our profitable long position, with stop-loss at 1,850 (S&P 500 index).
Thank you.
Paul Rejczak
Stock Trading Strategist
Stock Trading Alerts

