
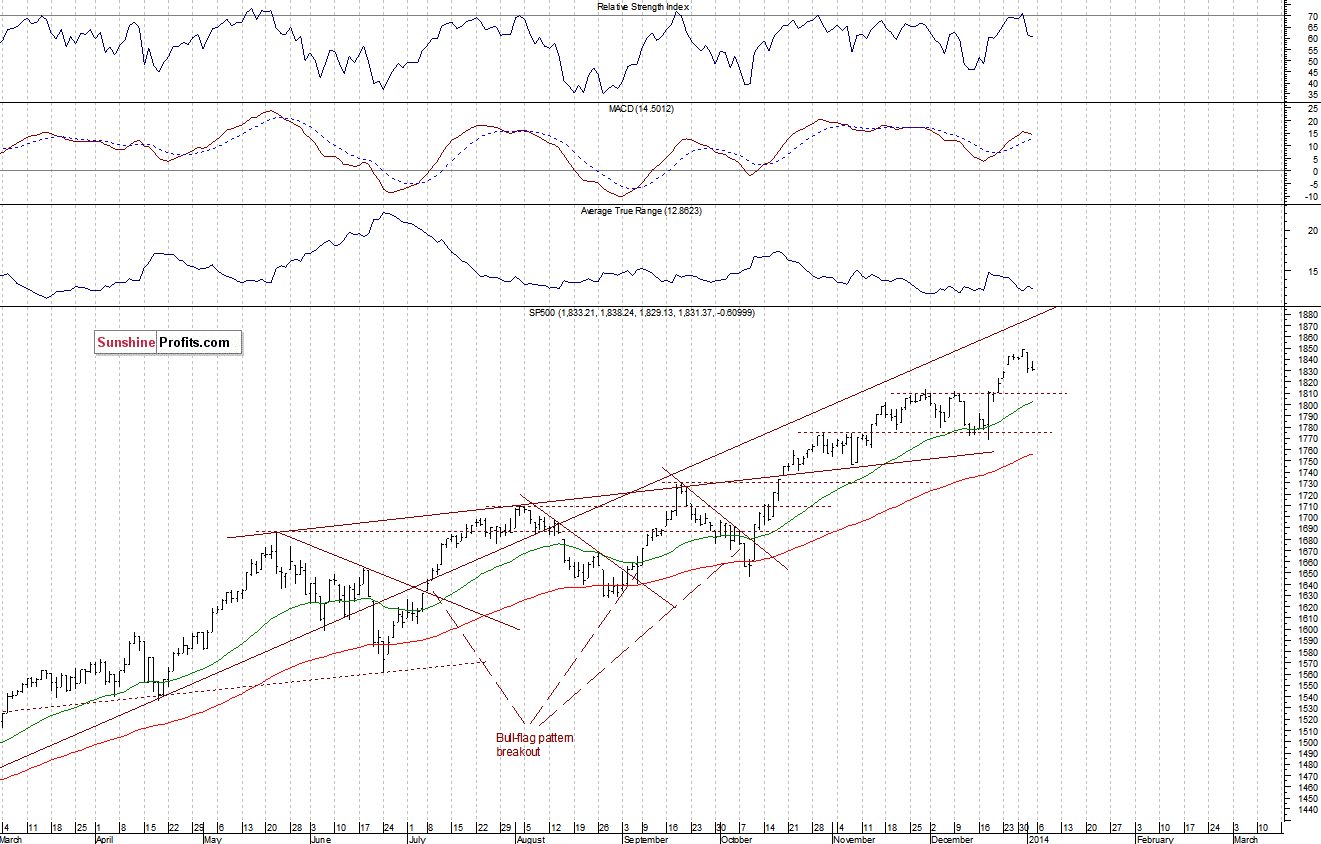
The main U.S. stock market indexes were mixed between -0.7% and +0.2% on Friday, as investors hesitated following recent pullback from long-term highs reached in the end of December. However, the broad market S&P 500 index was flat, as it extended short-term consolidation at around 1,830-1,835. The market tests its important support at 1,829.75-1,834.96, marked by the December 26 daily gap up. On the other hand the resistance remains at around 1,850, as we can see on the daily chart:
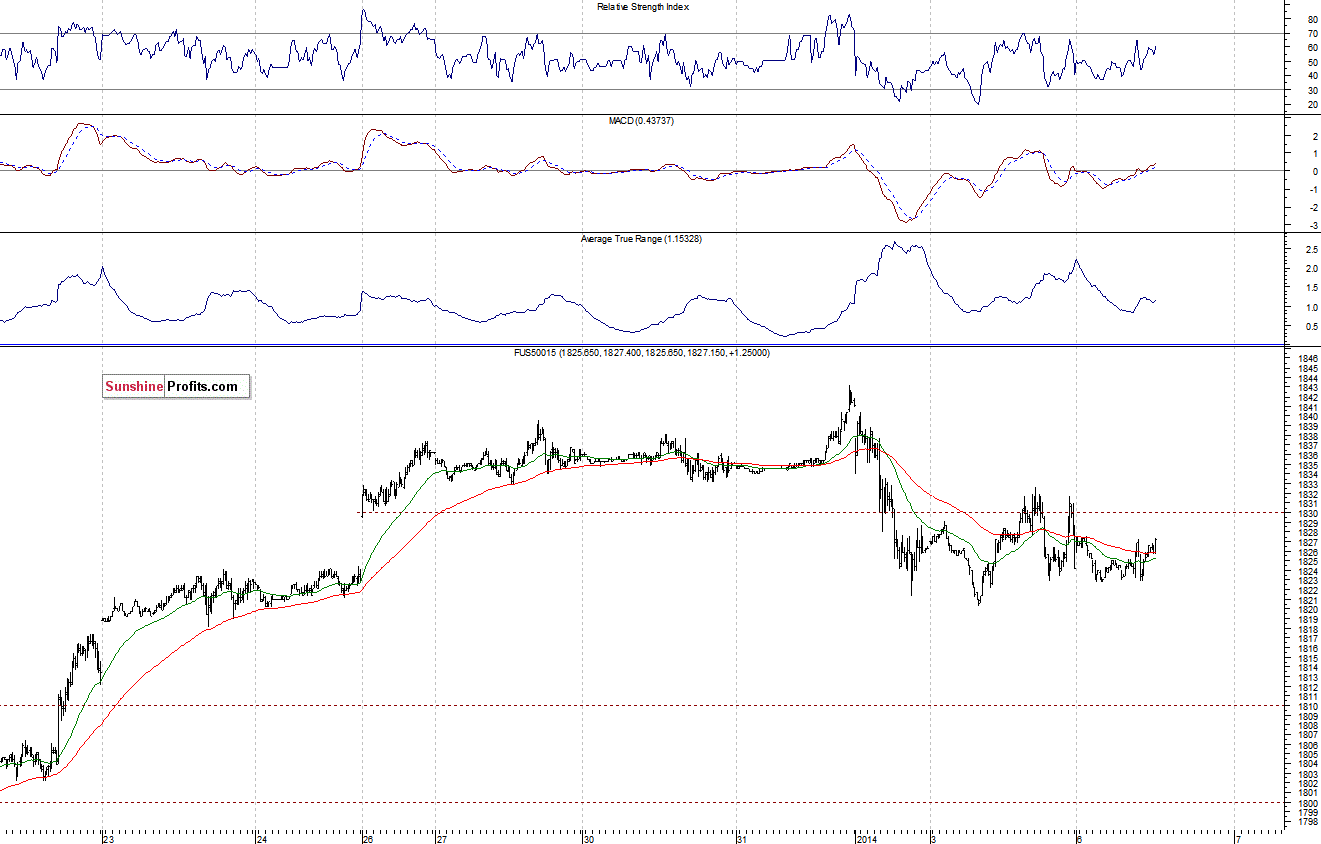
Expectations before the opening of today’s session are slightly positive, with index futures currently up 0.1%. The European stock market indexes have been mixed so far. Investors will now wait for some economic data announcements: Factory Orders and ISM Services number at 10:00 a.m. The S&P 500 futures contract (CFD) trades in a relatively narrow range, with the support at around 1,820 and the resistance at 1,830. Analogously, it trades within the December daily gap up, as the 15-minute chart shows:
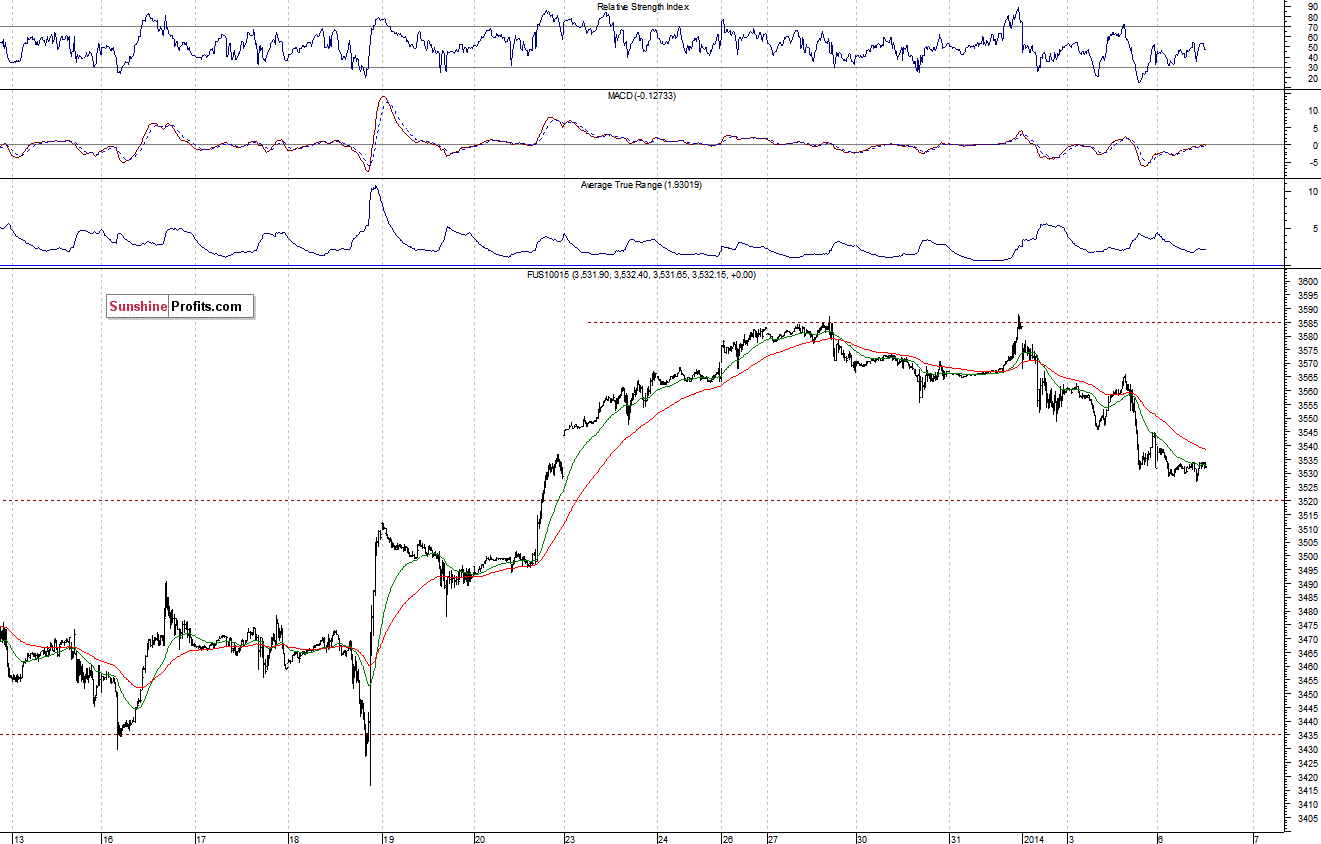
The technology sector Nasdaq 100 futures contract (CFD) retraced some of its late December rally, bouncing off the resistance at around 3,590-3,660. The nearest important resistance seems to be at around 3,550 at the moment. For now, it looks like a correction within an uptrend, as investors take profits following year-end rally:
Our intraday outlook is bullish, and our short-term outlook is neutral:
Intraday (next 24 hours) outlook: bullish
Short-term (next 1-2 weeks) outlook: neutral
Medium-term (next 1-3 months) outlook: neutral
Long-term outlook (next year): bullish
Thank you,
Paul Rejczak

