
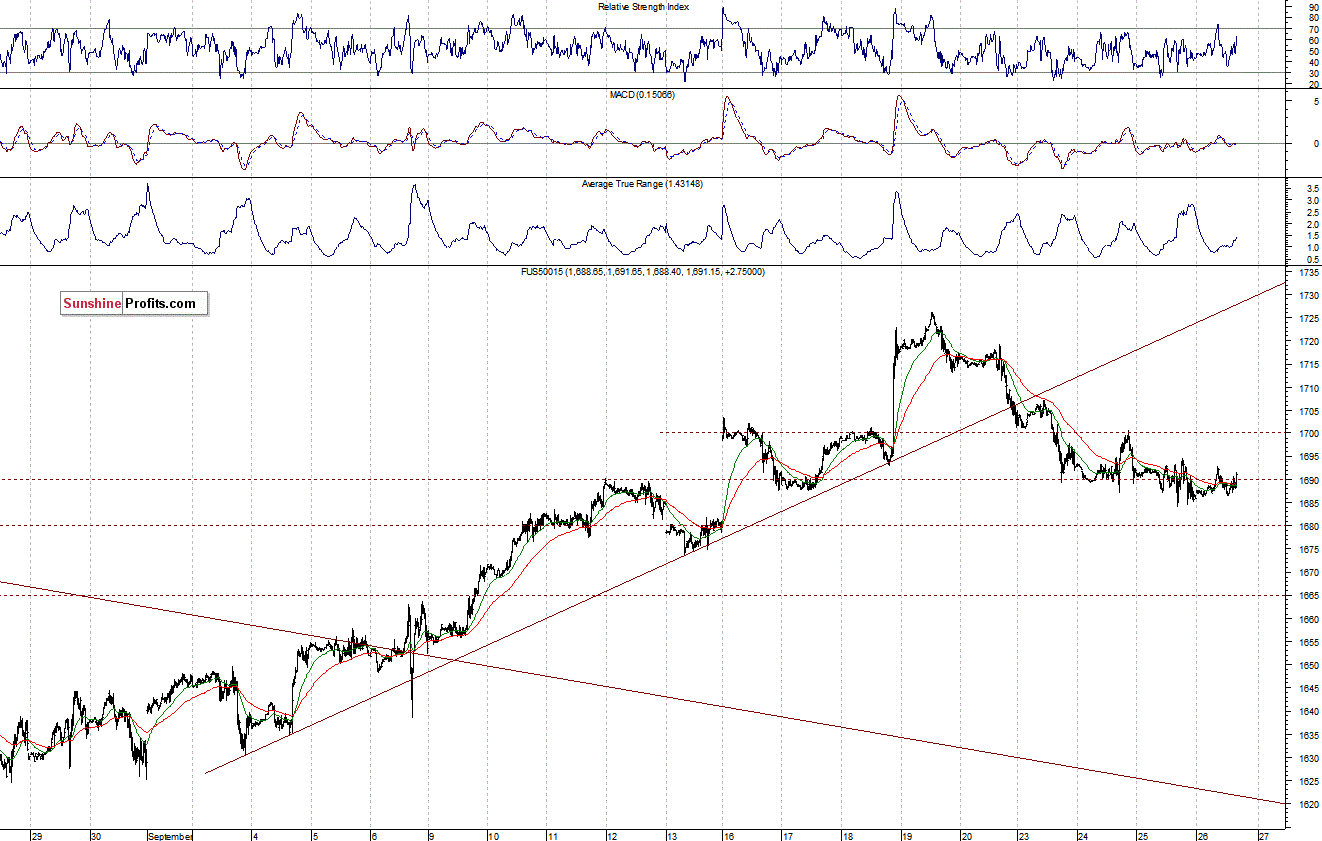
The U.S. stock market indexes have opened up 0.2-0.5%, following better-than-expected Initial Claims data release. The S&P 500 index approaches the level of 1,700 once again, as it currently gains 0.4%. The nearest short-term resistance is at around 1,700, and the support is at 1,688.73-1,691.70, marked by the September 16 daily gap up. The S&P 500 futures contract (CFD) continues to fluctuate around the level of 1,690, still with no confirmed short-term downtrend reversal signals, as we can see on the 15-minute chart:
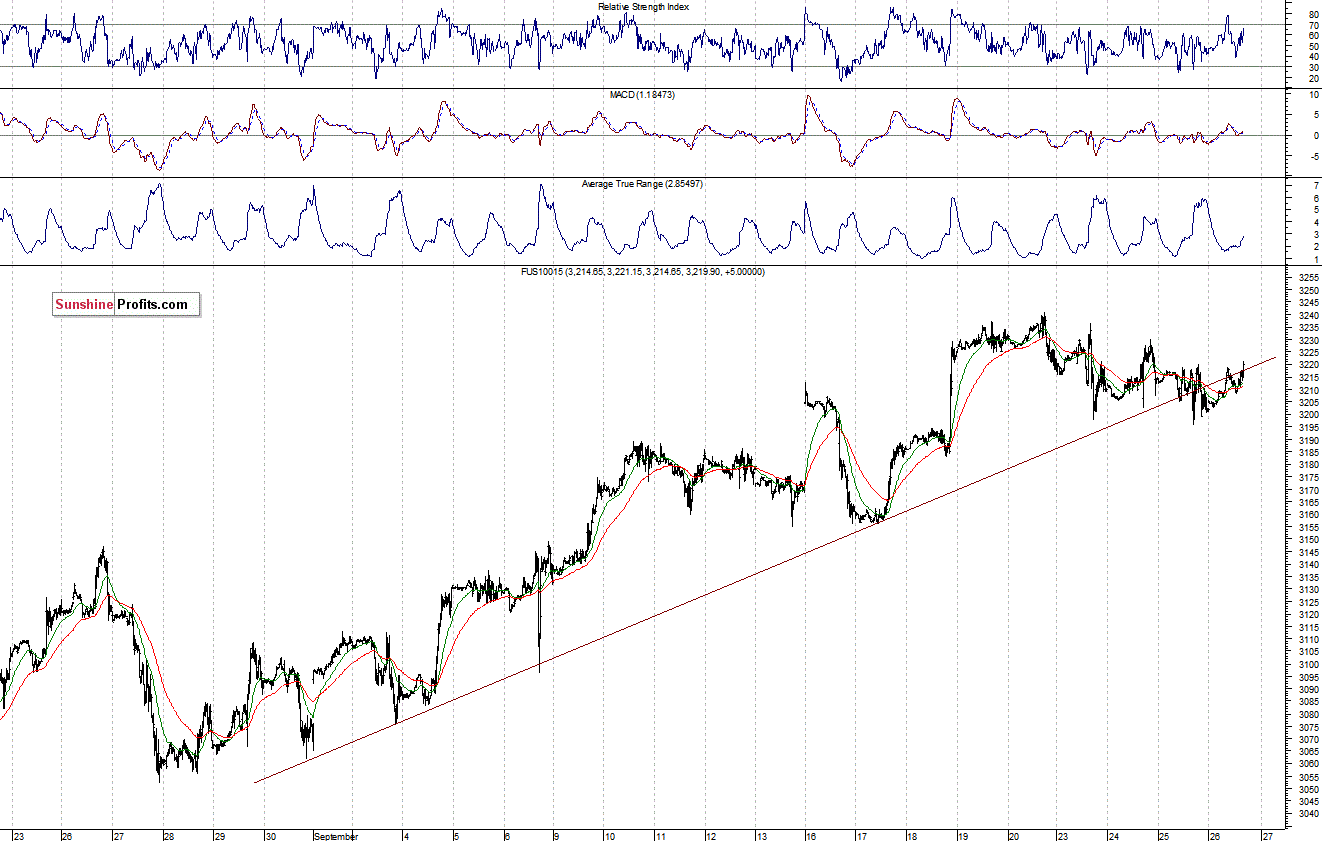
The Nasdaq 100 futures contract (CFD) trades slightly above the recent upward trend line again. It also remains within a striking distance of the recent all-time highs, which is a positive sign. The resistance is at 3,230-3,240, marked by last week’s topping consolidation. On the other hand, the nearest level of support is at around 3,200, as the 15-minute chart shows:
Thank you,
Paul Rejczak
PS. Please note that the above commentaries will be available free of charge only until Friday, Sep 27, 2013 and will become a premium product after this date.

