
tools spotlight

-
Dollar Weakness Meaningless For Gold
September 3, 2021, 9:18 AMGold and junior miners declined alongside the USD Index for the second straight day. It doesn’t usually look like this… something is going on.
Floating Around the Rumor Mill
With the USD Index struggling for support in recent days, heavy speculation has overshadowed strong fundamentals. For example, after European Central Bank (ECB) Governing Council member Robert Holzmann said on Aug.31 that “we are now in a situation where we can think about how to reduce the pandemic special programs,” the hawkish rhetoric accelerated the ECB’s perceived taper timeline. In turn, this lit a fire under the EUR/USD – which accounts for nearly 58% of the movement of the USD Index.
And adding fuel to that fire, Bundesbank President Jens Weidmann said on Sep. 1 that “we have to watch the risks to the outlook for prices. Accommodative monetary remains appropriate, but we shouldn’t disregard the risk to too-fast inflation.” For context, Eurozone inflation increased by 3% year-over-year (YoY) on Aug. 31 (the red bar).
Please see below:
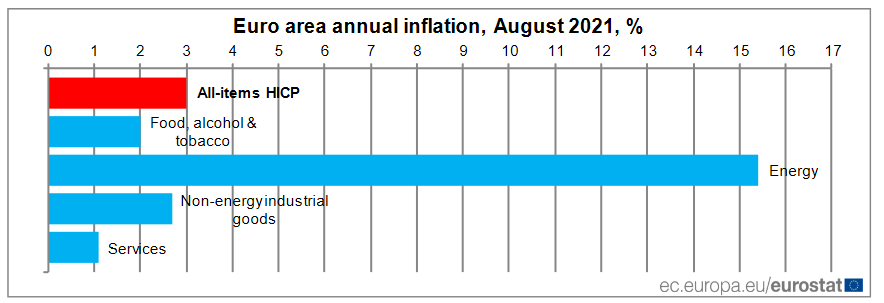
However, it’s important to remember that U.S. inflation increased by 5.28% YoY in July (the latest data released on Aug. 11) and realized U.S. GDP has already surpassed its pre-pandemic high. Conversely, the Eurozone still remains a relative underperformer.
Please see below:
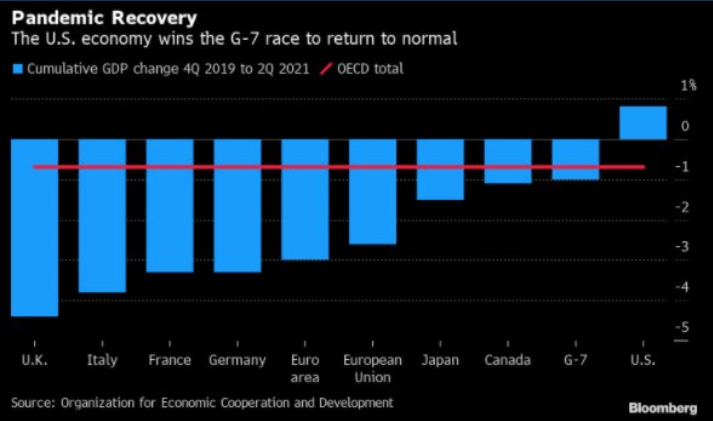
To explain, the blue bars above represent the percentage change in countries’ GDP levels relative to Q4:2019. If you analyze the middle of the chart, you can see that the Eurozone remains a relative laggard. Conversely, if you turn to the right side of the chart, you can see that the U.S. is the only G7 country that’s recouped (and now exceeded) what was lost during the coronavirus crisis. As a result, the U.S. dollar should benefit from the fundamental outperformance over the medium term.
In addition, while the hawks cast doubt, ECB President Christine Lagarde outlined her monetary milestones during her press conference on Jul. 22.
I quoted her remarks on Jul. 23:
“The forward guidance rests on three key criteria’s if you will:
“We see inflation reaching 2% well ahead of the end of our projection or rising, that’s like number one and number two, durably for the rest of the projection horizon. And thirdly, we judge that realized progress in underlying inflation is sufficiently advanced to be consistent with inflation stabilizing at 2% over the medium term …. So, by these three legs, we’re essentially saying, first of all, that we want to see inflation reach 3% well ahead of the end of our projection horizon.”
 Source: Reuters
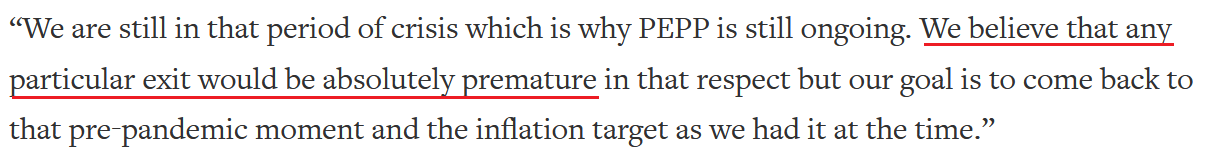
 Thus, with Lagarde implying that she wants to see “inflation reach 3% well ahead” of removing policy support, hitting the milestone once in August likely means several more months of dovish observation. To that point, ECB Chief Economist Philip Lane said the following on Aug 25.
I quoted his remarks on Aug. 26:
“Regardless of when PEPP might end, that’s not the end of the ECB’s role in terms of QE. This is why we don’t need a huge lead time to think about it. We already know what we’re doing until March, which is maintaining favorable financing conditions, so we have time this autumn to work out what comes next.”
And what does this mean for a prospective taper announcement?
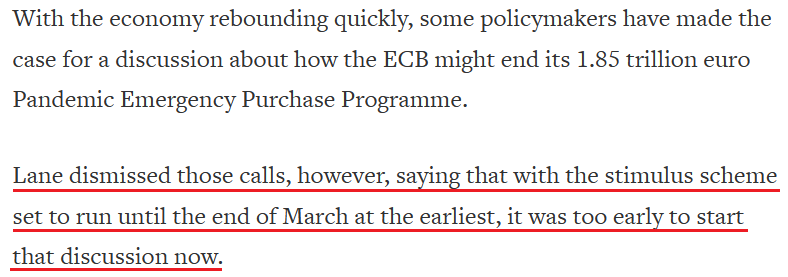 Source: Reuters
 As a result, with the ECB hawks likely in the minority, why such a strong reaction from the EUR/USD? Well, with the Fed downplaying even higher inflation and a dovish-for-longer ECB the major consensus, the recent comments surprised investors. And with algorithms not discriminating, the mantra of ‘shoot first, ask questions later’ was on full display when the news hit the wire.
However, Stephen Gallo, European Head of FX strategy at BMO Capital Markets, said the following on Sep. 2:
“Leveraged funds were short euro-dollar, so since Jackson Hole we have seen some of those shorts being covered, but the move doesn't look violent, and there are still decent numbers of people looking to go short again. As long as the dollar doesn't have a reason to weaken, I don't think the euro on its own will break out significantly to the top side.”
Have You Seen These New Openings?
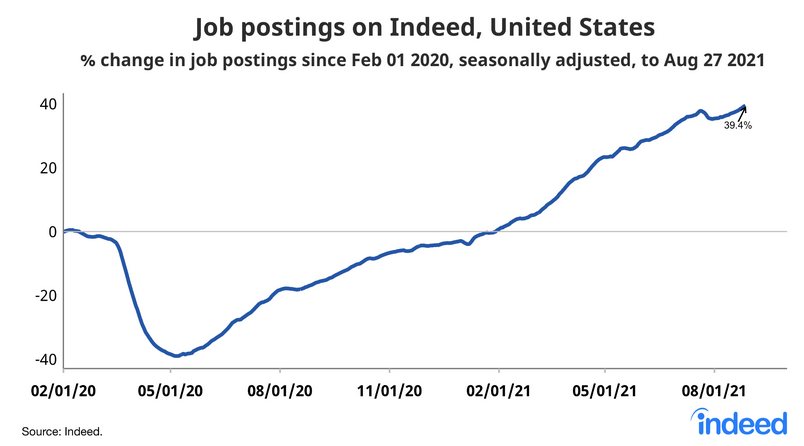
To that point, while U.S. nonfarm payrolls may disappoint today – as the spread of the Delta variant may have decelerated hiring activity – the latest coronavirus strain is unlikely to derail the medium-term momentum. For one, enhanced unemployment benefits end nationwide this month, and the lack of stimulus should accelerate U.S. citizens’ desire to reenter the workforce. Second, Indeed revealed on Sep. 1 that “[job postings] were 39.4% above February 1, 2020, the pre-pandemic baseline, after adjusting for seasonal variation. Postings were up 1.7 percentage points in the past week and 4.2 points over the past four weeks.” As a result, the Fed’s taper timeline has only been delayed by the Delta variant.
Please see below:
As further evidence, I noted on Sep. 2 that with more than 1.4 million job openings in the restaurants & accommodations sector, there are plenty of jobs available for individuals that want them.
I wrote:
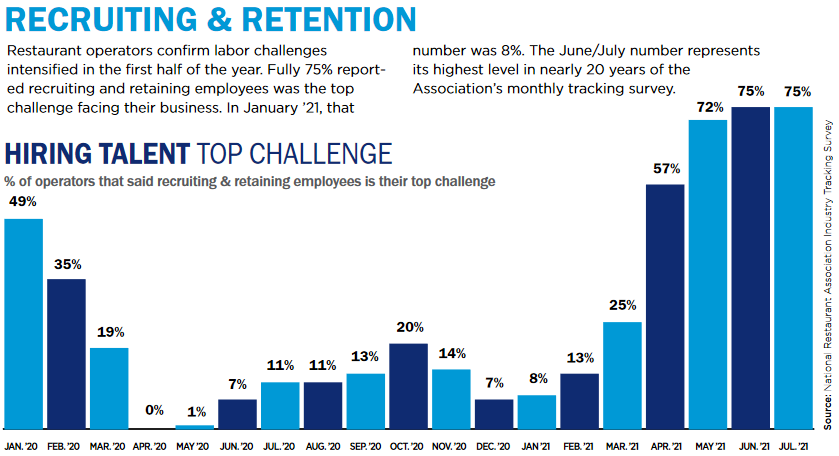
With the National Restaurant Association revealing that “labor challenges intensified in the first half of the year” and that “75% [of respondents] reported recruiting and retaining employees was the top challenge facing their business,” wage inflation is poised to accelerate. For context, only 8% of respondents cited hiring as their “top challenge” in January but “the June/July number [75%] represents its highest level in nearly 20 years of the Association’s monthly tracking survey.”
Please see below:
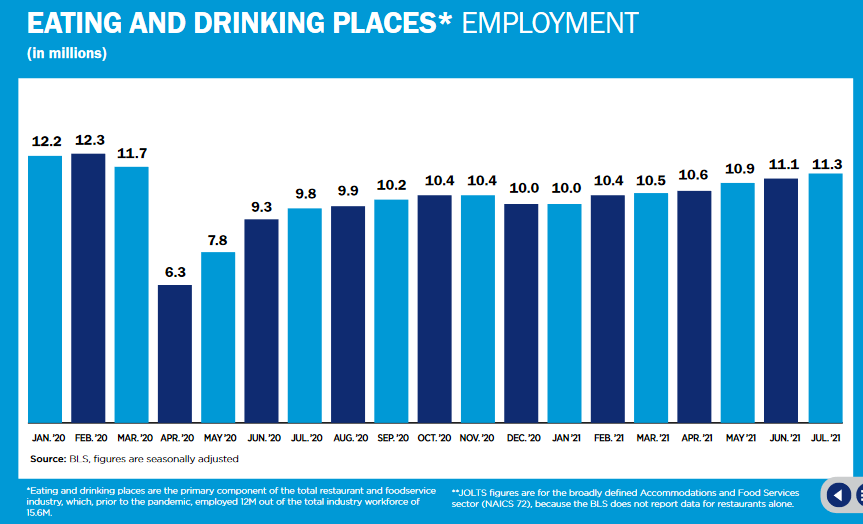
What’s more, staffing levels at restaurants are more than 8% below their pre-pandemic high of 12.3 million. And with the restaurants & accommodations sector home to more than 1.4 million job openings as of Jun. 30 (BLS data), the figure was more than double the January 2021 reading and was the highest since the data collection began in 2000.
Don’t Buy Indices When They Are Skateboarding
Also supportive of future USD Index strength, the S&P 500 is skating on a knife’s edge. And while the economic momentum should resume once the Delta variant fades, Goldman Sachs reduced its third-quarter GDP growth estimate for the second time on Sep. 2.
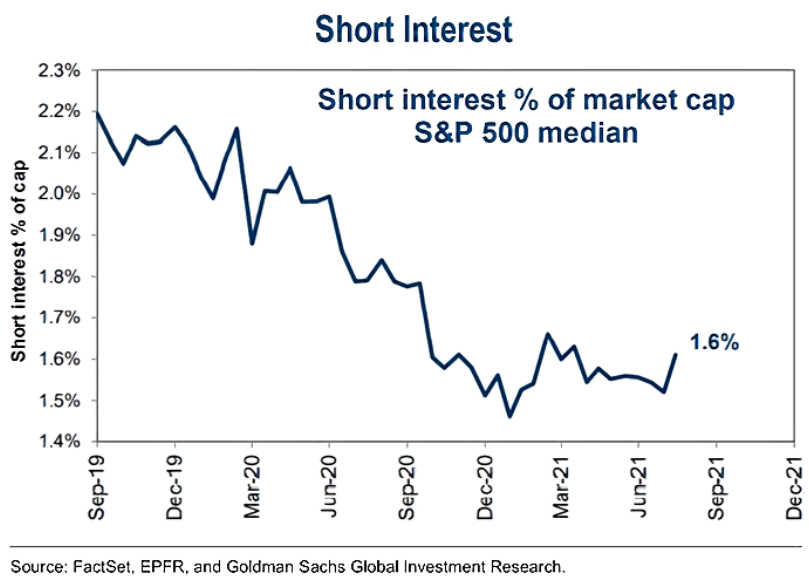
Likewise, short interest in the S&P 500 has perked up once again. For context, when short interest rallied off of the lows in January 2021, volatility spiked and the NASDAQ Composite suffered mightily.
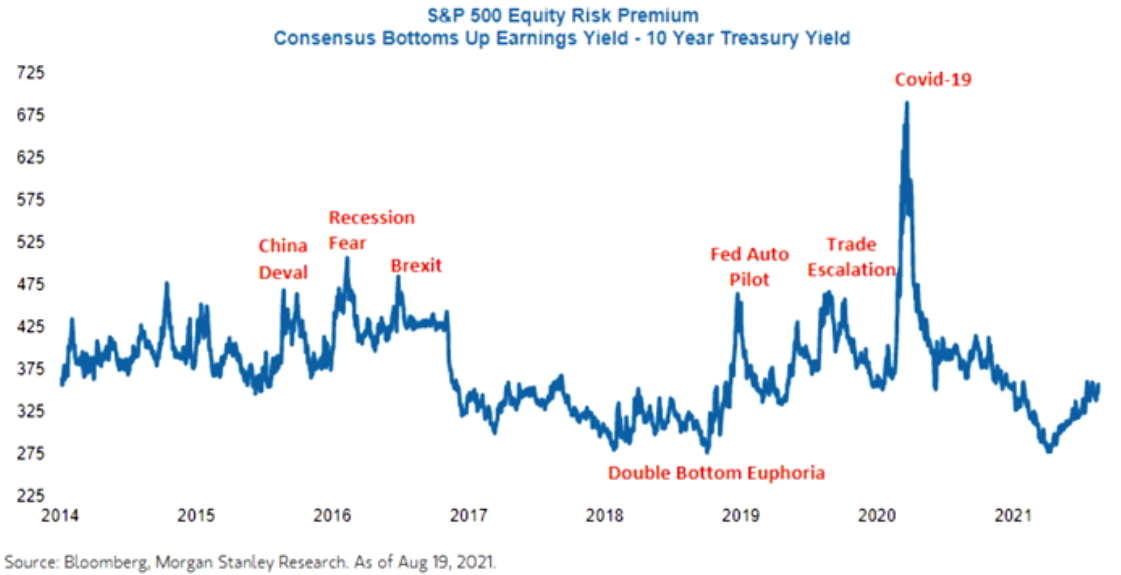
In addition, the S&P 500’s equity risk premium has also risen of extremely depressed levels (see the right side of the chart below). And with price multiples already contracting, an earnings malaise could drop the guillotine on the general stock market.
To that point, Bank of America’s global earnings per share (EPS) model signals a major slowdown in the coming months. Moreover, the combination of compressed multiples, higher risk premiums and decelerating earnings growth could create the perfect storm for the S&P 500.
Please see below:
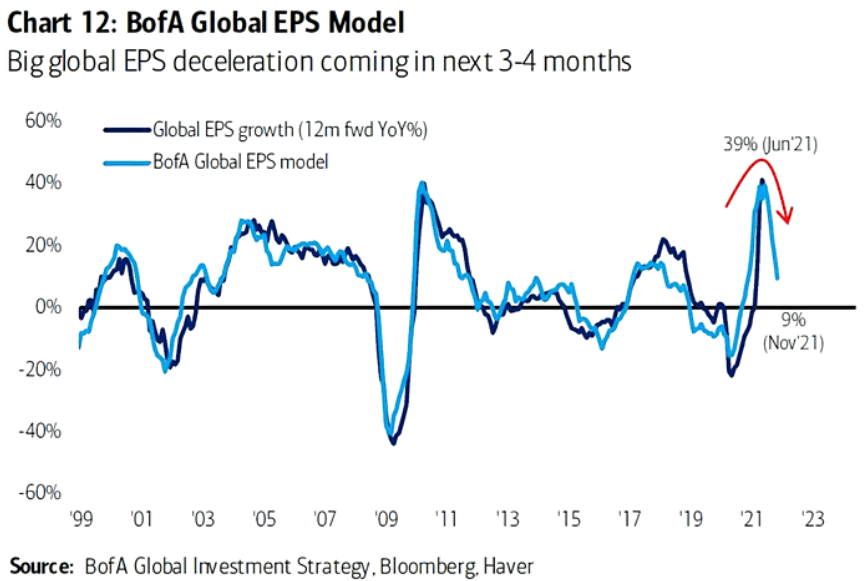
To explain, the dark blue line above tracks the YoY percentage change in analysts’ consensus forward EPS estimates, while the light blue line above tracks the implied YoY percentage change in Bank of America’s global EPS model. If you analyze the right side of the chart, you can see that the light blue line has already moved sharply lower. And with the dark blue line still materially elevated, downward earnings revisions could severely upend investors’ optimism.
And while the wheels are in motion, even the staunchest bulls are demonstrating heightened anxiety. For example, Wharton professor Jeremy Siegel told CNBC on Sep. 2 that a significant correction could be looming.
"Personally, I think the inflation news, not tomorrow's employment report that everyone is looking at... might be more important," he said. "If they blow out the numbers, the Fed is going to have to be more aggressive going forward."
He added:
“[Stocks are] going up the staircase. I don't know when the elevator's going to come. But it looks like a momentum trade, in the sense that it just keeps on going up a little bit every day. No real news to propel it and a lot of momentum players piling on.”
The bottom line? The EUR/USD’s recent rally lacks a fundamental foundation. And with U.S. inflation and realized GDP growth outperforming the Eurozone, the USD Index should recoup those losses over the medium term. Moreover, if the general stock market suffers along the way, the pace of the USD Index’s rise could accelerate rather quickly.
In conclusion, it was the second straight day that gold and the GDXJ ETF (our short position) declined alongside the USD Index. And with dollar weakness often uplifting the PMs, it highlights their fundamental trepidation about the Fed’s taper timeline and the potential for higher U.S. real yields. Moreover, with the S&P 500 materially overbought and September a seasonal source of volatility, the PMs confront several ominous headwinds as we approach the autumn months.
Thank you for reading our free analysis today. Please note that the above is just a small fraction of the full analyses that our subscribers enjoy on a regular basis. They include multiple premium details such as the interim targets for gold and mining stocks that could be reached in the next few weeks. We invite you to subscribe now and read today’s issue right away.
Sincerely,
Przemyslaw Radomski, CFA
Founder, Editor-in-chief -
U.S. Economic Outlook: Gold Failing to Gain Ground
September 2, 2021, 8:39 AMIf the USDX and U.S. Treasury Yields benefit from disappointing payrolls, what will that bode for gold and the rest of the precious metals?
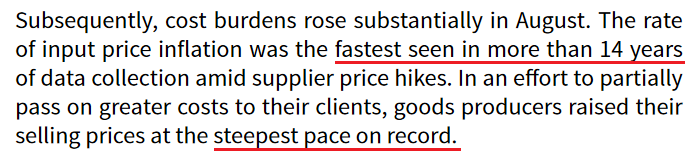
With the Delta variant upending global economic activity, the latest coronavirus strain has grinded the reopening momentum to a halt. And while the lack of “substantial further progress” allows the Fed (and other central banks) to air on the side of caution, the Delta variant has only accelerated the inflationary fervor. Case in point: IHS Markit released its U.S. manufacturing PMI on Sep. 1. And while the headline index declined from 63.4 in July to 61.1 in August, the print was labeled the “softest for four months, but nonetheless among the strongest seen in the over 14-year series history.”
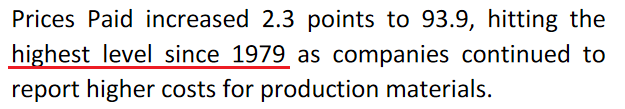
More importantly, though, as “material shortages hampered output growth [and] supplier delivery times increased markedly to one of the greatest extents on record,” pricing pressures hit new all-time highs.
Please see below:
 Source: IHS Markit
Moreover, while the Delta variant has depressed business sentiment, once the health crisis abates, renewed economic momentum should support a higher USD Index and higher U.S. Treasury yields. For context, Siân Jones, Senior Economist at IHS Markit, wrote:
“US goods producers continued to register marked upturns in output and new orders in August, as demand flourished once again. That said, constraints on production due to material shortages exerted further pressure on capacity as backlogs of work rose at a near-record rate.”
And while COVID-19 has made its presence felt, the report concluded with:
“Business confidence regarding the outlook for output over the coming year strengthened in August. Greater optimism was linked to hopes of further growth in client demand.”
Building on that theme, the Institute for Supply Management (ISM) also released its manufacturing PMI on Sep. 1. And here, the headline index increased from 59.5 in July to 59.9 in August. Moreover, “the New Orders Index registered 66.7 percent, increasing 1.8 percentage points from the July reading” and “the Backlog of Orders Index registered 68.2 percent, 3.2 percentage points higher than the July reading.”
Timothy R. Fiore, Chair of the ISM Manufacturing Business Survey Committee, wrote:
"Business Survey Committee panelists reported that their companies and suppliers continue to struggle at unprecedented levels to meet increasing demand. All segments of the manufacturing economy are impacted by record-long raw-materials lead times, continued shortages of critical basic materials, rising commodities prices and difficulties in transporting products. The new surges of COVID-19 are adding to pandemic-related issues — worker absenteeism, short-term shutdowns due to parts shortages, difficulties in filling open positions and overseas supply chain problems — that continue to limit manufacturing-growth potential. However, optimistic panel sentiment remained strong, with eight positive comments for every cautious comment.”
Likewise, while pricing pressures increased in August (though, at a slower pace), the report revealed that “16 of 18 industries reported paying increased prices for raw materials.”
As for the regional surveys, the ISM released its Chicago Business Barometer on Aug. 31. And while the headline index decelerated month-over-month (MoM), “Order Backlogs climbed 11.6 points to 81.6, the highest reading since 1951” and “Supplier Deliveries shot up 6.3 points to a three-month high of 92.8, with one survey respondent reporting the worst delivery times in three years.”
Please see below:
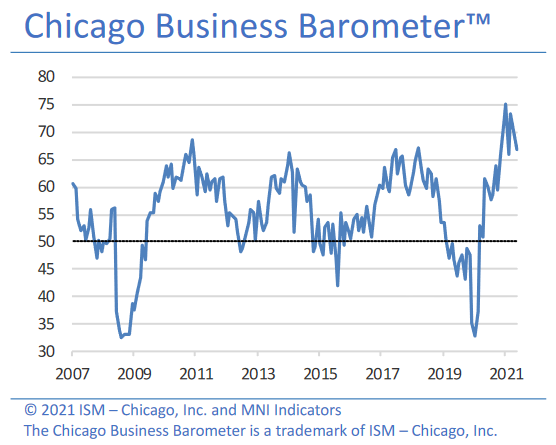
Moreover, with excessive lead times accelerating the pricing pressures, inflation is showing no signs of slowing down:
 Source: ISM Chicago Business Barometer
Also sounding the inflationary alarm, the National Restaurant Association released its State of the Restaurant Industry report on Aug. 31. For context, the mid-year update covers key industry indicators and trends as of June/July through extensive surveys of restaurant operators and consumers.
And while Fed Chairman Jerome Powell said at the Jackson Hole Economic Symposium on Aug. 27 that “we see little evidence of wage increases that might threaten excessive inflation,” the year-over-year (YoY) percentage increase in the Employment Cost Index (ECI) in the second quarter (3.55%) was the highest since 2002. For context, Powell actually cited the Atlanta Fed’s wage tracker and the ECI to support his conclusion.
Please see below:
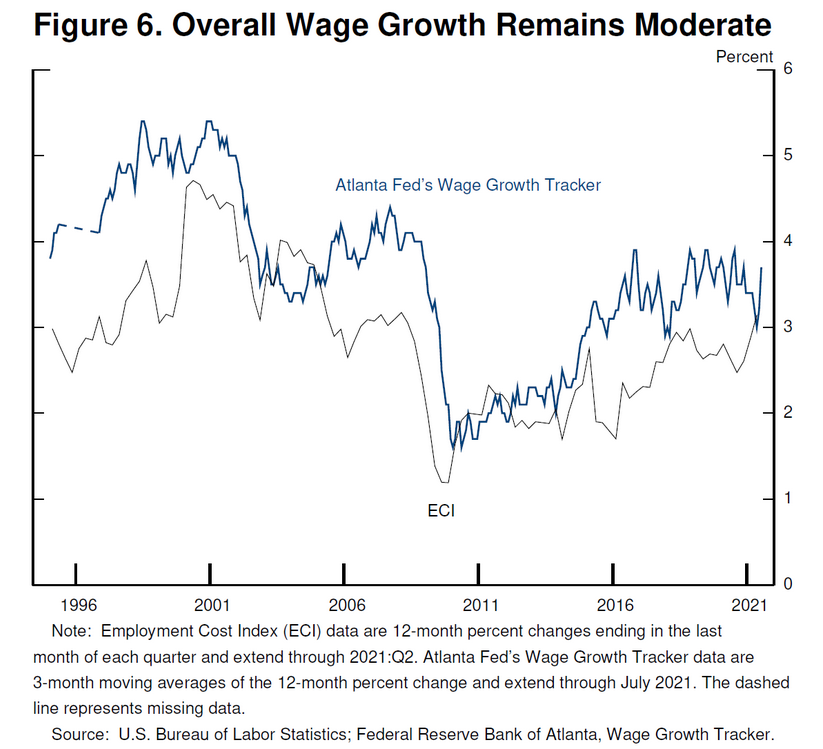
However, more representative of the current climate, average hourly earnings in the leisure & hospitality sector surged by 9.63% YoY on Aug 6. And with the National Restaurant Association revealing that “labor challenges intensified in the first half of the year” and that “75% [of respondents] reported recruiting and retaining employees was the top challenge facing their business,” wage inflation is poised to accelerate. For context, only 8% of respondents cited hiring as their “top challenge” in January but “the June/July number [75%] represents its highest level in nearly 20 years of the Association’s monthly tracking survey.”
Please see below:
What’s more, with economics 101 and the supply/demand curve contradicting Powell’s position, staffing levels at restaurants are more than 8% below their pre-pandemic high of 12.3 million. And with the restaurants & accommodations sector home to more than 1.4 million job openings as of Jun. 30 (BLS data), the figure was more than double the January 2021 reading and was the highest since the data collection began in 2000. Thus, does it seem like wage inflation will moderate anytime soon?
To that point, with input costs accelerating in conjunction with persistent wage inflation, restaurants are paying a hefty price to maintain operations.
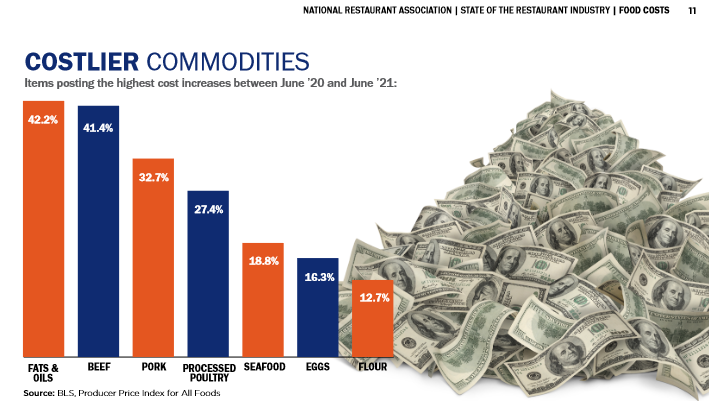
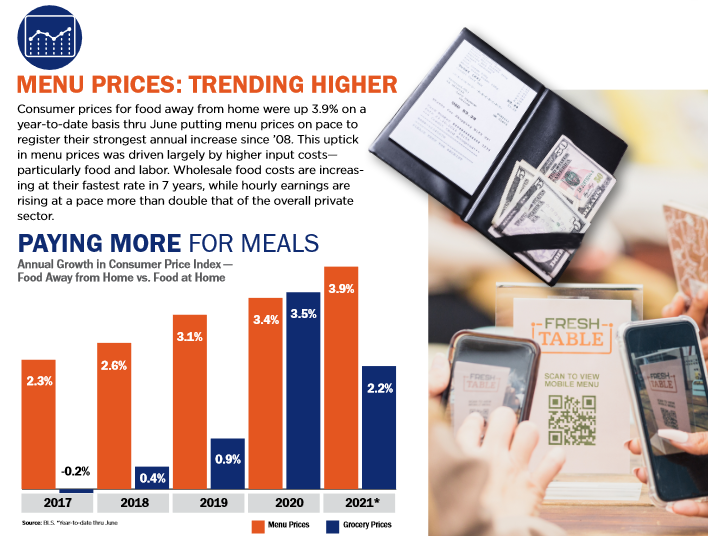
And with the merry-go-round of cost-push inflation performing as expected, higher menu prices (the orange bars below) demonstrate how U.S. restaurants are not sitting idly by and watching their profit margins deteriorate.
Furthermore, while Powell has parroted the “transitory” narrative on numerous occasions, Fed officials’ belief in his wisdom is starting to falter.
Please see below:
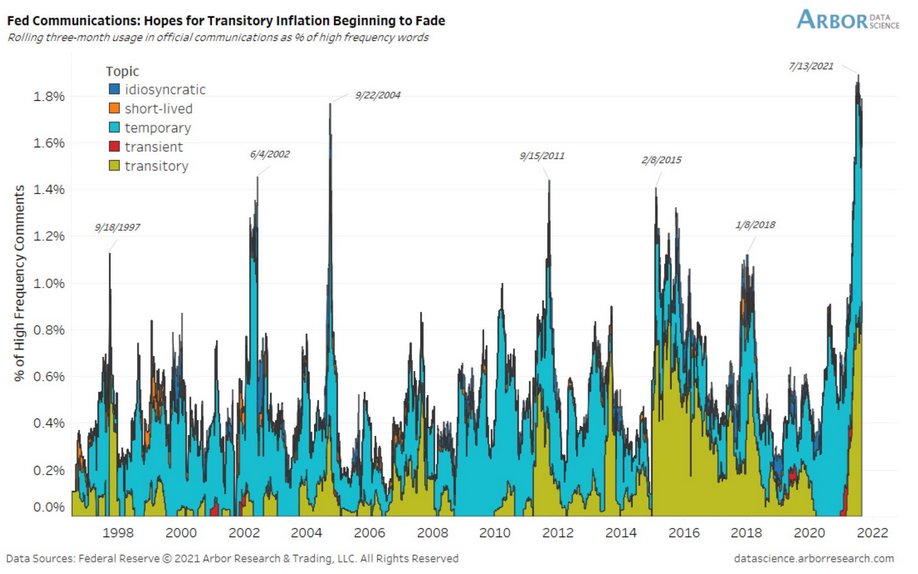
To explain, the color blocks above track Fed officials’ messaging of “transitory” and other words of a similar meaning. If you analyze the right side of the chart (though, it’s hard to make out), you can see that like-minded language peaked on Jul. 13 and has been moving lower ever since.
Similarly, Fed officials’ passive language has also moved sharply lower. And with terms like “patience,” “assessing” and “long way” being used increasingly infrequently, it signals that conflicting opinions and taper anxiety remain ripe within the Fed.
Please see below:
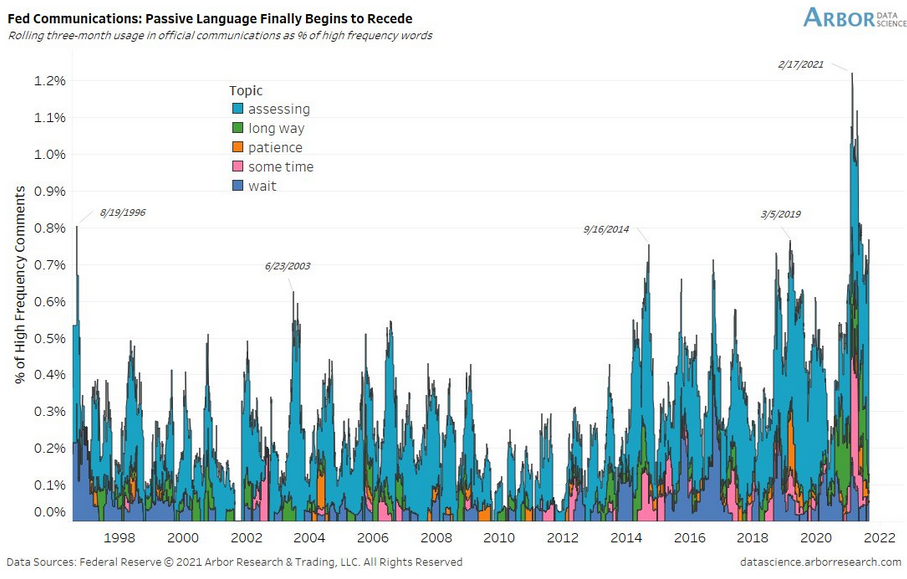
To explain, the color blocks above track Fed officials’ preference for dovish commentary. If you analyze the right side of the chart, you can see that the basket of terms has rolled over and the equilibrium has fallen to the more hawkish side of the coin.
The bottom line…
While the ADP’s private payrolls disappointed on Sep. 1 and U.S. nonfarm payrolls may follow suit on Sep. 3 due to the Delta variant (though, the ADP report and U.S. nonfarm payrolls have little to no correlation), taper momentum is still building. And with the USD Index and U.S. Treasury yields poised to benefit from the eventual announcement, precious metals investors are demonstrating heightened hesitation.
In conclusion, the PMs moved lower on Sep. 1 despite a weaker USD Index and mixed performance from U.S. Treasury yields. And with the latter’s fundamentals only obstructed by the Delta variant, progress on the health front should add to the former’s ills over the medium term. As a result, the seeds have been sown for another sharp decline in precious metals prices and it’s likely only a matter of time before the climax unfolds.
Thank you for reading our free analysis today. Please note that the above is just a small fraction of the full analyses that our subscribers enjoy on a regular basis. They include multiple premium details such as the interim targets for gold and mining stocks that could be reached in the next few weeks. We invite you to subscribe now and read today’s issue right away.
Sincerely,
Przemyslaw Radomski, CFA
Founder, Editor-in-chief -
Cyclical Nature of Labor Day: Let’s Make Some Money On It!
September 1, 2021, 5:28 AMThe U.S. Labor Day is almost there, and thus the time for gold’s rally is running out. Tick-tock, tick-tock… and then the party stops.
Chart analysis is a very interesting activity. You need to keep your mind open, your cognitive and emotional biases at bay, you have to stay humble, as you always have something new to discover, and you might need to change your mind in a flash. Moreover, the indications can arrive from all over the place. You can expect that the key signal will come from this price analysis technique, or that one, or maybe based on the price link between some assets. Or it could even be the case that it will not be the price or volume that will be critical in a given situation… but time.
The cyclical nature of many areas of life is present in the markets, and it is usually the case that the seasonal factors have only a mild effect on the prices and other factors are much more important, as they are specific to a given situation. Sometimes, however, we have a recurring event that’s so precise in its implications and so accurate that its importance could dwarf other techniques.
This could be the case with gold’s post-U.S.-Labor-Day performance.
A poet might say that at that time a golden dolphin jumps joyfully into the air, shining briefly in the evening sun, preparing for a deep and dangerous dive.
A data scientist might say that 10 out of 10 efficiency with regard to short-term implications and 8 out of 10 performance with regard to medium-term implications is something that seems opposite to the efficient market theory, even in its weak form.
And a trader might say “great! let’s make some money on it!”
I’ll let you be the judge as to which approach is best, while I will feature my observations regarding gold’s price performance around the U.S. Labor Day.
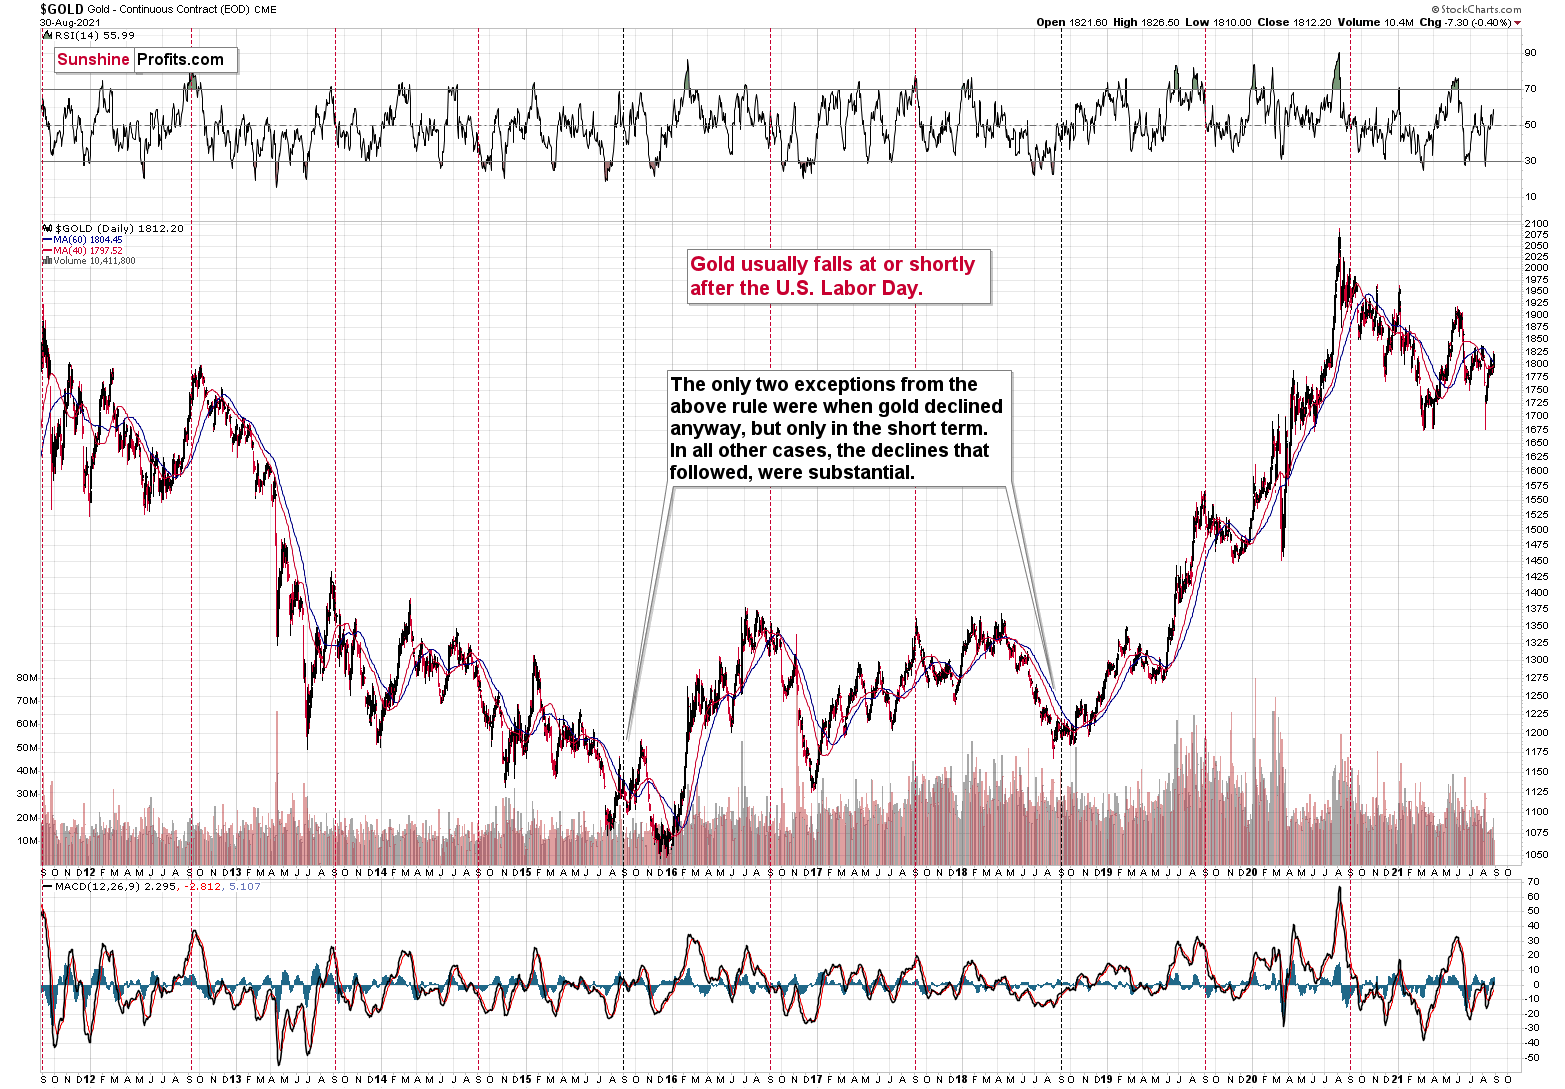
And yes, I did feature this chart yesterday, but I think I haven’t given enough emphasis on how important it is currently.

We’re now less than one week away from the U.S. Labor Day, which is particularly important for the gold price movement.
You see, in the previous 10 years, gold almost always declined profoundly right after the U.S. Labor Day — I marked that on the above chart with red, dashed lines. There were only two cases (in 2015 and in 2018) when gold didn’t slide profoundly after that day, but… it was when gold declined in the short term anyway. There was simply no major downswing later.
In other words, in all 10 out of the previous 10 years, gold moved lower in the short term after the U.S. Labor Day. Of course, it’s debatable what one describes as the short term. In this case, I mean a period between a few days and a few weeks. Then again, if you look at the chart, it’s clear what we can expect. Please have a look at how far gold usually fell (red lines) and how far it fell during the exceptionally bullish years when it declined just in the short run.
This is very important, as it tells us that even if gold doesn’t decline this week, it will be very likely to do so based on this surprisingly accurate cyclicality.
Thank you for reading our free analysis today. Please note that the above is just a small fraction of the full analyses that our subscribers enjoy on a regular basis. They include multiple premium details such as the interim targets for gold and mining stocks that could be reached in the next few weeks. We invite you to subscribe now and read today’s issue right away.
Sincerely,
Przemyslaw Radomski, CFA
Founder, Editor-in-chief -
“Farewell, 2021 Levels…” - Can You Hear GDXJ’s Whispers?
August 31, 2021, 6:26 AMIn yesterday’s analysis, I emphasized that Friday’s event-driven news was… well, exactly that. And nothing more than that. As such, it was unlikely to be a beginning of a new uptrend in the precious metals sector, but rather a daily reaction more or less separate from the current (down)trend.
What happened yesterday (and what’s happening today) is in perfect tune with the above. Let’s start with taking a look at the confirmations that came from the mining stocks.
The Invalidation’s Invalidation
Remember the tiny move back above the neck level of the bearish head and shoulders pattern? Well, it’s been invalidated. Yes, the invalidation was invalidated. While it may sound odd, the really odd thing is that the miners managed to close the previous week above this level. If this move had been true, gold miners would have soared yesterday. Instead, they moved back down, correcting the action that was rather accidental.
And while the senior miners (GDX) invalidated their move higher, the junior miners (GDXJ) are verifying the previous breakdowns in a classic manner.

Namely, after moving below the previous lows, the GDXJ ETF moved back up to them and then declined once again. This is a common thing for an asset to do, and it’s called a breakdown’s verification. A final good-bye kiss to the previous support, which now proved to be resistance.
“Farewell, previous 2021 lows…” – the GDXJ ETF whispered gently, hesitated for no more than a second, and looked downward, excited about the upcoming jump into the unknown. (who said analyses have to be boring?)
In other words, the outlook remains bearish.
The Gold and Dollar Dance
What happened in today’s pre-market trading might make you think that the move higher in the PMs could actually have legs. That’s because the USD Index moved lower.
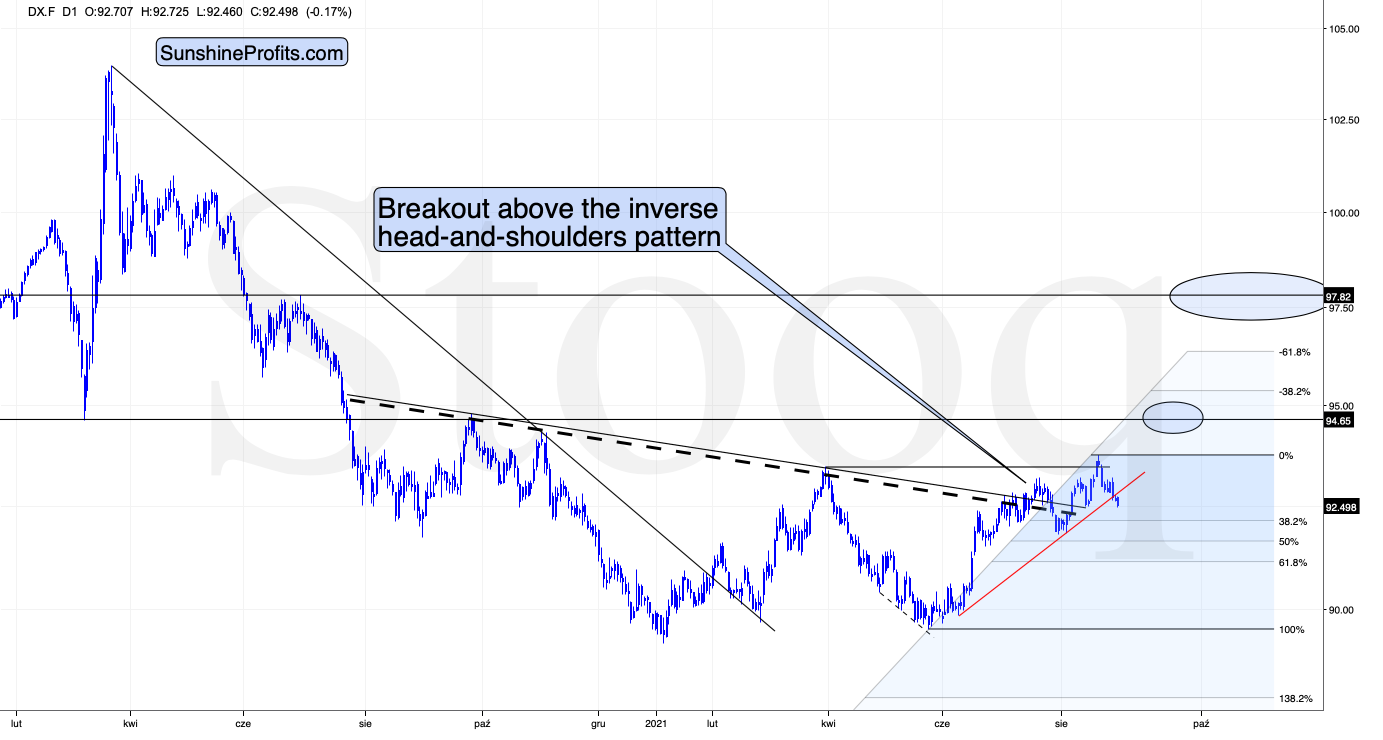
The USDX not only moved lower, but it even managed to break below the rising red support line. But does it change much?
- I previously wrote that the USDX could fall to about 92.5, and it wouldn’t change much.
- The previous short-term lows were touched but not broken.
- The 38.2% Fibonacci retracement level based on the most recent upswing is close but hasn’t been reached yet. This level (based on a smaller rally) stopped the previous decline in the USD Index and triggered a huge slide in gold, silver, and mining stocks.
In other words, it doesn’t change much for the outlook for the USDX, it might simply delay the rally for several days.
And it changes even less for gold.
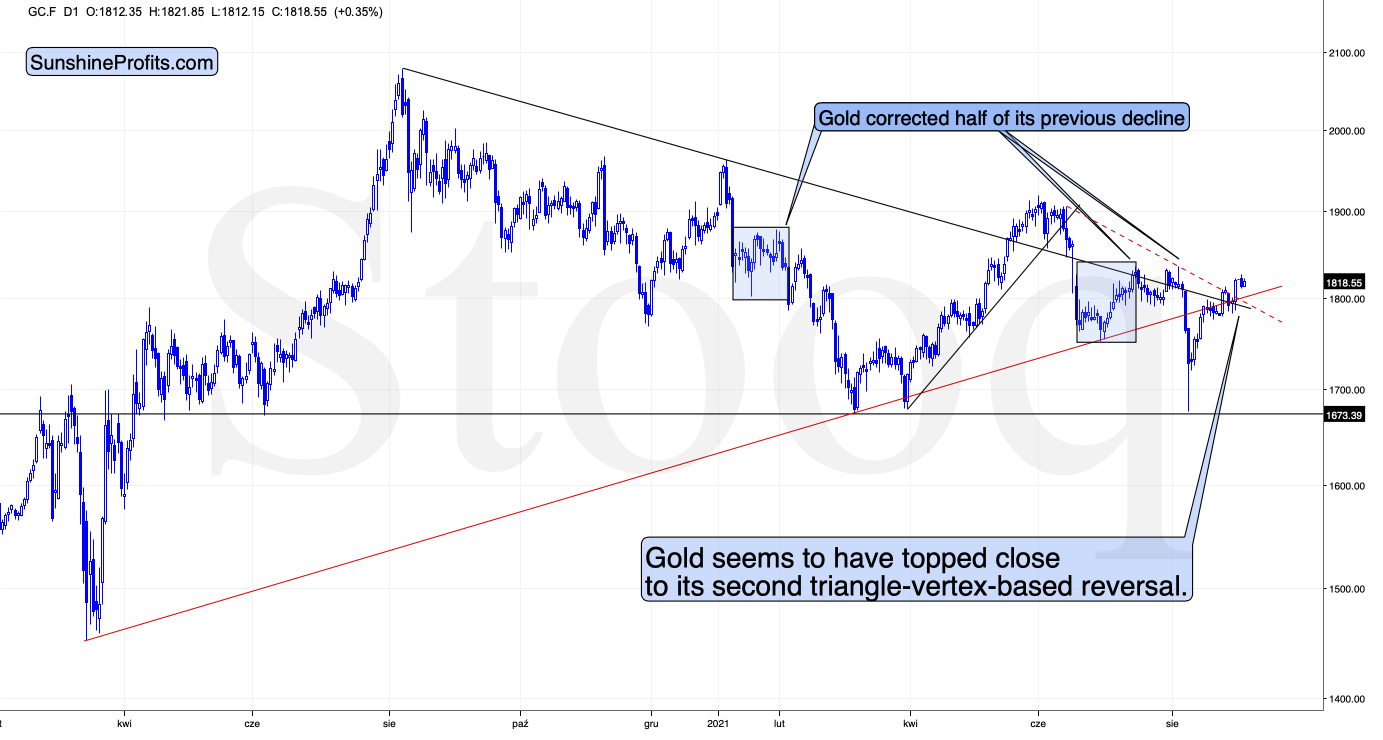
Please note that the yellow metal didn’t move to new highs, even though the USDX moved to new very short-term lows. So, gold is not really willing to react to the USD’s weakness. This means that even if the latter declines a bit, it won’t change much (if anything) for the price of gold.
Gold formed a local top at its previous triangle-vertex-based reversal, and it seems that it also formed a top this week at its current triangle-vertex-based reversal.
U.S. Labor Day Cyclicality
Moreover, please note that we’re just one week away from the U.S. Labor Day, which is much more important for the gold market than it seems at first glance.
In the previous 10 years, gold almost always declined profoundly right after the U.S. Labor Day — I marked that on the above chart with red, dashed lines. There were only two cases (in 2015 and in 2018) when gold didn’t slide profoundly after that day, but… it was when gold was declining in the short term anyway. There was simply no major downswing later.
This is very important, as it tells us that even if gold doesn’t decline for a week from now, it will be very likely to do so based on this surprisingly accurate cyclicality.
All in all, the outlook for the precious metals sector remains very bearish for the following weeks, even though we might need to wait a few extra days for the big declines to follow.
Thank you for reading our free analysis today. Please note that the above is just a small fraction of the full analyses that our subscribers enjoy on a regular basis. They include multiple premium details such as the interim targets for gold and mining stocks that could be reached in the next few weeks.We invite you to subscribe now and read today’s issue right away.
Sincerely,
Przemyslaw Radomski, CFAFounder, Editor-in-chief -
Bittersweet Truth for Gold Stocks: What You Need to Know
August 30, 2021, 8:50 AMWhen the Fed entices grown up kids with sweet words, they hit the candy store and stock up on gold, silver, and stocks. A sugar hangover follows.
Beware of the candyman!
With Fed Chairman Jerome Powell performing his usual dovish dance on Aug. 27, gold, silver, and mining stocks were like kids in a candy store. However, with the short-term sugar highs often leaving investors with nasty stomach aches, the sweet-and-sour nature of the precious metals’ performances may lead to pre-Halloween hangovers.
HUI Index: Harbinger of Things to Come
To explain, while the HUI Index invalidated the breakdown below its previous lows, the bullish reversal may seem quite sanguine. However, an identical development occurred in 2013 right before the index continued its sharp decline. Moreover, I warned previously that the HUI Index could record a corrective upswing of 4% to 8% (that’s what happened after the breakdown in 2013) and that it would not change the medium-term implications. And after the index rallied by more than 6% last week, the bounce is nothing to write home about.
Furthermore, after recording a similar breakdown below the neckline of its bearish H&S pattern in 2000, a short-term corrective upswing followed before the HUI Index resumed its swift decline. As a result, gold, silver, and mining stocks may not behave like Jolly Ranchers for much longer.
Please see below:
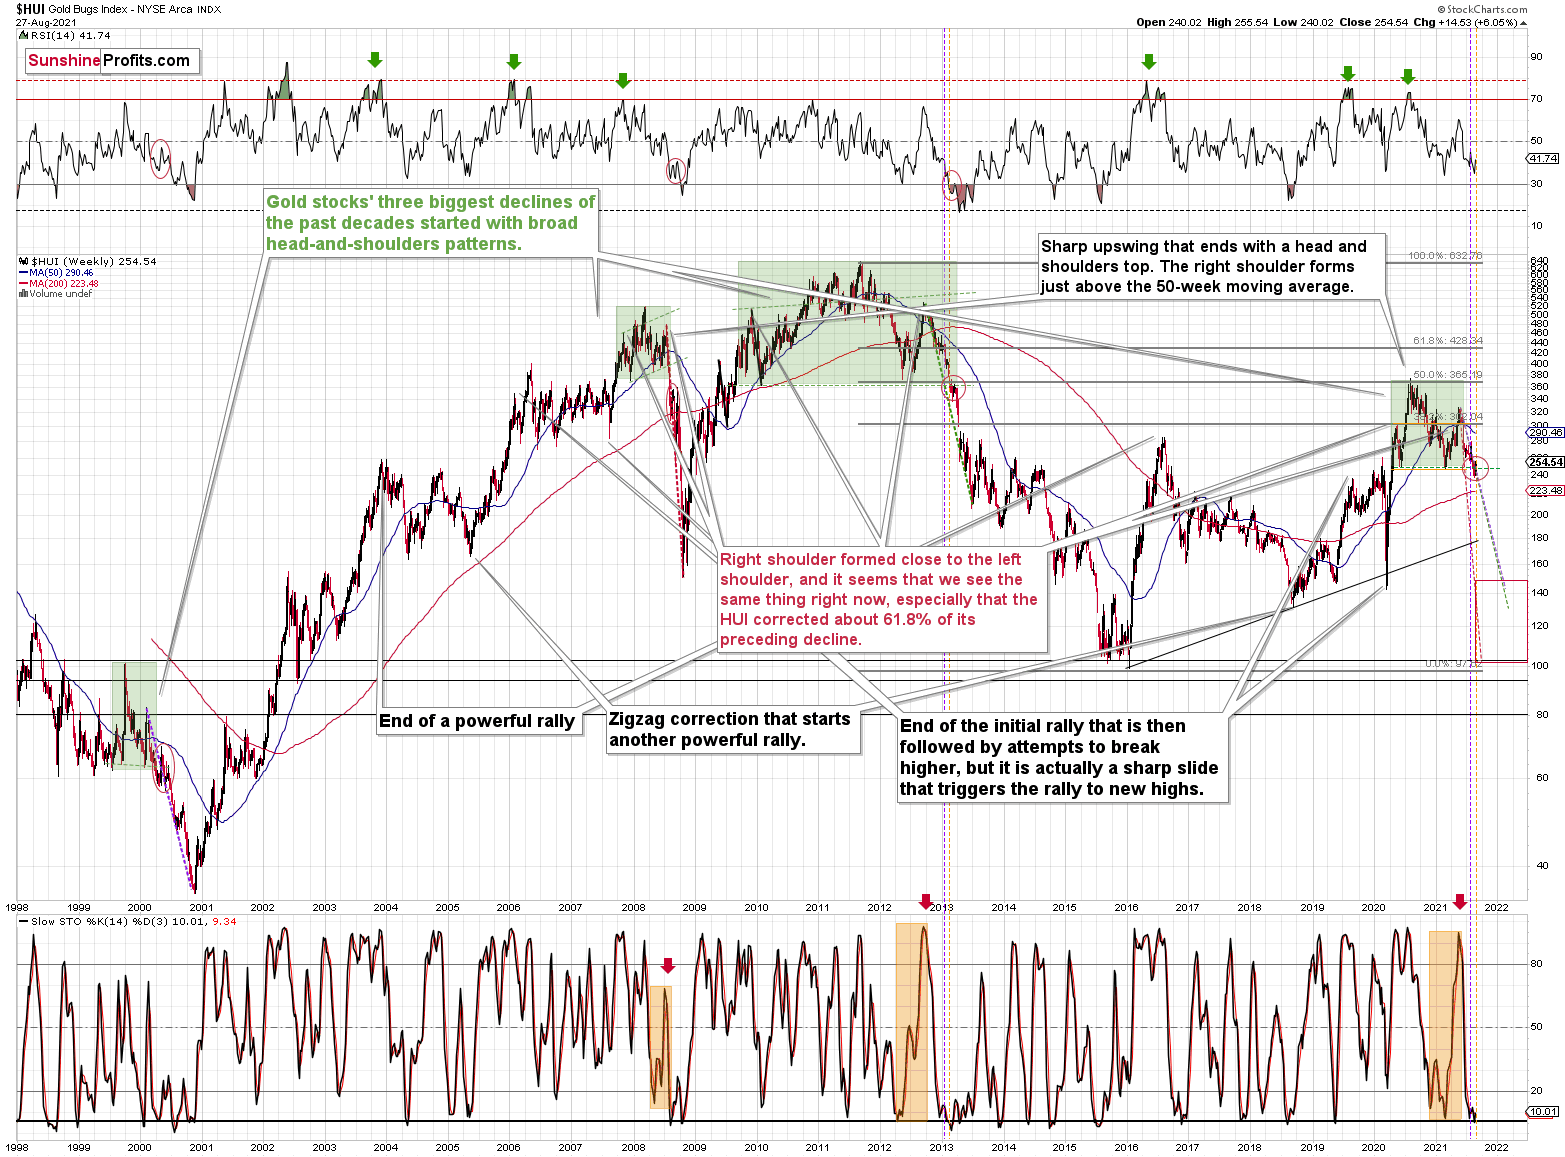
What’s more, the vertical, dashed lines above demonstrate how the HUI Index is mirroring its decline from 2012-2013. After a slight buy signal from the stochastic indicator in 2012, the short-term pause was followed by another sharp drawdown. For context, after the HUI Index recorded a short-term buy signal in late 2012 – when the index’s stochastic indicator was already below the 20 level (around 10) and the index was in the process of forming the right shoulder of a huge, medium-term head-and-shoulders pattern – the index moved slightly higher, consolidated, and then fell off a cliff. Thus, the HUI Index is quite likely to decline to its 200-week moving average (or so) before pausing and recording a corrective upswing. That’s close to the 220 level. Thereafter, the index will likely continue its bearish journey and record a final medium-term low some time in December.
Furthermore, I warned previously that the miners’ drastic underperformance of gold was an extremely bearish sign. There were several weeks when gold rallied visibly and the HUI Index actually declined modestly. Last week, we finally saw gold miners moving back up along with gold. But just like one swallow doesn’t make a summer, this move up doesn’t change the fact, that in general, performance of gold stocks has been truly terrible.
After all, gold stocks are trading close to their previous 2021 lows, while gold is almost right in the middle between its yearly high and its yearly low.
And why is this quote so important? Well, because the bearish implications of gold stocks’ extreme underperformance still remain intact.
Let’s keep in mind that the drastic underperformance of the HUI Index also preceded the bloodbath in 2008 as well as in 2012 and 2013. To explain, right before the huge slide in late September and early October 2008, gold was still moving to new intraday highs; the HUI Index was ignoring that, and then it declined despite gold’s rally. However, it was also the case that the general stock market suffered materially. If stocks didn’t decline so profoundly back then, gold stocks’ underperformance relative to gold would have likely been present but more moderate.
Nonetheless, broad head & shoulders patterns have often been precursors to monumental collapses. For example, when the HUI Index retraced a bit more than 61.8% of its downswing in 2008 and in between 50% and 61.8% of its downswing in 2012 before eventually rolling over, in both (2008 and 2012) cases, the final top – the right shoulder – formed close to the price where the left shoulder topped. And in early 2020, the left shoulder topped at 303.02. Thus, three of the biggest declines in the gold mining stocks (I’m using the HUI Index as a proxy here) all started with broad, multi-month head-and-shoulders patterns. And in all three cases, the size of the declines exceeded the size of the head of the pattern. As a reminder, the HUI Index recently completed the same formation.
Yes, the HUI Index moved back below the previous lows and the neck level of the formation, which – at face value – means that the formation was invalidated, but we saw a similar “invalidation” in 2000 and in 2013. And then, the decline followed anyway. Consequently, I don’t think that taking the recent move higher at its face value is appropriate. It seems to me that the analogies to the very similar situation from the past are more important.
As a result, we’re confronted with two bearish scenarios:
- If things develop as they did in 2000 and 2012-2013, gold stocks are likely to bottom close to their early-2020 low.
- If things develop like in 2008 (which might be the case, given the extremely high participation of the investment public in the stock market and other markets), gold stocks could re-test (or break slightly below) their 2016 low.
In both cases, the forecast for silver, gold, and mining stocks is extremely bearish for the next several months.
GDX and GDXJ Comparison
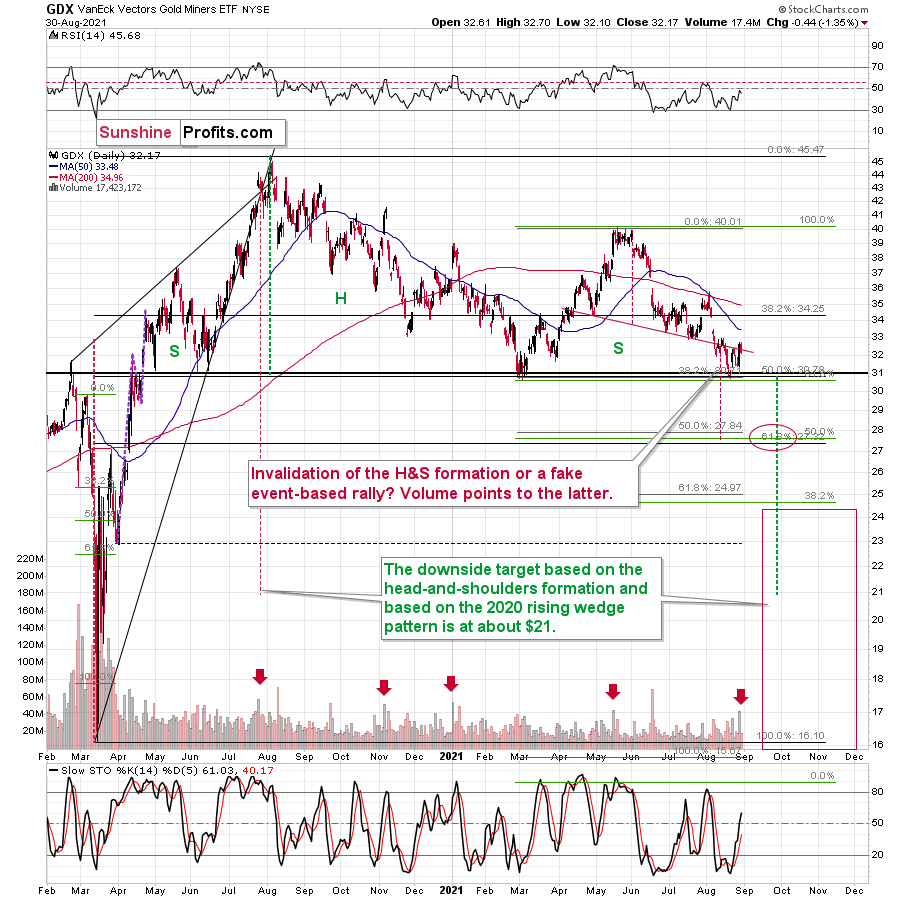
For even more confirmation, let’s compare the behavior of the GDX ETF and the GDXJ ETF. Regarding the former, the senior miners (GDX) also rallied above the neckline of their bearish H&S pattern. And while Friday’s (Aug. 27) euphoria occurred on high volume, prior volume spikes in buying sentiment actually marked four peaks (or close to) within the last 12 months. Thus, while the bullish bids may push the GDX ETF slightly higher in the near term, history implies that investors’ excitement often does more harm than good.
Please see below:
In all 4 out of previous 4 cases, the spike-high volume during GDX’s upswing meant a great shorting opportunity.
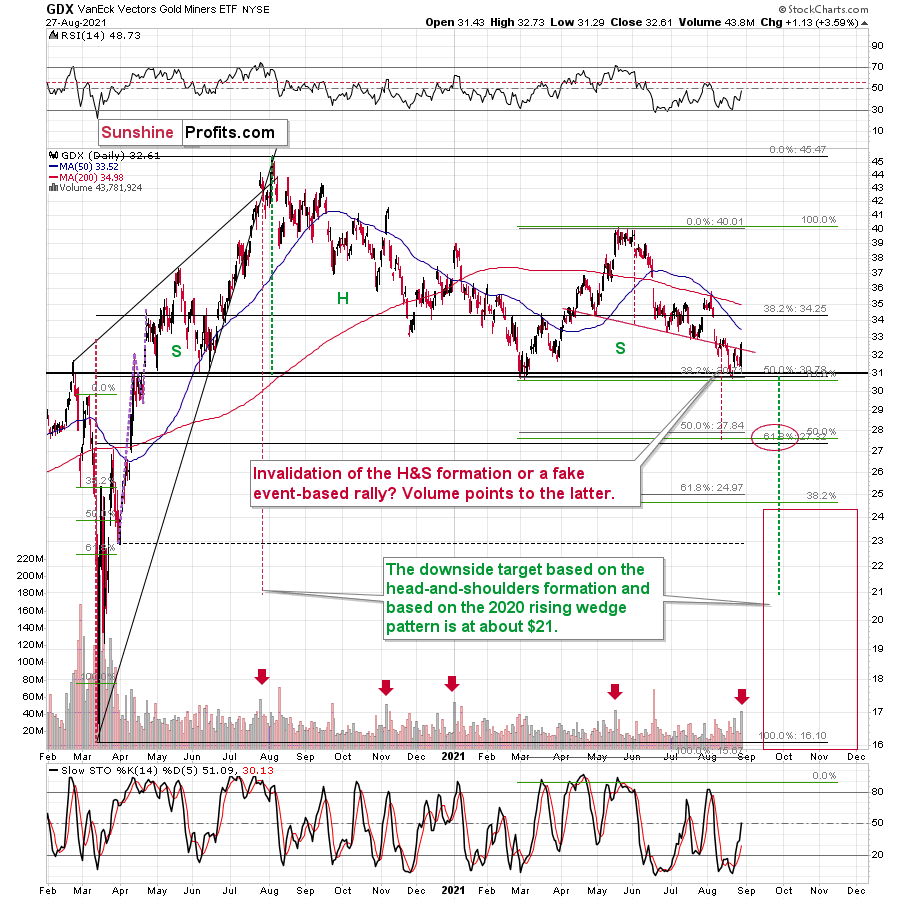
Meanwhile, the junior miners (GDXJ) didn’t invalidate the breakdown below the neckline of their bearish H&S pattern; and Friday’s close still left the GDXJ ETF below its previous lows. Moreover, while the juniors’ future direction following volume spikes isn’t quite as clear as it is with the GDX ETF, more often than not, euphoric spikes are followed by medium-term declines.
Please see below:
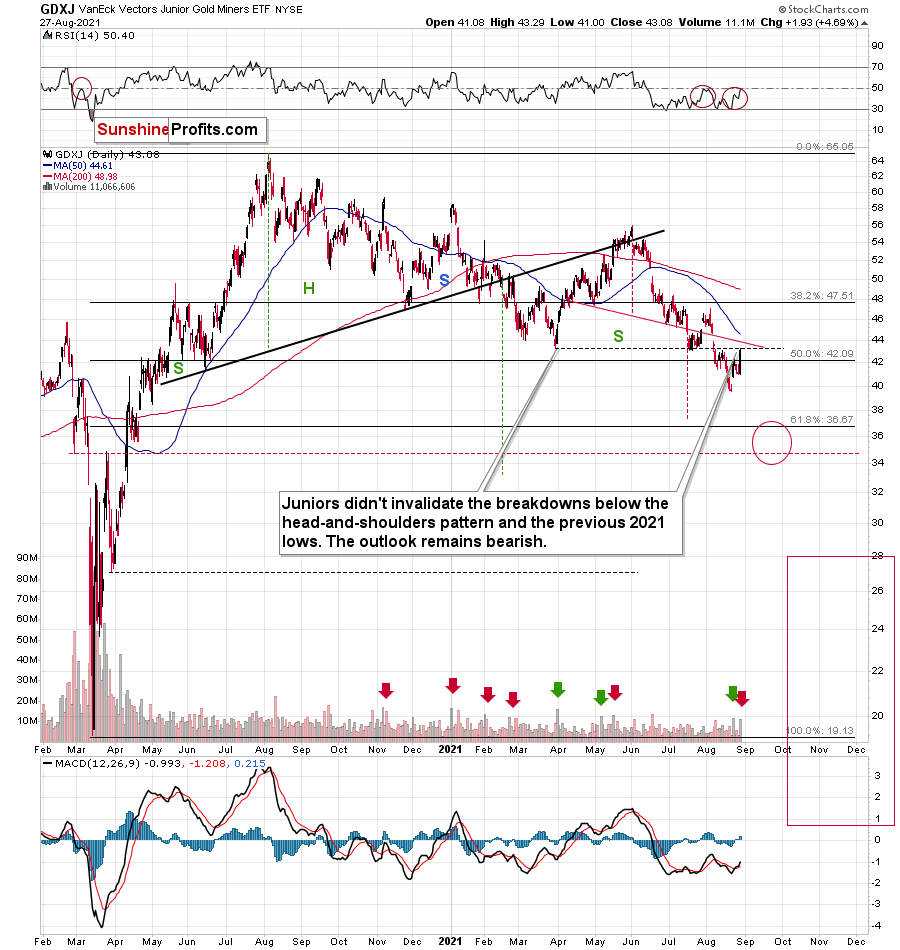
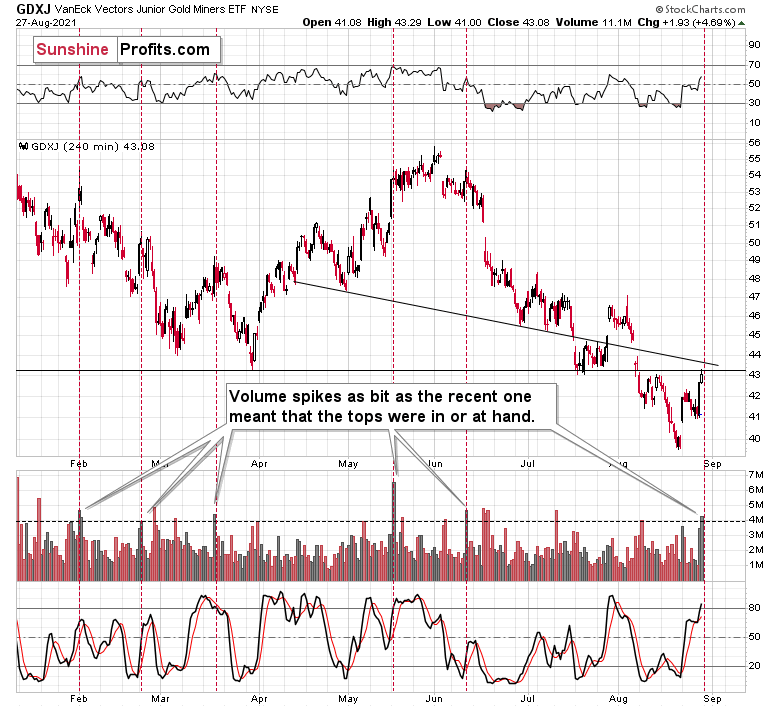
As further evidence, if you analyze the GDXJ ETF’s four-hour chart below, you can see that historical volume spikes (marked by the red vertical dashed lines) nearly always coincide with short-term peaks. As a result, Friday’s rally was more of an event driven surge – courtesy of Powell – and it’s unlikely to disrupt the GDXJ ETF’s medium-term downtrend.
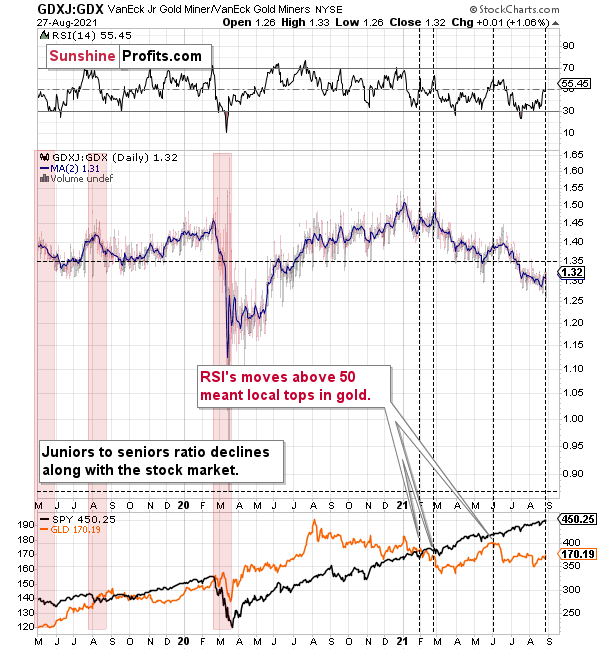
Finally, while the GDXJ/GDX ratio moved slightly higher last week, its downtrend also remains intact. For one, when the ratio’s RSI jumped above 50 three times in 2021, it coincided with short-term peaks in gold. Second, the trend in the ratio this year has been clearly down, and there’s no sign of a reversal, especially when you consider that the ratio broke below its 2019 support (which served as resistance in mid-2020). When the same thing happened in 2020, the ratio then spiked even below 1.
Please see below:
The Bottom Line?
If the ratio is likely to continue its decline, then on a short-term basis we can expect it to decline to 1.27 or so. If the general stock market plunges, the ratio could move even lower, but let’s assume that stocks decline moderately (just as they did in the last couple of days) or that they do nothing or rally slightly. They’ve done all the above recently, so it’s natural to expect that this will be the case. Consequently, the trend in the GDXJ to GDX ratio would also be likely to continue, and thus expecting a move to about 1.26 - 1.27 seems rational.
If the GDX is about to decline to approximately $28 before correcting, then we might expect the GDXJ to decline to about $28 x 1.27 = $35.56 or $28 x 1.26 = $35.28. In other words, $28 in the GDX is likely to correspond to about $35 in the GDXJ.
Is there any technical support around $35 that would be likely to stop the decline? Yes. It’s provided by the late-Feb. 2020 low ($34.70) and the late-March high ($34.84). There’s also the late-April low at $35.63. Conservatively, I’m going to place the profit-take level just above the latter.
Consequently, it seems that expecting the GDXJ to decline to about $35 is justified from the technical point of view as well.
In conclusion, investors showcased their sweet tooth for gold, silver, and mining stocks on Aug. 27. However, with the USD Index hovering near two key support levels and the yellow metal confronting its second triangle-vertex-based reversal point, the taste may turn bitter over the medium term. Moreover, with prior upswings underwritten by the Fed resulting in lower lows soon after, the precious metals’ bullish behavior is nothing new. As a result, their prior weakness will likely persist before reliable bottoms emerge later this year.
Thank you for reading our free analysis today. Please note that the above is just a small fraction of the full analyses that our subscribers enjoy on a regular basis. They include multiple premium details such as the interim targets for gold and mining stocks that could be reached in the next few weeks. We invite you to subscribe now and read today’s issue right away.
Sincerely,
Przemyslaw Radomski, CFA
Founder, Editor-in-chief


Gold Investment News
Delivered To Your Inbox
Free Of Charge
Bonus: A week of free access to Gold & Silver StockPickers.
Gold Alerts
More-
Status
New 2024 Lows in Miners, New Highs in The USD Index
January 17, 2024, 12:19 PM -
Status
Soaring USD is SO Unsurprising – And SO Full of Implications
January 16, 2024, 8:40 AM -
Status
Rare Opportunity in Rare Earth Minerals?
January 15, 2024, 2:06 PM

