
tools spotlight

-
Nobody Likes It, but Inflation Is Taking Off
October 28, 2021, 7:47 AMWith the S&P 500 closing at the lows on Oct. 27 and mining stocks following suit, surging inflation is starting to rattle the financial markets. For example, the Bank of Canada (BoC) announced on Oct. 27 that it “is ending quantitative easing (QE) and moving into the reinvestment phase, during which it will purchase Government of Canada bonds solely to replace maturing bonds.”
And while the hawkish revelation is bullish for the CAD and bearish for the USD/CAD, the latter recovered roughly half of its intraday losses on Oct. 27. Moreover, while the USD/CAD accounts for 9.1% of the USD Index’s movement, the EUR/USD (57.6% of the USD Index’s movement) is the most important currency pair.
To that point, with the European Central Bank (ECB) poised to reiterate its dovish stance today and the Fed already pre-announcing its taper plans, U.S.-Eurozone inflation differentials should accelerate the Fed’s hawkish outperformance over the next several months.
To explain, the Dallas Fed released its Texas Service Sector Outlook Survey on Oct. 26. And while the headline index increased from 14.5 in September to 19.6 in October, the report revealed:
“Wage and price pressures rose in October to extremely high levels. The wages and benefits index increased to 34.7, a record high in the survey’s 14-year history. The selling prices index rose to 22.7, while the input prices index climbed to 47.0 – its highest reading since 2008.”
Likewise, the Dallas Fed’s Texas Retail Outlook Survey (also released on Oct. 26) sang a similar tune:
“Retail price pressures remained highly elevated in October, while wage pressures accelerated. The selling prices index slipped five points to 45.5 – still near a record-high level – while the input prices index rose from 50.1 to 56.3. The wages and benefits index spiked nearly 14 points to 38.3, near the survey’s record high.”
Moreover, the Richmond Fed also released its Fifth District Survey of Manufacturing Activity on Oct. 26. The headline index increased from -3 in September to 12 in October, and the prices received index hit a new all-time high.
Please see below:
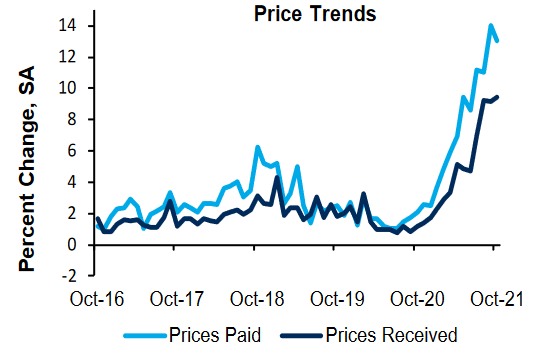 Source: Richmond Fed
On top of that, the largest U.S. corporations continue to sound the inflationary alarm. For example, United Parcel Service (UPS) – a Fortune 500 company and one of the world's largest shipping couriers – released its third-quarter earnings on Oct. 26.
Prior to the print, UPS announced on Oct. 8 that it’s increasing its surcharges on U.S. “shipments originating from China Mainland and Hong Kong SAR” anywhere from 23% to 46% “until further notice.” For context, China accounts for 17.2% of YTD U.S. imports and ranks first among countries where the U.S. imports goods (Mexico is second at 13.8%).
Please see below:
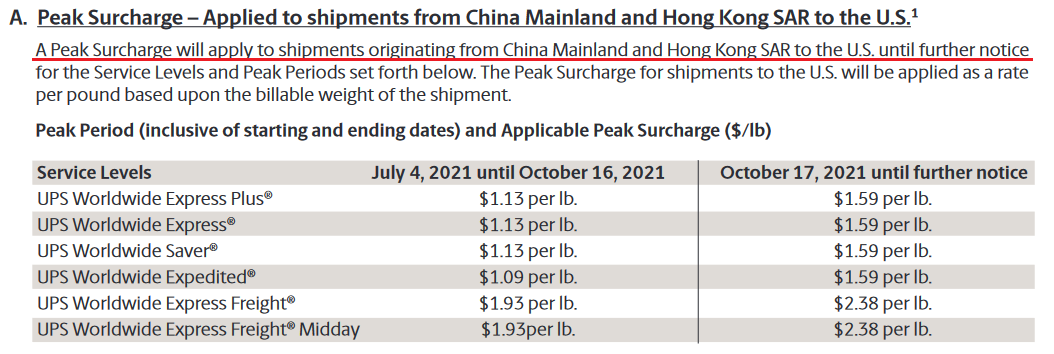 Source: UPS
And while UPS also increased its surcharges for several other types of foreign shipments to the U.S., the company announced on Oct. 26 that its domestic rate increases would hit the wire in the coming days:
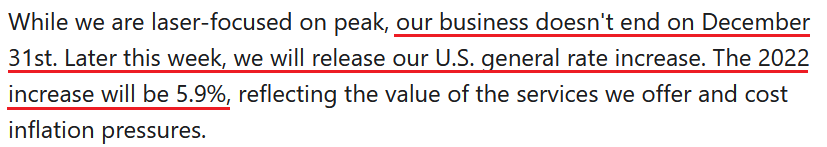 Source: UPS/The Motley Fool
A Sign of Things to Come
Also sounding the inflationary alarm, Kimberly-Clark – the maker of Cottonelle, Huggies and Kleenex that has 46,000 employees worldwide – released its third-quarter earnings on Oct. 25. CEO Michael D. Hsu said that “higher inflation and supply chain disruptions increased our costs well beyond the expectation we established just last quarter.”
Moreover, he added that “we had expected commodity prices to ease in the second half of 2021; instead, prices for resin and pulp increased further in the third quarter and are now expected to stabilize at a meaningfully higher level than our prior estimate.”
In addition, while Hsu was light on the specifics, he said that “further pricing actions” are already in the works and CFO Maria Henry said that she expects the cost-push inflationary spiral to continue for the foreseeable future.
Please see below:
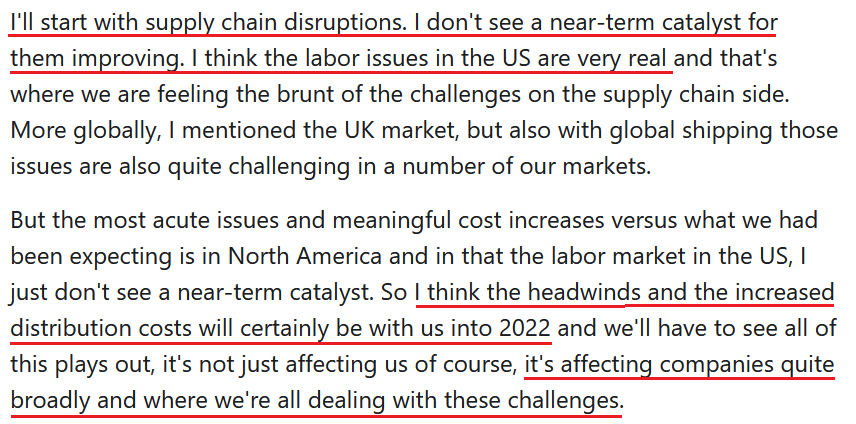 Source: Kimberly-Clark/The Motley Fool
Making three of a kind, 3M – which has a market cap of more than $100 billion – released its third-quarter earnings on Oct. 26. CFO Monish Patolawala said that we’re “facing a lot of inflation…. I think the big issue that we have seen as inflation is coming faster than anybody thought…. I would say we don't see the raw material or the inflation environment slowing down in any way. I think you're going to see that volatility.”
As for wage inflation:
“It's a global item, but it's more pronounced right now for us in the U.S. So we are seeing higher cost, whether it is cost driven by some of the items Mike mentioned as well as with the demand that we have, we are spending more money on overtime. And also we are seeing cost of inflation, which is labor cost that comes through us, through outsource manufacturing hard goods that we buy, we're also seeing inflation on that.”
As a result:
 Source: 3M/Seeking Alpha
For context, I warned on Mar. 30 that companies wouldn’t sit idly by and watch their profit margins erode.
I wrote:
Didn’t Powell insist that near-term inflation was only “one-time” and “transient?” Well, despite government-issued CPI data failing to capture the effect of the Fed’s liquidity circus, pricing pressures are popping up everywhere. Think about it: with corporations’ decision tree left to raising prices or accepting lower margins, which one do you think they’re likely to choose?
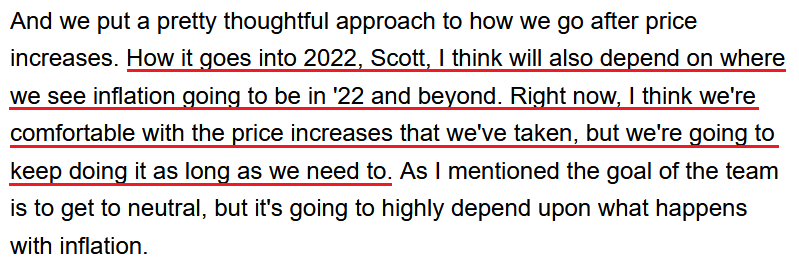
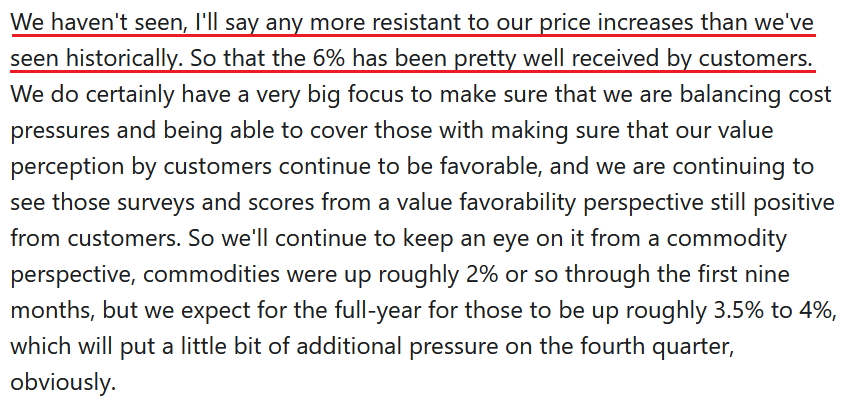
Finally, McDonald’s – the world's largest fast-food restaurant chain – released its third-quarter earnings on Oct. 27. CEO Chris Kempczinski said the following about wage inflation:
“It's a very challenging staffing environment in the US, a little bit less so in Europe, but still challenging in Europe. In the U.S. for us, we are seeing, as I've mentioned a few calls ago that there is wage inflation. Our franchisees are increasing wages over 10% year-to-date [and] our McOpCo restaurants were up over 15% on wages.”
On top of that:
“Pricing and cost pressures are a bigger focus over the last few quarters than they had been previously. Last quarter, I think I talked about how we were seeing roughly a 6% increase year-over-year in the U.S. We are still seeing that and that's pretty much the level we expect for the full-year 2021 over 2020 right around that 6. And that's really to cover both labor cost pressures and commodity cost pressures that we're seeing.”
More importantly, though:
 Source: McDonald’s/The Motley Fool
The bottom line? With inflation surging and the figures coming out of corporate earnings calls nowhere near the Fed’s 2% annual target, the Nov. 2/3 taper announcement will likely be a hawkish appetizer. Right now, investors expect the Fed to hold off on interest rate hikes until well into 2022. Moreover, Fed Chairman Jerome Powell said on Oct. 22 that “I don’t think it is time to raise rates.”
Despite that, though, the Fed remains materially behind the inflation curve. And with commodity inflation, wage inflation and rent inflation creating the perfect storm, the Fed will likely have to accelerate its tightening cycle to calm the pricing pressures. Moreover, with the PMs suffering mightily when the Fed turns hawkish, they’re unlikely to celebrate the inflationary anxiety that should grip the Fed over the next few months.
In conclusion, the PMs were mixed on Oct. 27 and mining stocks continued their underperformance. And after the USD Index shrugged off the intraday volatility, the dollar basket continues to showcase strength when faced with adversity. Moreover, with a taper announcement only cementing the greenback’s fundamental foundation and more hawkish rhetoric from the Fed poised to enhance the U.S. dollar’s uptrend over the medium term, the 2021 theme of ‘USD Index up, PMs down’ should remain alive and well over the next few months.
Thank you for reading our free analysis today. Please note that the above is just a small fraction of the full analyses that our subscribers enjoy on a regular basis. They include multiple premium details such as the interim targets for gold and mining stocks that could be reached in the next few weeks. We invite you to subscribe now and read today’s issue right away.
Sincerely,
Przemyslaw Radomski, CFA
Founder, Editor-in-chief -
Gold Bearish Outlook: Everything Goes According to Plan
October 27, 2021, 5:42 AMWe might see a plunge in gold prices quite soon. History repeats itself to a huge degree at the moment – let’s see what it has to offer.
Today’s technical analysis will be very similar to what I provided to you yesterday because the markets pretty much moved exactly as I had expected. As you may recall, I wrote about the analogy between now and early August in the following way (I’m putting the key part in bold):
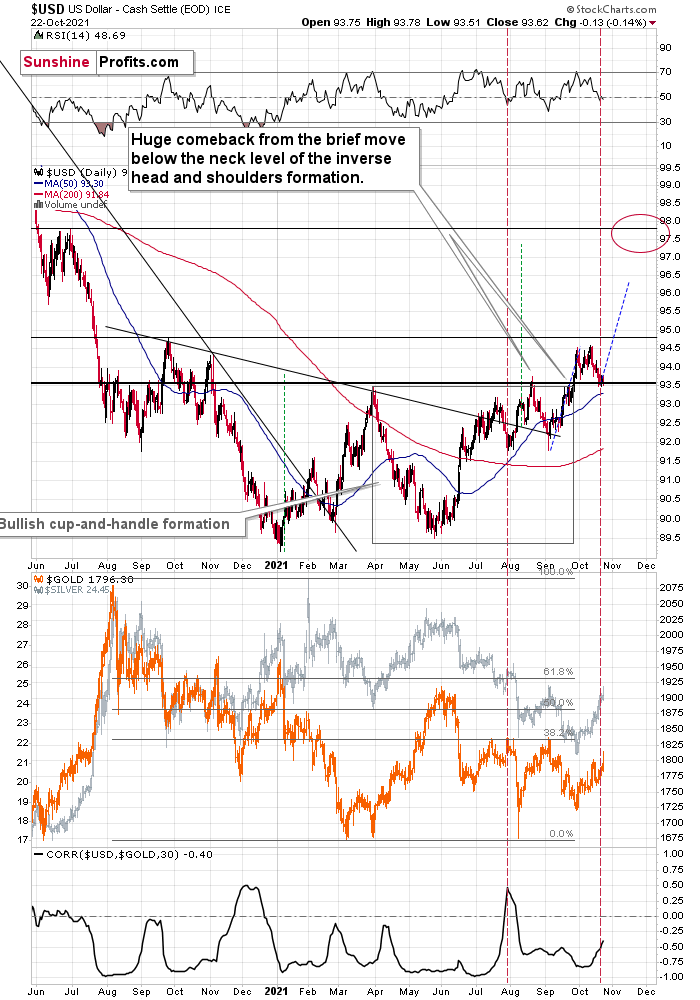
The situation now appears to be the same as it was at the beginning of August, where the bottom also took several days to form, but when the USD Index finally moved higher once again, gold plunged. To be precise, back then, the bottom formed over 5 trading days, and yesterday was the fifth trading day of the current bottom. On the sixth day – back then – the USDX did very little and gold declined modestly, and it was the seventh day when the action really started. And… the short-term decline was over on the very next day. It was not easy to catch this decline if one wanted to wait for a big confirmation that it was indeed taking place. It seems that the same – patient – approach is justified in the current situation.
The RSI indicator (upper part of the chart) continues to confirm this similarity.
Yesterday, the USD Index ended the session 0.13 higher, so – just as in early August – it moved very little. Gold declined modestly back then, and, well, it moved lower by $13.40 yesterday, so it seems that it fits well. Gold is down by $6 in today’s pre-market trading (at the moment of writing these words), so it seems that history might repeat itself to a very big degree.
If it repeated itself to the letter, we would have a $100+ decline in gold this week. But since history rhymes more than it repeats, I think it’s more realistic to simply expect gold to fall substantially soon, without giving the decline just 2 days to materialize.
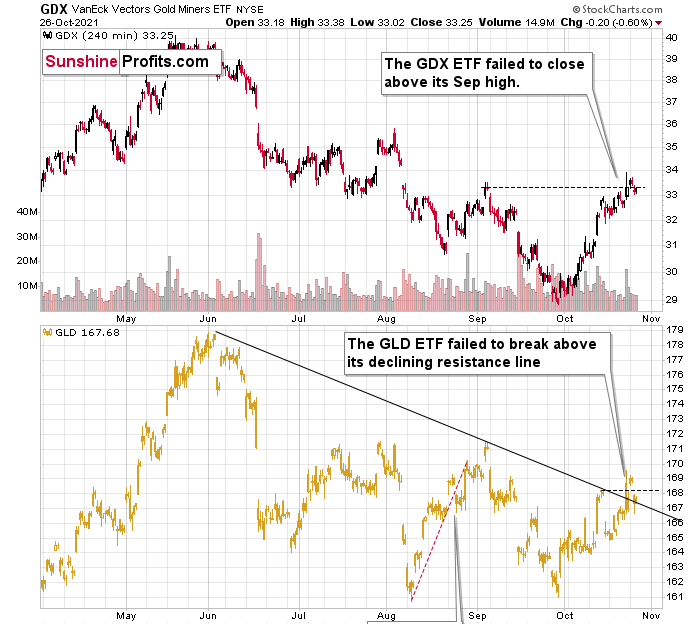
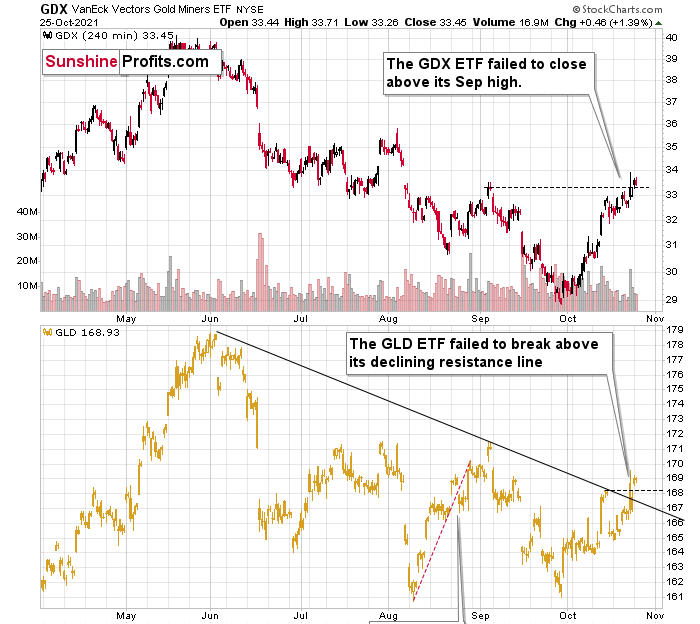
Yesterday, I described the above chart as “another attempt”. Mining stocks (GDX ETF) once again failed to hold the move above their September highs, which is – of course – bearish. GLD failed to hold above its previous October highs as well. It did manage to close above the declining resistance line based on the previous highs, but given today’s pre-market rally, it’s doubtful if GLD will be able to hold this level for long.
There are different rules for confirming a breakout or breakdown, but in the precious metals sector, based on almost two decades of experience in it, I prefer to see three closes above or below a certain level to view the breakout or breakdown as confirmed. Gold / GLD hasn’t confirmed its breakout just yet, and it seems to me that it won’t confirm it soon. Instead, another – big – downswing seems to be just around the corner.
Also, let’s keep in mind how mining stocks (seniors and juniors) reacted to the previous tapering announcement. They moved higher only very initially, but then fell substantially.
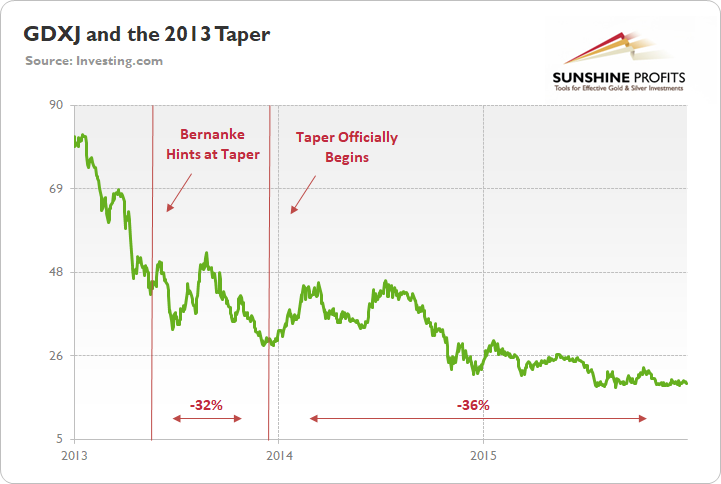
To explain, the green line above tracks the GDXJ ETF from the beginning of 2013 to the end of 2015. If you analyze the left side of the chart, you can see that when Fed Chairman Ben Bernanke hinted at tapering on May 22, 2013, the GDXJ ETF declined by 32% from May 22 until the taper began on Dec. 18.
Moreover, the onslaught didn’t end there. Once the taper officially began, the GDXJ ETF enjoyed a relief rally (similar to what we’re witnessing now) as long-term interest rates declined, and the PMs assumed that the worst was in the rearview.
All in all, the technical picture for the precious metals sector looks bearish, even though the recent short-term corrective upswing might make one think otherwise.
Thank you for reading our free analysis today. Please note that the above is just a small fraction of the full analyses that our subscribers enjoy on a regular basis. They include multiple premium details such as the interim targets for gold and mining stocks that could be reached in the next few weeks. We invite you to subscribe now and read today’s issue right away.
Sincerely,
Przemyslaw Radomski, CFA
Founder, Editor-in-chief -
Another Day, Another Win For the Dollar
October 26, 2021, 9:14 AMAt the moment of writing these words, gold continues to move around the $1,800 level, so nothing really changed in the last several hours. Not much changed during yesterday’s session either. While gold, silver, and mining stocks made new highs in terms of the closing prices, they didn’t move to new intraday highs, and today’s small intraday upswing also ended at lower highs. This divergence suggests that something could be about to change.
Let’s check what happened in the key markets yesterday.
Yesterday’s session can be summarized in two words: “another attempt”. Friday’s intraday rally was invalidated before the closing bell, and this week bulls made another attempt to take the previous highs. Both: GDX and GLD closed above their previous highs, and the GLD even closed above its declining resistance line. In other words, we saw a breakout.
The key thing about this breakout, however, is that it’s not confirmed, and it seems that it won’t be confirmed. And that’s not just because of lower intraday lows; that’s not “just” because of the epic analogy between now and 2013 (and 2008) either. It’s the case because of what’s happening in the USD Index and of how the markets are likely to perform in the period between the tapering announcement and when it actually starts.
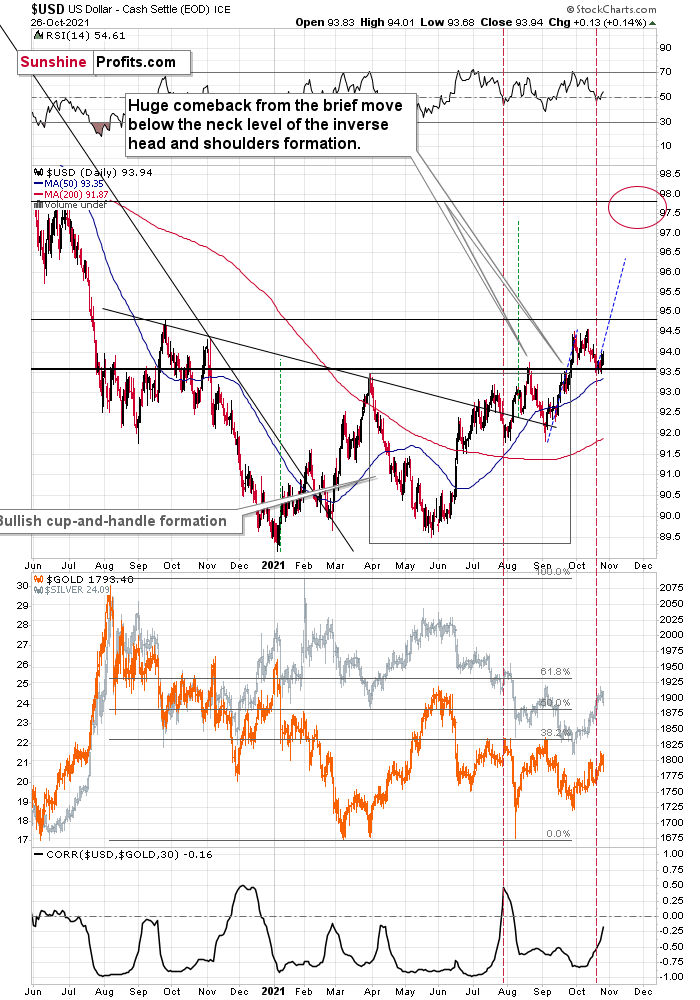
Let’s take a look at the USD Index first.

The key thing about the USD Index is that it didn’t invalidate its breakout to new 2021 highs. Instead, it verified it. The August high held as support and yesterday’s move higher confirms that.
The situation now appears to be the same as it was at the beginning of August, where the bottom also took several days to form, but when the USD Index finally moved higher once again, gold plunged. To be precise, back then, the bottom formed over 5 trading days, and yesterday was the fifth trading day of the current bottom. On the sixth day – back then – the USDX did very little and gold declined modestly, and it was the seventh day when the action really started. And… the short-term decline was over on the very next day. It was not easy to catch this decline if one wanted to wait for a big confirmation that it is indeed taking place. It seems that the same – patient – approach is justified in the current situation.
The RSI indicator (upper part of the chart) continues to confirm this similarity.
Thank you for reading our free analysis today. Please note that the above is just a small fraction of the full analyses that our subscribers enjoy on a regular basis. They include multiple premium details such as the interim targets for gold and mining stocks that could be reached in the next few weeks. We invite you to subscribe now and read today’s issue right away.
Sincerely,
Przemyslaw Radomski, CFA
Founder, Editor-in-chief -
Hey Gold, the USDX Has Put On Its Boxing Gloves
October 25, 2021, 9:51 AMThe USD Index has been eating its Wheaties, is itching for a fight, and it’s got solid fundamentals backing it up. Doesn’t look good for the metals.
While the USD Index has come under pressure in recent days, the dollar basket’s fundamentals are actually stronger now than they were during the September rally. On top of that, after the USD Index ended the week above its August daily closing high, the greenback’s technical breakout to new 2021 highs still remains intact.
More importantly, though, the recent price action mirrors what we witnessed back in early August. To explain, following its sharp summertime rally, the USD Index moved close to its 50-day moving average without reaching it. And after buyers stepped in, the USD Index resumed its uptrend and made a new 2021 high. Moreover, with a similar pattern and a similar reading on the USD Index’s RSI (Relative Strength Index) present today, the greenback’s uptrend should resume sooner rather than later. I marked both cases with red, vertical, dashed lines.
On the flip side, after gold, silver, and mining stocks’ upswings concluded once the USD Index bottomed close to its 50-day moving average in August, sharp drawdowns followed. As a result, the precious metals’ current upswing is likely to suffer a similar fate.
Please see below:
The middle part of the above chart features gold and silver and you can clearly see that the final pre-slide top in early August materialized when gold and silver reversed profoundly on an intraday basis. The same thing happened on Friday, and the implications are clearly bearish.
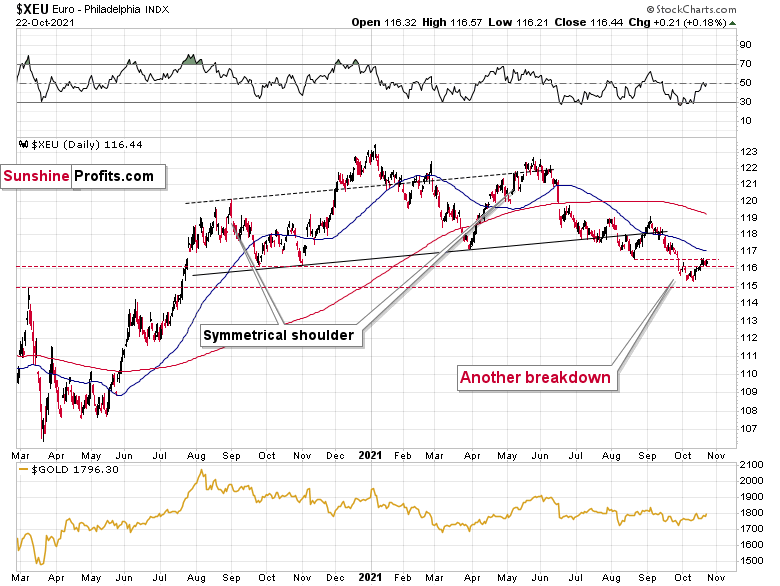
Equally bullish for the greenback, the Euro Index remains overvalued and should suffer a material drawdown over the medium term. For example, while the index closed above its late 2020 lows, it couldn’t recapture its August 2021 lows. Thus, the next temporary stop could be ~1.1500 (the March 2020 highs, then likely lower). For context, the EUR/USD accounts for nearly 58% of the movement of the USD Index, and that’s why the euro’s behavior is so important.
Please see below:
Adding to our confidence (don’t get me wrong, there are no certainties in any market; it’s just that the bullish narrative for the USDX is even more bullish in my view), the USD Index often sizzles in the summer sun and major USDX rallies often start during the middle of the year. Summertime spikes have been mainstays on the USD Index’s historical record and in 2004, 2005, 2008, 2011, 2014 and 2018 a retest of the lows (or close to them) occurred before the USD Index began its upward flights (which is exactly what’s happened this time around).
Furthermore, profound rallies (marked by the red vertical dashed lines below) followed in 2008, 2011 and 2014. With the current situation mirroring the latter, a small consolidation on the long-term chart is exactly what occurred before the USD Index surged in 2014. Likewise, the USD Index recently bottomed near its 50-week moving average; an identical development occurred in 2014. More importantly, though, with bottoms in the precious metals market often occurring when gold trades in unison with the USD Index (after ceasing to respond to the USD’s rallies with declines), we’re still far away from that milestone in terms of both price and duration.
Moreover, as the journey unfolds, the bullish signals from 2014 have resurfaced once again. For example, the USD Index’s RSI is hovering near a similar level (marked with red ellipses), and back then, a corrective downswing also occurred at the previous highs. More importantly, though, the short-term weakness was followed by a profound rally in 2014, and many technical and fundamental indicators signal that another reenactment could be forthcoming.
Please see below:
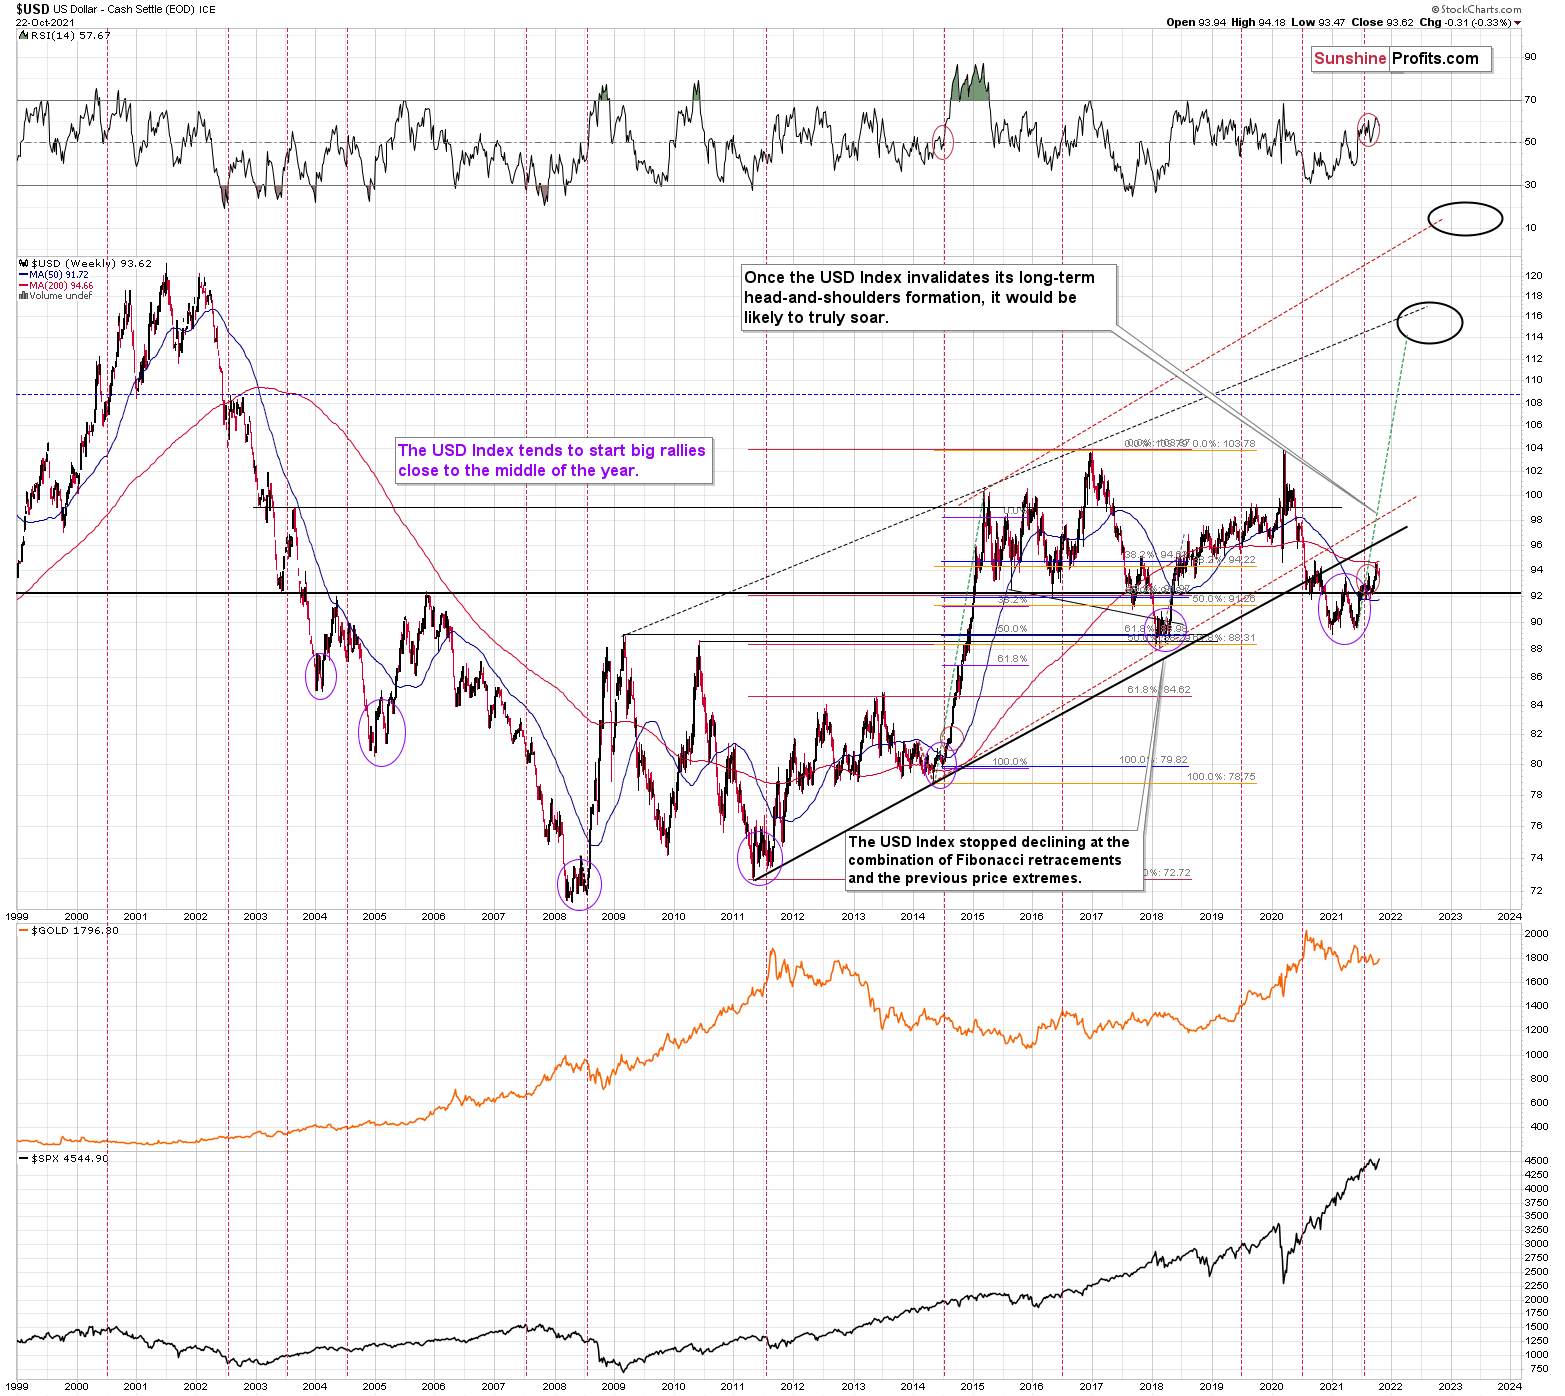
Just as the USD Index took a breather before its massive rally in 2014, it seems that we saw the same recently. This means that predicting higher gold prices (or the ones of silver) here is likely not a good idea.
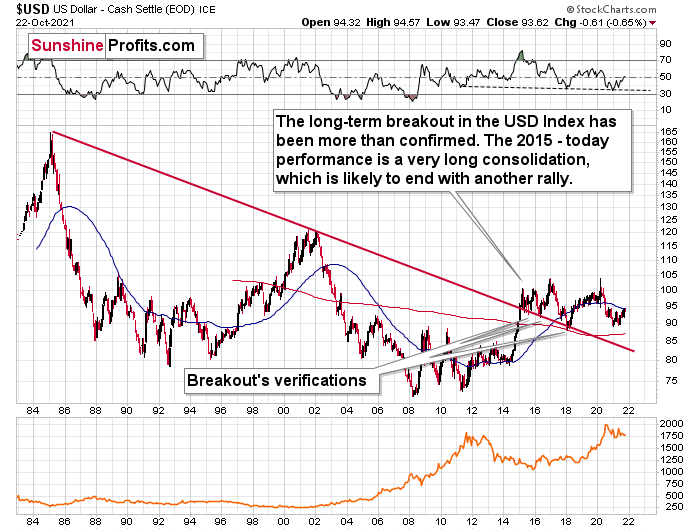
Continuing the theme, the eye in the sky doesn’t lie. And with the USDX’s long-term breakout clearly visible, the wind still remains at the dollar’s back.
Please see below:
The bottom line?
As the drama unfolds, the ~98 target is likely to be reached over the medium term, and the USDX will likely exceed 100 at some point over the medium or long term. Keep in mind though: we’re not bullish on the greenback because of the U.S.’ absolute outperformance. It’s because the region is fundamentally outperforming the Eurozone, the EUR/USD accounts for nearly 58% of the movement of the USD Index, and the relative performance is what really matters.
In conclusion, while the USD Index has pulled back from its recent highs, Fed Chairman Jerome Powell effectively announced on Oct. 22 that the central bank will taper its asset purchases in November/December. And with bullish reinforcements also gathering near the USD Index’s 50-day moving average, the greenback’s medium-term fundamentals and technicals remains robust. And with gold, silver, and mining stocks often moving inversely to the U.S. dollar, their performance is likely to suffer if/once the USD Index resumes its ascent.
Thank you for reading our free analysis today. Please note that the above is just a small fraction of the full analyses that our subscribers enjoy on a regular basis. They include multiple premium details such as the interim targets for gold and mining stocks that could be reached in the next few weeks. We invite you to subscribe now and read today’s issue right away.
Sincerely,
Przemyslaw Radomski, CFA
Founder, Editor-in-chief -
Early (Gold Video) Heads-up before the Next Week
October 23, 2021, 8:24 AMBased on Friday’s key event (reversal in mining stocks that we saw based on Powell’s tapering-related speech), I recorded a video in which I’m showing an analogy to a different kind of reversal and the most likely follow-up action.
You can access the video using the following link:


Gold Investment News
Delivered To Your Inbox
Free Of Charge
Bonus: A week of free access to Gold & Silver StockPickers.
Gold Alerts
More-
Status
New 2024 Lows in Miners, New Highs in The USD Index
January 17, 2024, 12:19 PM -
Status
Soaring USD is SO Unsurprising – And SO Full of Implications
January 16, 2024, 8:40 AM -
Status
Rare Opportunity in Rare Earth Minerals?
January 15, 2024, 2:06 PM

