
tools spotlight

-
Gold Stocks: The Upcoming Decline's Harbinger
November 2, 2021, 9:33 AMWhat a beautiful day that was! Well, the weather varied in different places of the planet, so I don’t mean that literally. What I mean is that Mr. Market was generous and provided us with a major confirmation exactly when it was needed.
Friday’s performance was breathtakingly bearish, as miners declined a few times more than gold and – in particular – silver, which is exactly the thing that we tend to see at the beginning of a short-term decline.
But maybe it was a single-day event only? One swallow doesn’t make a summer.
The question is: was Friday’s session a swallow?
It wasn’t, and what we saw yesterday confirms it.
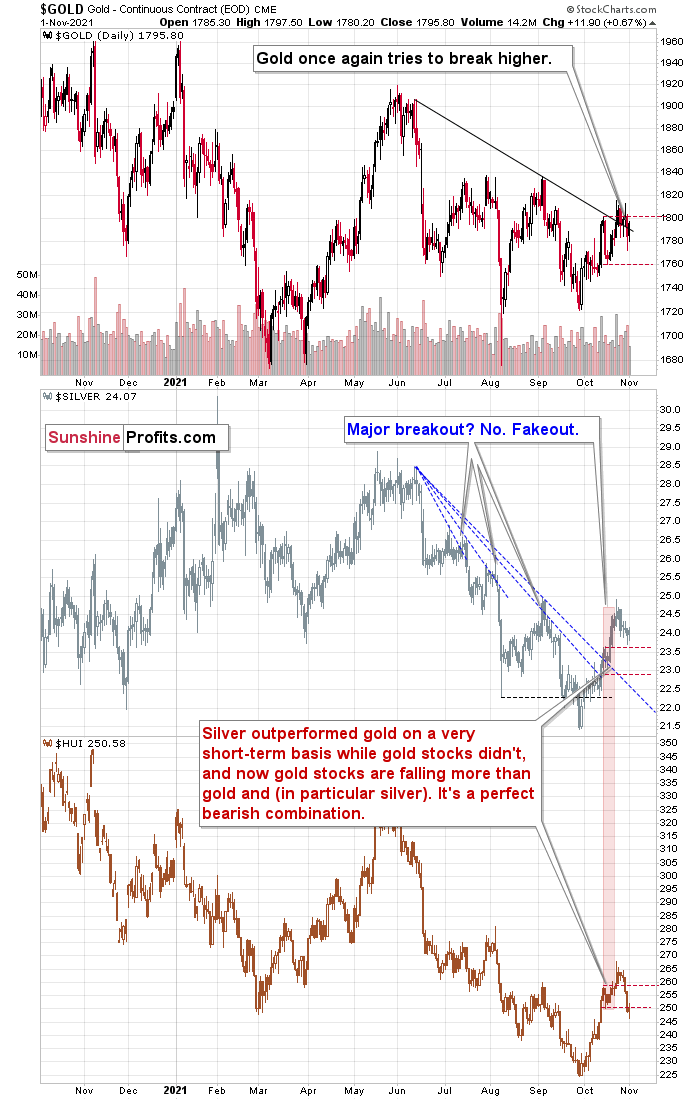
Gold moved higher and attempted to once again break above its declining resistance line. The move took place on relatively weak volume, which is exactly the opposite of what one should see as a sign of a breakout confirmation. What we saw yesterday was not (at least not yet) a bullish signal for gold. However, that’s not the most interesting thing that happened yesterday.
Silver did very little, and it’s not that informative on its own. It’s informative because it didn’t decline a lot. In particular, it didn’t catch up with mining stocks’ decline.
And this brings us to the main analytical course of today’s menu.
The Main Dish
Gold stocks didn’t rally back up despite the volatile nature of Friday’s decline and despite gold’s ~$12 rally. The general stock market was slightly up yesterday, so miners had no good reason not to rally. Unless…
Unless it’s the beginning of another big decline, and we are still very early in the process. In this case, it would be perfectly understandable for the mining stocks to behave this way.
Gold miners had all the reasons to erase a large part of their Friday’s declines, but they didn’t do so. What does it indicate for gold?
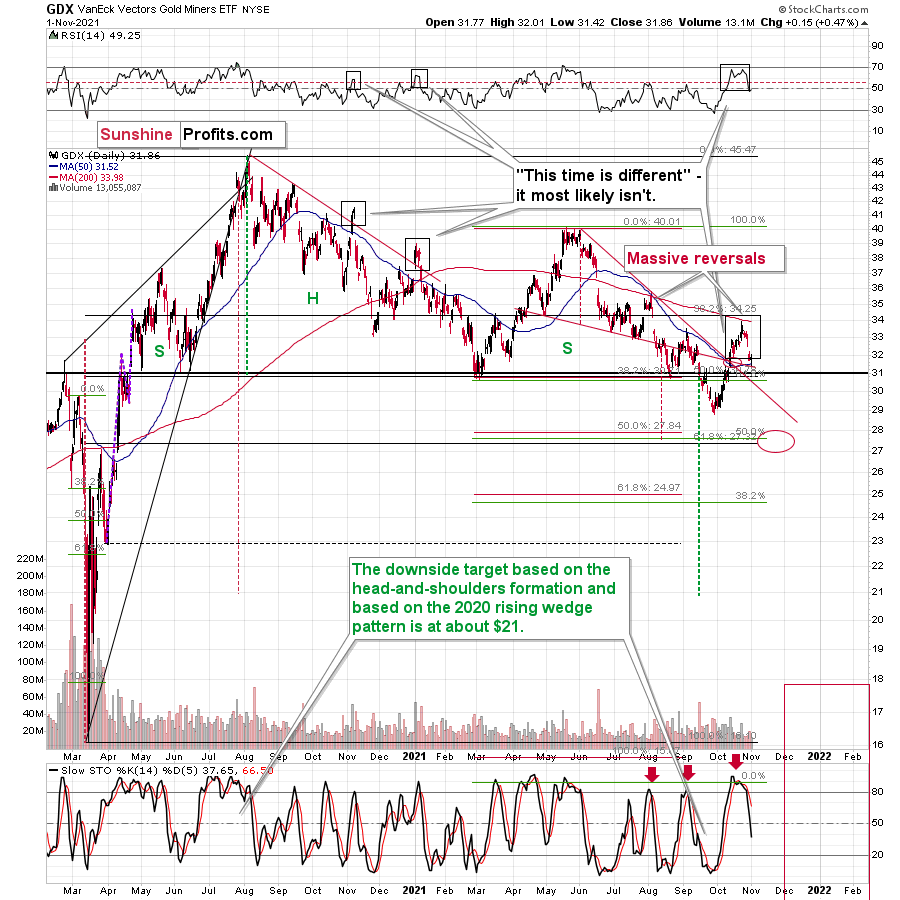
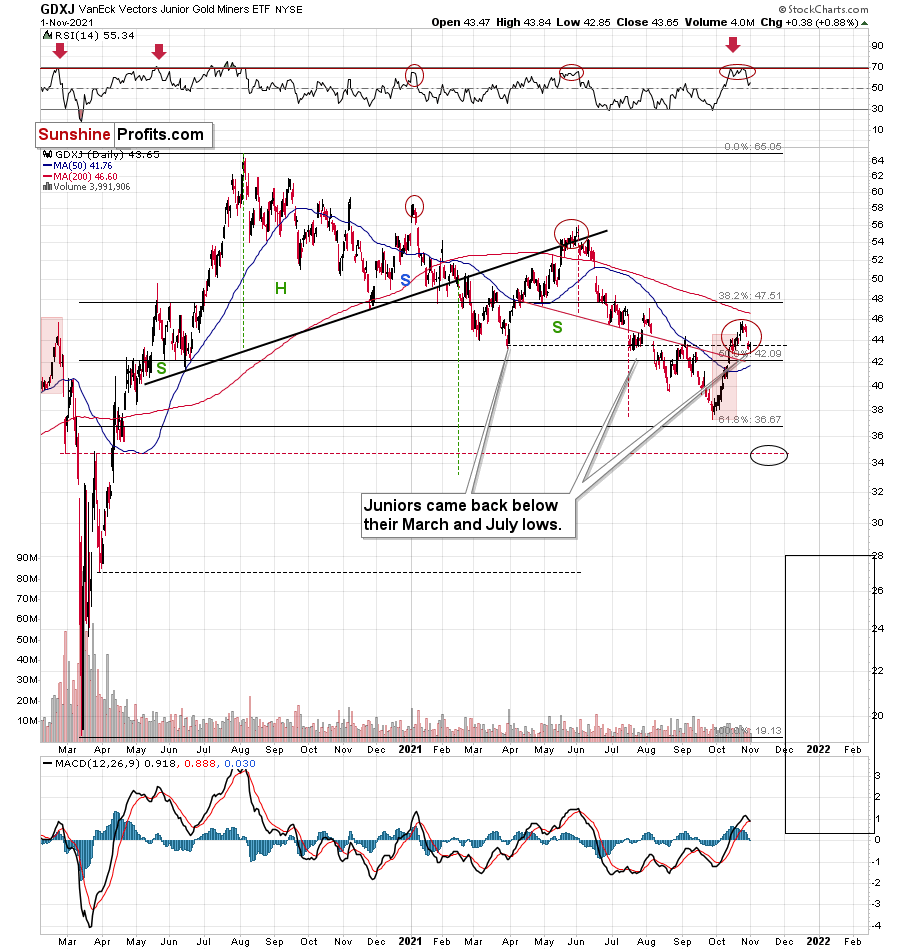
The GDX was up by $0.15, and the GDXJ was up by $0.38. So, they barely moved.
By the way, do you see how little it now takes for the MACD based on the GDXJ (lower part of the above chart) to flash a sell signal? The upcoming sell signal will (as it’s likely just ahead) be similar to only two events from the recent past – the January top and the June top.
What followed in both cases? Significant declines. Is this time different? You already know the answer. It’s highly unlikely.
Moving back to miners’ relative performance, if you take into account Friday’s and Monday’s sessions at the same time, you get the following price moves:
- Gold price is down by $6.8 (0.38%)
- Silver price is down by $0.05 (0.21%)
- GDX is down by $0.73 (2.24%)
Silver is holding up quite well while miners are strongly underperforming – that’s exactly what one should see at the beginning of a big move lower.
All in all, while the outlook for the precious metals sector is very bullish for the following years, it’s very bearish for the following weeks.
Thank you for reading our free analysis today. Please note that the above is just a small fraction of the full analyses that our subscribers enjoy on a regular basis. They include multiple premium details such as the interim targets for gold and mining stocks that could be reached in the next few weeks. We invite you to subscribe now and read today’s issue right away.
Sincerely,
Przemyslaw Radomski, CFA
Founder, Editor-in-chief -
What Does November Hold for the Miners?
November 1, 2021, 10:37 AMAs a new month begins, the downtrend in the GDX and GDXJ should resume. When will a new buying opportunity finally present itself?
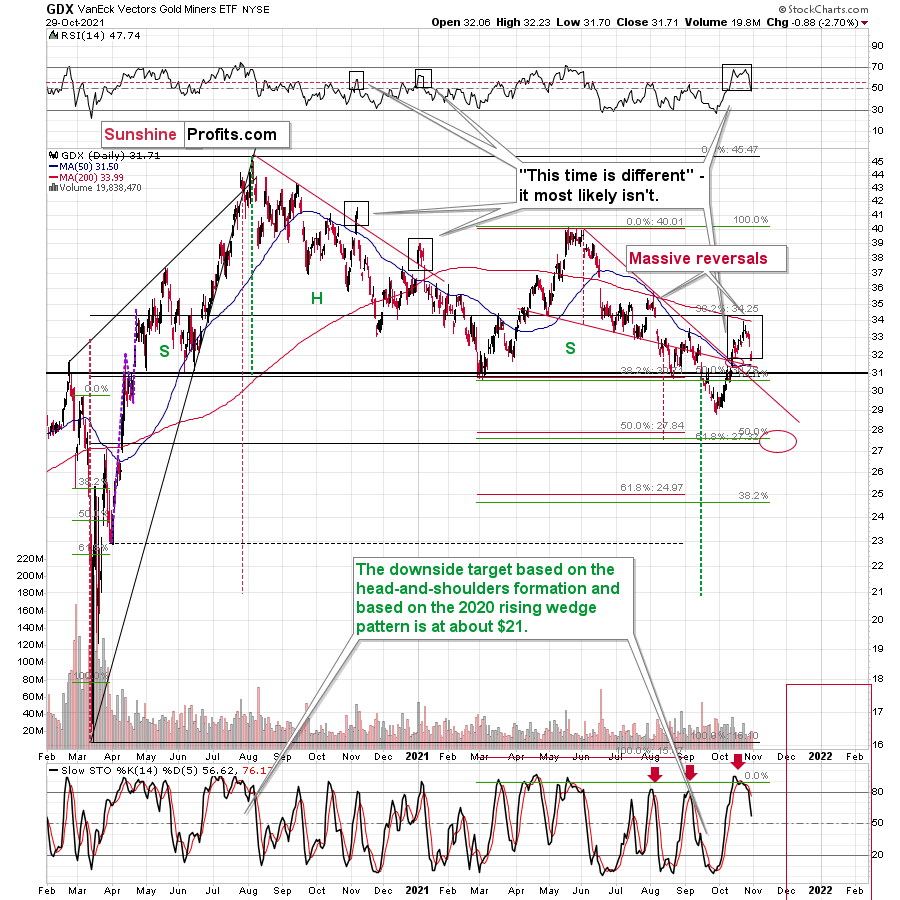
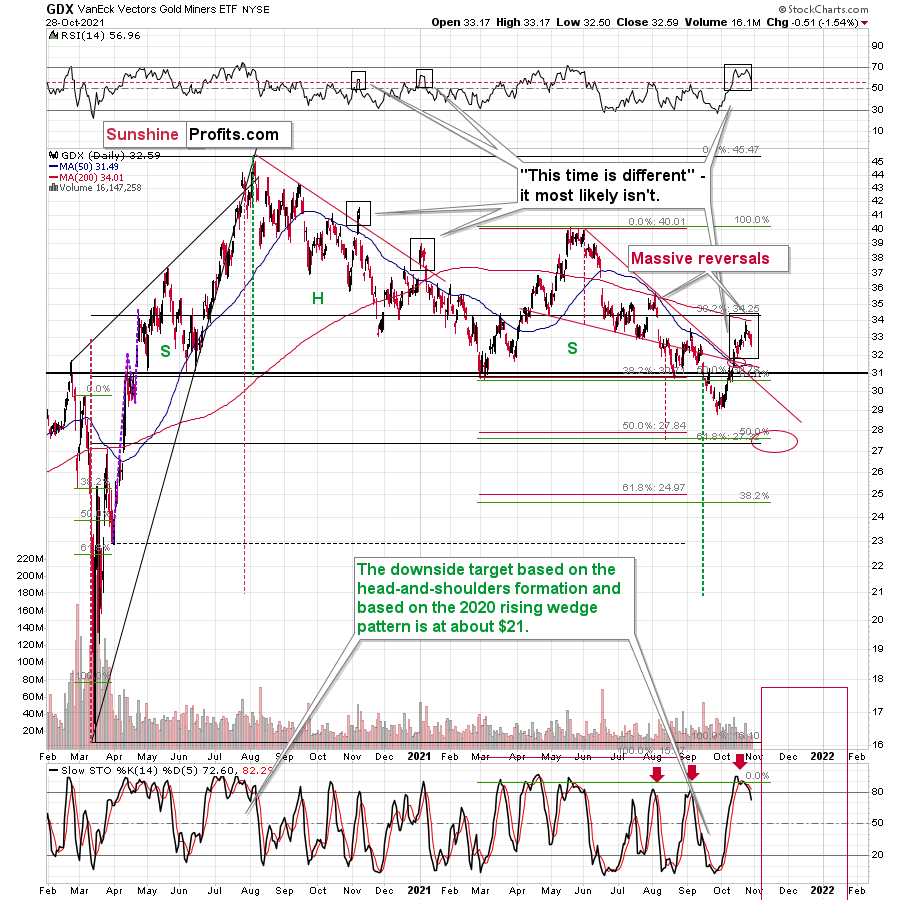
Let’s compare the behavior of the GDX ETF and the GDXJ ETF. Regarding the former, the GDX ETF reversed sharply after reaching its 200-day moving average and a confluence of bearish indicators signaled a similar outcome. For context, I wrote on Oct. 25:
Small breakout mirrors what we witnessed during the senior miners’ downtrend in late 2020/early 2021. Moreover, when the GDX ETF’s RSI (Relative Strength Index) approached 70 (overbought conditions) back then, the highs were in (or near) and sharp reversals followed.
Furthermore, after a sharp intraday reversal materialized on Oct. 22, the about-face is similar to the major reversal that we witnessed in early August. On top of that, with the GDX ETF’s stochastic indicator also screaming overbought conditions, the senior miners are likely to move lower sooner rather than later.
Also, please note that the GDX ETF reversed right after moving close to its 200-day moving average, which is exactly what stopped it in early August. Yes – that’s another link between now and early August.
And after declining sharply on Oct. 28 and Oct. 29, the senior miners further cemented their underperformance of gold. Moreover, with relative underperformance often a precursor to much larger declines, the outlook for the GDX ETF remains quite bearish.
Please see below:
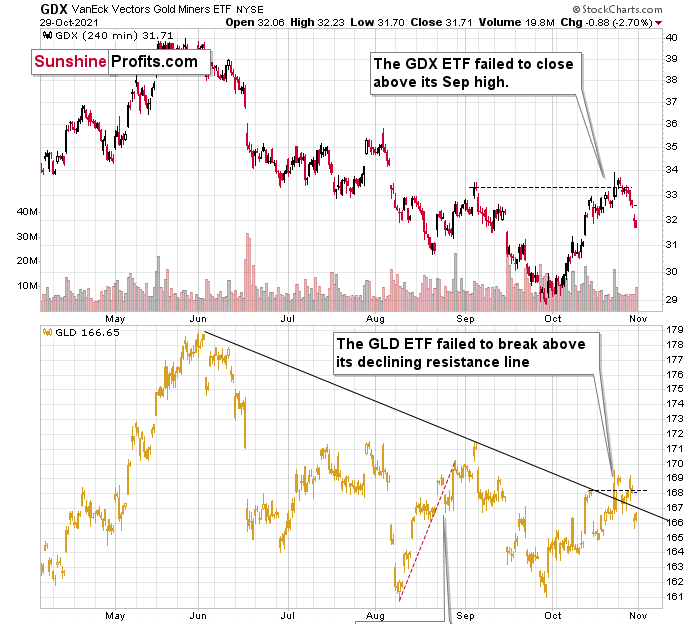
As further evidence, the GDX ETF’s four-hour chart offers some important insights. To explain, the senior miners failed to hold their early September highs and last week’s plunge removed any and all doubt. Likewise, the GLD ETF suffered a sharp drawdown and its recent breakout was also invalidated.
Furthermore, my three-day rule for confirming breakouts/breakdowns proved prescient once again. Conversely, investors that piled into mining stocks are likely regretting their decision to act on unconfirmed signals. And as we look ahead, the technicals imply that caution is warranted and more downside is likely for the GDX ETF.
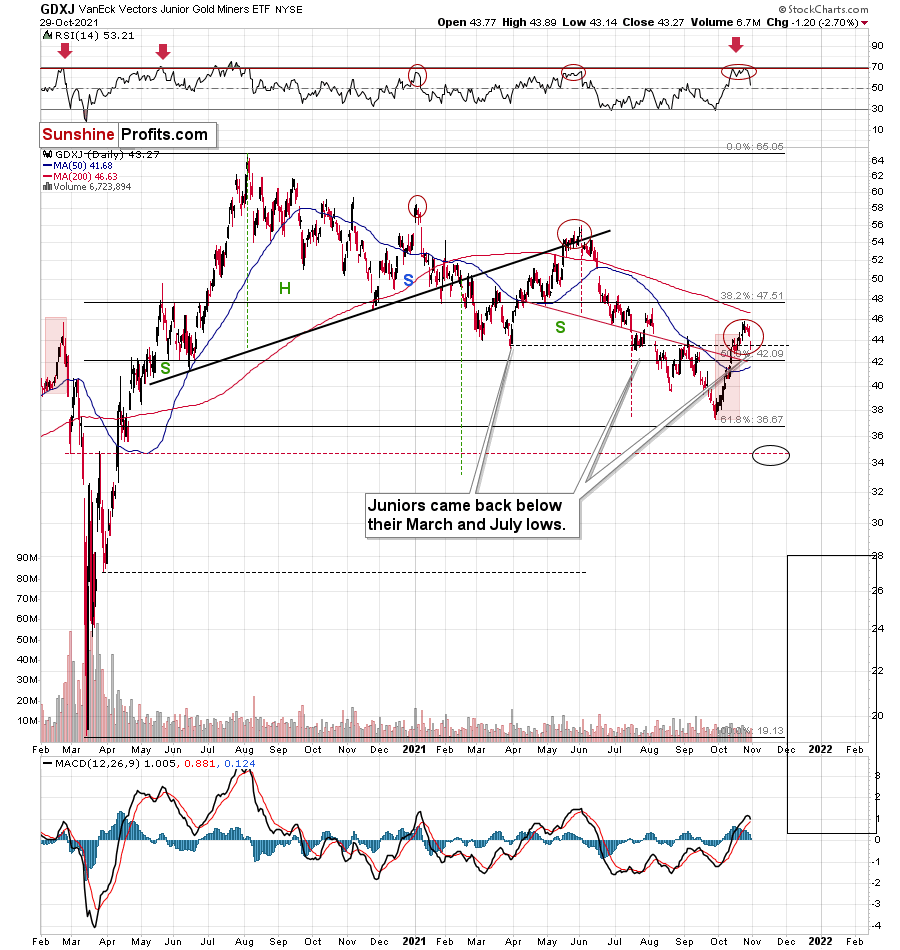
As for the GDXJ ETF, the gold junior miners suffered a similar swoon last week. For context, I warned of the prospective reversal on Oct. 25. I wrote:
The junior miners’ RSI also signals overbought conditions and history has been unkind when similar developments have occurred. Moreover, the GDXJ ETF’s recent rally follows the bearish patterns that we witnessed in late May and in early 2021. Likewise, the intraday reversal on Oct. 22 mirrors the bearish reversal from early August and a confluence of indicators support a continuation of the downtrend over the coming weeks.
And as we begin a new month, the GDXJ ETF’s downtrend should resume and a retracement to the ~35 level will likely materialize in the coming months.
Please see below:
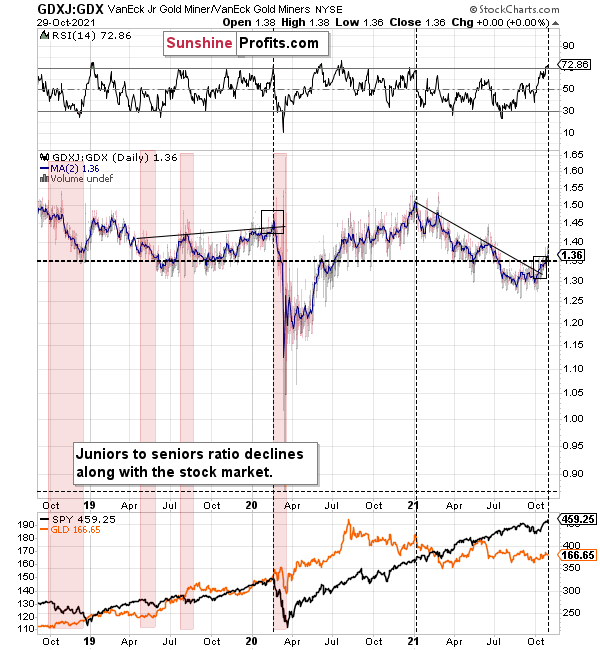
Finally, while I’ve been warning for months that the GDXJ/GDX ratio was destined for devaluation, the ratio has fallen precipitously in 2021. And after the recent short-term rally, the ratio’s RSI has reached extremely elevated levels (nearly 73) and similar periods of euphoria have preceded major drawdowns (marked with the black vertical dashed lines below).
To that point, the ratio showcased a similar overbought reading in early 2020 – right before the S&P 500 plunged. On top of that, the ratio is still below its mid-to-late 2020 lows and its mid-2021 lows. As a result, the GDXJ ETF will likely underperform the GDX ETF over the next few months. It’s likely to underperform silver in the near term as well.
The bottom line?
If the ratio is likely to continue its decline, then on a short-term basis we can expect it to trade at 1.27 or so. If the general stock market plunges, the ratio could move much lower, but let’s assume that stocks decline moderately or that they do nothing or rally slightly. They’ve done all the above recently, so it’s natural to expect that this will be the case. Consequently, the trend in the GDXJ to GDX ratio would also be likely to continue, and thus expecting a move to about 1.26 - 1.27 seems rational.
If the GDX is about to decline to approximately $28 before correcting, then we might expect the GDXJ to decline to about $28 x 1.27 = $35.56 or $28 x 1.26 = $35.28. In other words, ~$28 in the GDX is likely to correspond to about $35 in the GDXJ.
Is there any technical support around $35 that would be likely to stop the decline? Yes. It’s provided by the late-Feb. 2020 low ($34.70) and the late-March high ($34.84). There’s also the late-April low at $35.63.
Consequently, it seems that expecting the GDXJ to decline to about $35 is justified from the technical point of view as well.
In conclusion, mining stocks reprised their role as ‘The Boy Who Cried Wolf.’ And after overzealous investors rushed to their defense last week, another false alarm led to another bout of disappointment. Moreover, with the technical and fundamental backdrops for gold, silver and mining stocks continuing to deteriorate, lower lows should materialize over the medium term. As a result, we may have to wait until 2022 before reliable buying opportunities emerge once again.
Thank you for reading our free analysis today. Please note that the above is just a small fraction of the full analyses that our subscribers enjoy on a regular basis. They include multiple premium details such as the interim targets for gold and mining stocks that could be reached in the next few weeks. We invite you to subscribe now and read today’s issue right away.
Sincerely,
Przemyslaw Radomski, CFA
Founder, Editor-in-chief -
Halloween Video Analysis: Silver vs. Werebanana
October 31, 2021, 2:25 PMWerewolves are scared of silver as it’s one of the few weapons that are said to be effective against them.
But what about werebananas? And bat-bananas?
It’s Halloween 2021, and I simply couldn’t resist recording this video. :)
The format of this video is… well, as it is, however, the analysis presented in it is based on meticulous research and almost two decades of experience. Tomorrow’s premium analysis will provide many of the key details about the recent price movement in gold, silver, and gold & silver mining stocks.
-
Early (Gold Video) Heads-up before the Next Week
October 30, 2021, 6:18 AMBased on Friday’s key event (breakdown in gold), I recorded a video in which I’m showing just how ironic the October rally was and what’s likely ahead.
You can access the video using the following link:
-
USDX: What Counts More - Time or Price?
October 29, 2021, 8:56 AMAfter no significant action for a few days, something really interesting (finally!) happened in the markets. The trigger was quite random (Lagarde’s rather uninformative comments during a press conference; I’ll comment on that later today), but the way in which markets reacted was profoundly informative.
First Things First
I received a few questions about the situation in the USD Index, so let’s start today’s technical part with it.
Based on the rather random comment during the conference, the traders panicked and bought the EUR/USD, which triggered declines in the USD Index (after all, the EUR/USD is the largest component of the USDX).
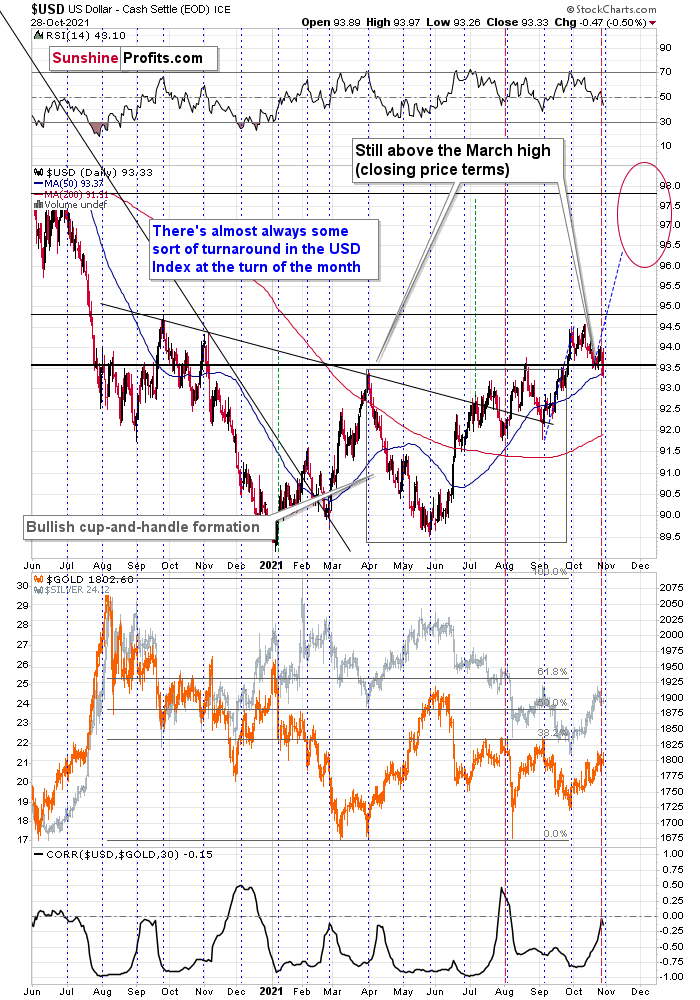
Was the breakout to new 2021 lows invalidated? No. The true breakout was above the late-March highs (the August highs also served as a support level, but the March high is more important here) and it wasn’t invalidated.
What was the follow-up action? At the moment of writing these words, the USDX is up and trading at about 93.52, which is just 0.07 below the August high in terms of the closing prices. Consequently, it could easily be the case that the USD Index ends today’s session (and the week) back above this level.
You’ve probably heard the saying that time is more important than price. It’s the end of the month, so let’s check what happened in the case of previous turns of the month; that’s where we usually see major price turnarounds. I marked the short-term turnarounds close to the turns of the month with horizontal dashed blue lines, and it appears that, in the recent past, there was practically always some sort of a turnaround close to the end of the month. Consequently, seeing a turnaround (and a bottom) in the USD index now would be perfectly normal.
Moreover, please note that despite USD’s sizable daily decline, gold was barely up. This is not a bullish type of reaction for the PMs, but a bearish one.
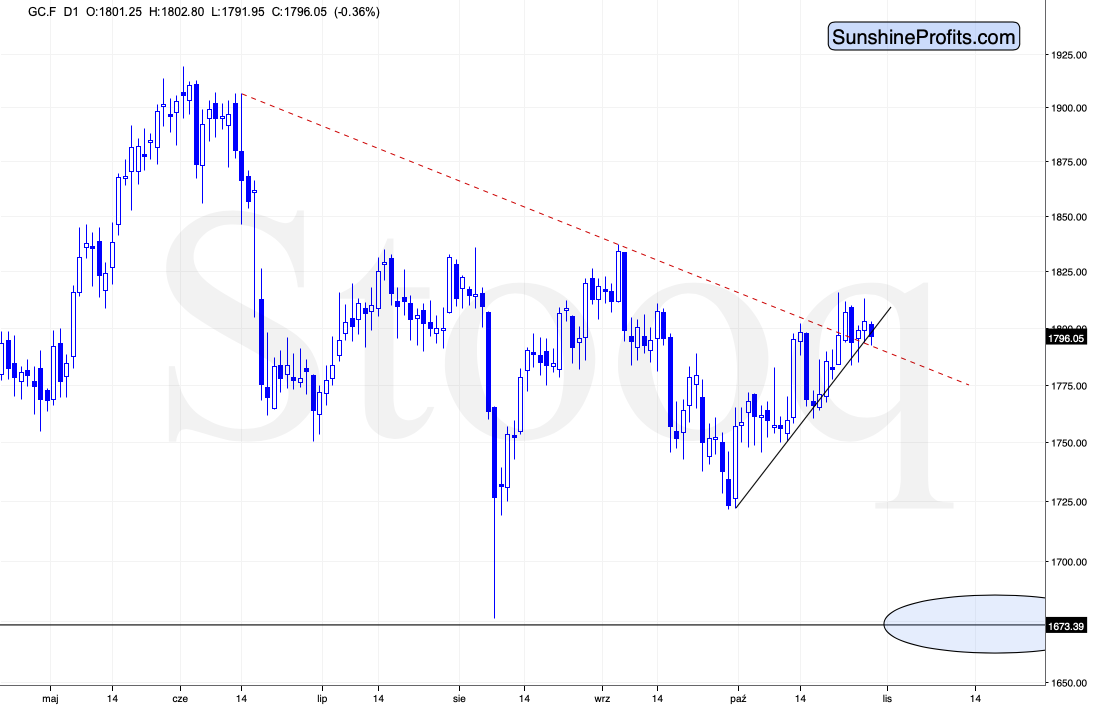
While the price of gold moved higher yesterday, please note that yesterday’s turnaround took place at the triangle-vertex-based reversal, and the fact that we saw another intraday reversal makes the current situation even more similar to what we saw in early August before the sizable slide.
Just a little more weakness and we’ll see a short-term breakdown that could take gold much lower very quickly.
Yesterday’s price action in gold stocks confirms this scenario.
Even though gold ended the day slightly up, the mining stocks (GDX) were down by over 1.5%. In yesterday’s analysis, I emphasized that the days of miners’ strength relative to gold are likely numbered. Yesterday’s performance appears to confirm that and thus the next downswing seems to have already begun.
Thank you for reading our free analysis today. Please note that the above is just a small fraction of the full analyses that our subscribers enjoy on a regular basis. They include multiple premium details such as the interim targets for gold and mining stocks that could be reached in the next few weeks. We invite you to subscribe now and read today’s issue right away.
Sincerely,
Przemyslaw Radomski, CFA
Founder, Editor-in-chief


Gold Investment News
Delivered To Your Inbox
Free Of Charge
Bonus: A week of free access to Gold & Silver StockPickers.
Gold Alerts
More-
Status
New 2024 Lows in Miners, New Highs in The USD Index
January 17, 2024, 12:19 PM -
Status
Soaring USD is SO Unsurprising – And SO Full of Implications
January 16, 2024, 8:40 AM -
Status
Rare Opportunity in Rare Earth Minerals?
January 15, 2024, 2:06 PM

