
tools spotlight

-
Markets Panic Over Rate Hikes. Will Powell Calm Them Down?
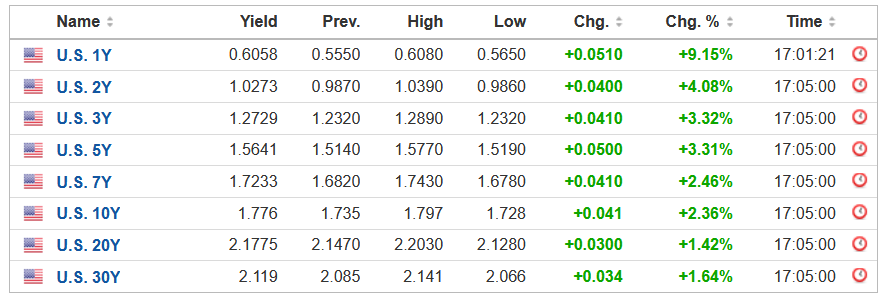
January 26, 2022, 9:16 AMWith Fed Chairman Jerome Powell taking center stage this afternoon, the financial markets are still freaking out about potential rate hikes. For example, the S&P 500 and the NASDAQ Composite sold off into the close on Jan. 25, and U.S. Treasury yields continued their bullish ascent.
Please see below:
 Source: Investing.com
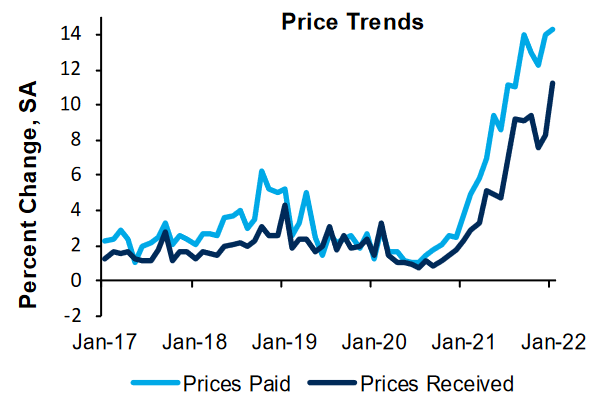
Moreover, with the inflationary outlook still materially unsettled, the FOMC has little room for a dovish pivot. To explain, the Richmond Fed released its Fifth District Survey of Manufacturing Activity on Jan. 25. While the headline index decreased from 16 in December to 8 in January, both the prices paid and received indexes rallied to new all-time highs.
Please see below:
 Source: Richmond Fed
Likewise, the report also revealed that “the wage index increased to 40, which is the second-highest value on record. Firms expect wages to continue increasing, with the expected wage index remaining firmly in expansionary territory.”
Speaking of wages, the Fed’s inflationary conundrum has broken the connection between the labor market differential and Americans’ net income expectations. For context, The Confidence Board’s metric calculates the net result of survey respondents’ beliefs that jobs are easy to obtain versus difficult to obtain.
Please see below:
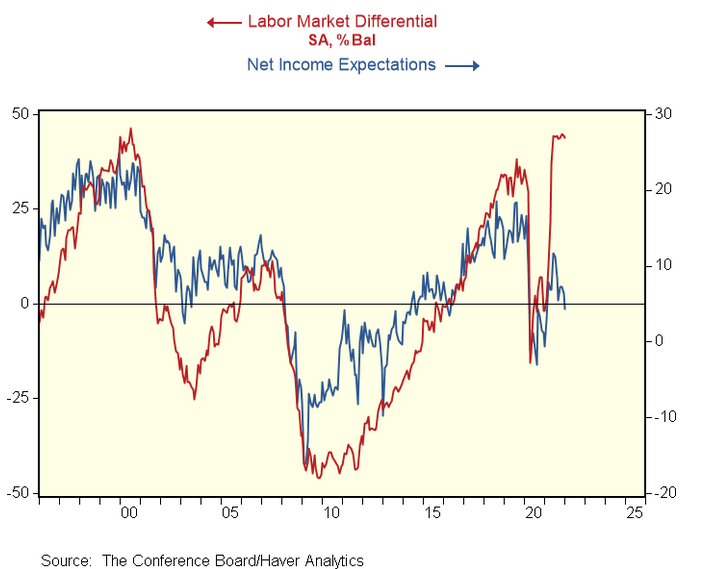
To explain, the red line above tracks the labor differential, while the blue line above tracks Americans’ net income expectations. When the red line is rising, it means that more respondents believe that jobs are easy to obtain. However, if you analyze the right side of the chart, you can see that the blue line hasn’t followed suit. As a result, with inflation eating away at Americans’ net incomes, the Fed needs to act to restore the historical relationship.
To that point, the Fed’s dual mandate is to control inflation and ensure maximum employment. With The Confidence Board’s labor differential near an all-time high, the Fed’s hawkish disposition is valid in this environment. Thus, with a strong U.S. labor market coupled with extremely elevated inflation, it’s the perfect combination for the FOMC to raise interest rates in the coming months.
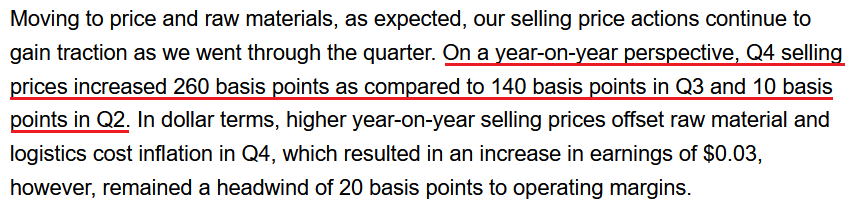
As further evidence, 3M released its fourth-quarter earnings on Jan. 25. After beating on both the top and the bottom lines, management said: “our revenue in the quarter finished better than we expected across all businesses (…). Overall, demand remains strong across our market-leading businesses, and we are continuing to prioritize growth investments in large attractive markets.”
Moreover, with inflation still increasing, CFO Monish Patolawala said the following during the Q4 earnings call:
 Source: 3M/Seeking Alpha
In addition, American Express also released its fourth-quarter earnings on Jan. 25. After beating on both the top and the bottom lines, the credit card giant painted a rosy portrait of the U.S. consumer. CEO Stephen Squeri told analysts during the Q4 earnings call:
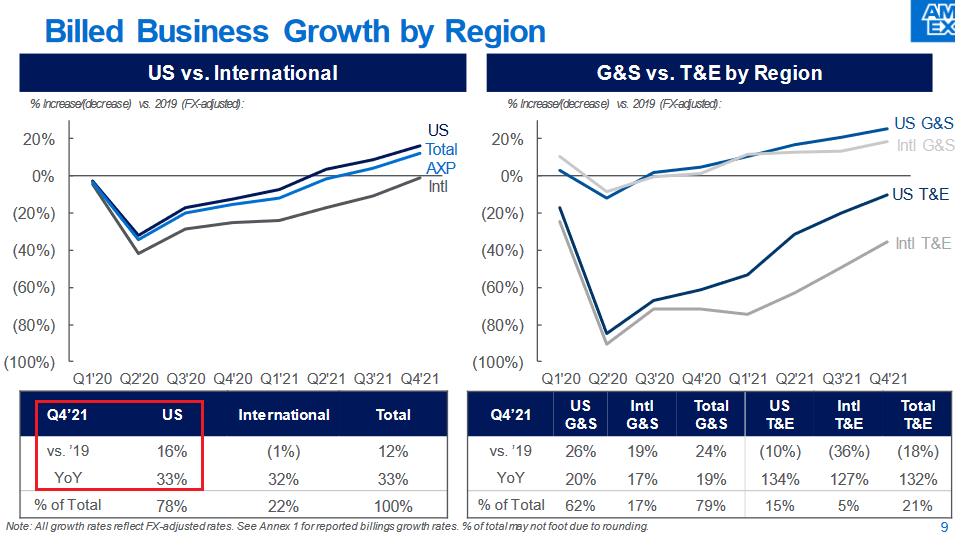
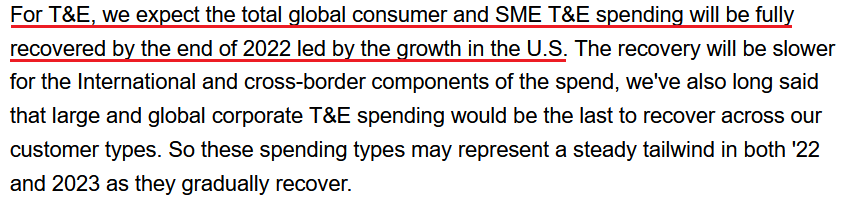
“Spending growth reached a record quarterly high, driven by continued increases in goods and services spending, which was 24% above pre-pandemic levels. Global consumer goods and services spending in the quarter grew 26% versus 2019. And we saw continued robust growth in small business B2B spending, which increased 25% over Q4 2019 levels. Overall T&E spending also continued to improve reaching 82% of pre-pandemic levels, driven by stronger consumer travel spend.”
He added:
“Our billed business momentum continues to be led by the U.S., where spending improved sequentially throughout 2021 and grew 16% above 2019 levels in the fourth quarter.”
Please see below:
 Source: American Express
What’s more, while the Omicron variant has disrupted travel and expense (T&E) spending, the U.S. is still outperforming the rest of the world. Squeri said:
“We did see some modest impacts from the Omicron variant in T&E spending as the pace of recovery slowed a bit in December. But even with that modest slowdown, U.S. consumer T&E was not only fully recovered in the fourth quarter, but actually grew 8% above 2019 levels.”
As a result:
 Source: American Express/Seeking Alpha
Tread Carefully, Powell
Thus, while I’ve stated this on numerous occasions: the U.S. economy remains resilient and the U.S. consumer is quite strong as well. However, with a bullish U.S. economy bearish for the PMs and the NASDAQ Composite, liquidity-fueled assets should struggle in the coming months.
For example, American Express’ quarterly outperformance supports the Fed’s hawkish stance. With inflation extremely elevated and growth and consumer spending only stifled due to coronavirus disruptions, the warmer weather should result in renewed economic optimism. As a result, hiking interest rates is a logical reaction from the Fed.
Finally, while the USD Index has been relatively range-bound in recent weeks, brighter days are likely ahead. For context, we don’t expect any bombshell announcements from Powell today. However, with rate hikes poised to commence in the coming months, Bank of America told its clients that the USD Index remains a “buy-on-dip” story.
Please see below:
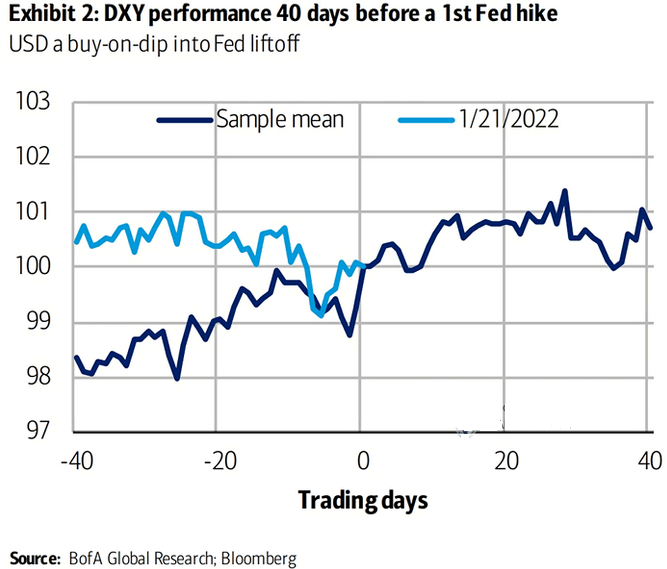
To explain, the dark blue line above tracks the USD Index’s average performance 40 days before the Fed raises interest rates, while the light blue line above tracks the current price action. As you can see, the USD Index is still trading within its expected range. However, with the dark blue line signaling that higher highs are often the norm as we approach the Fed’s official announcement, fundamental reinforcements should uplift the USD Index over the next few months. As such, more pain should confront the PMs.
The bottom line? While many market participants now fear a U.S. recession, the data suggests otherwise. With U.S. consumers still eager to spend their money, imagine their optimism when the cold weather and coronavirus panic fades in the coming months. Likewise, if U.S. economic growth is holding up this well when sentiment is severely depressed, the FOMC should have the foresight to see the results when consumers can resume their daily routines.
However, please note that resilient economic growth doesn’t mean that things are bullish for the general stock market. Sure, banks, industrials, energy, and other economic-sensitivity sectors should benefit from higher interest rates. Conversely, technology and communication services account for nearly 40% of the S&P 500 and 100% of the NASDAQ Composite. As a result, sometimes too much of a good thing is actually bad.
In conclusion, the PMs rallied on Jan. 25, despite the general stock market’s struggles. However, while Powell may try and calm investors’ nerves today, he has little room to avoid rate hikes in the coming months. Moreover, with U.S. President Joe Biden imploring Powell to curb inflation, the writing is largely on the wall. As a result, the USD Index and U.S. Treasury yields have the fundamental wind at their backs, and it’s likely only a matter of time before the PMs realize this harsh reality.
Thank you for reading our free analysis today. Please note that the above is just a small fraction of the full analyses that our subscribers enjoy on a regular basis. They include multiple premium details such as the interim targets for gold and mining stocks that could be reached in the next few weeks. We invite you to subscribe now and read today’s issue right away.
Sincerely,
Przemyslaw Radomski, CFA
Founder, Editor-in-chief -
Gold Miners Fell Instead of Rising. What Is This Witchcraft?
January 25, 2022, 9:13 AMGold rallied by almost $10 yesterday, while the stock market reversed and ended the session in the green. Why did miners decline anyway?
Because they’re weak, that’s why. This is because there is a medium-term downtrend in them. In fact, let’s keep in mind that it was only gold that managed to break above the 2011 highs – neither silver nor mining stocks got even close to similar price levels. Thus, has the real bull market in the precious metals sector begun yet? No, it hasn’t. It was only gold that caught people’s attention, and only temporarily so.
The fact is that despite the open-ended QE, historically low interest rates for years, and a global pandemic that triggered world-wide lockdowns, gold was unable to hold the breakout above its 2011 high. If this doesn’t make you suspicious about the real strength of the gold bull market, then I don’t know what would.
Let’s check the HUI Index – the flagship proxy for gold stocks – and see where the gold miners are.
After all, gold stocks tend to perform exceptionally well at the beginning of massive bull markets. For example, that was the case between 2000 and 2002.
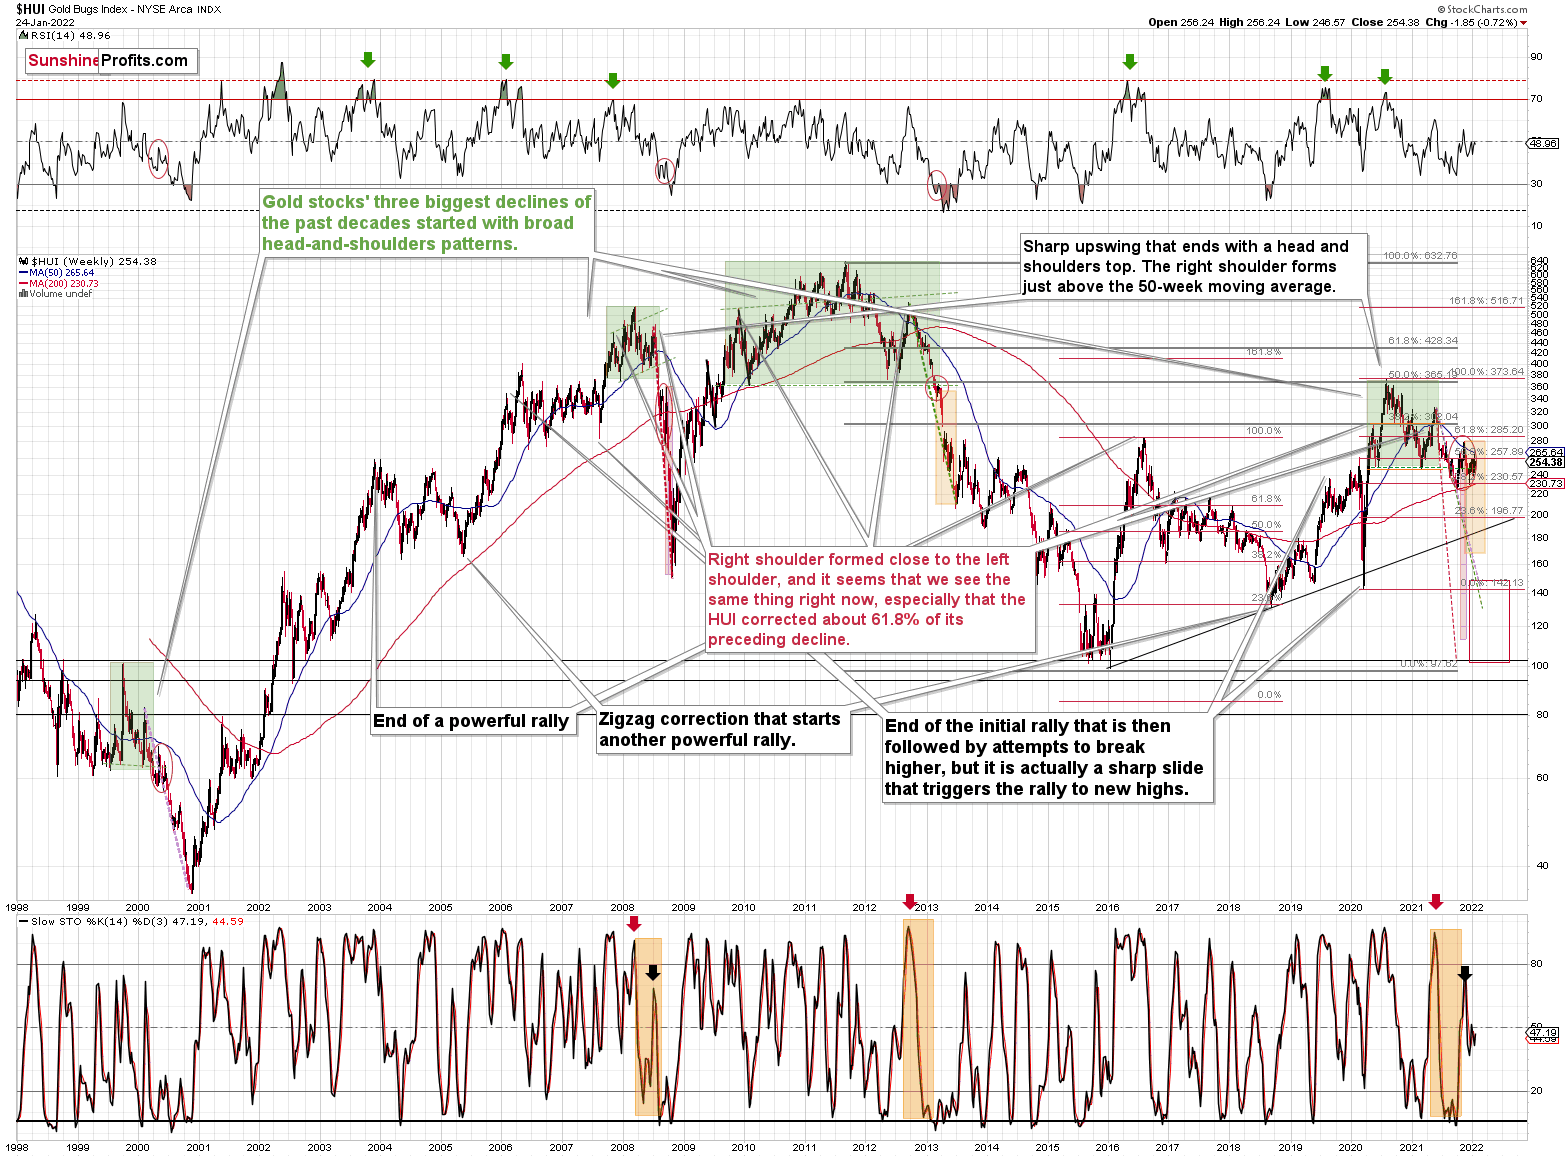
Between its 2000 low and 2002 high, the HUI Index rallied by over 300%, while gold rallied by less than 40%. Now that’s outperformance!
Now, between the bottoms of 2015 and 2016, gold is up by 75%, and the HUI Index is up by about 150%. There is still some leverage (several times less!), but if we compare that to the sizes of the declines and the risk in general, things are much worse.
Gold is now over $400 above its 2016 high. The HUI Index is below its 2016 high.
The HUI Index is below its 2008 high.
In fact, the HUI Index is now even below its 2003 highs! Can you imagine that? Well, you don’t have to imagine it because these are the facts. However, please think about it: gold rallied from about $400 to about $1,800 – more than quadrupling its price, and gold stocks are trading lower.
Based on similarities from previous patterns that were preceded by massive head-and-shoulders formations (marked with green), we can expect to see a massive decline, and the long-term weakness of gold stocks vs. gold provides an excellent background for such a slide.
Want reasons of a more fundamental nature? The rates are going up in the U.S. but not that much in the rest of the world. Consequently, the real interest rates are going up in the U.S. and the same is likely for the USD Index. The two key headwinds for gold are about to blow at full strength.
While gold is likely to decline, given the weakness that gold stocks have been proving over and over again, they are likely to truly slide in such an environment. In particular, junior mining stocks, which have proven to be most vulnerable during the 2020 slide, and also during the recent (and this year’s) declines.
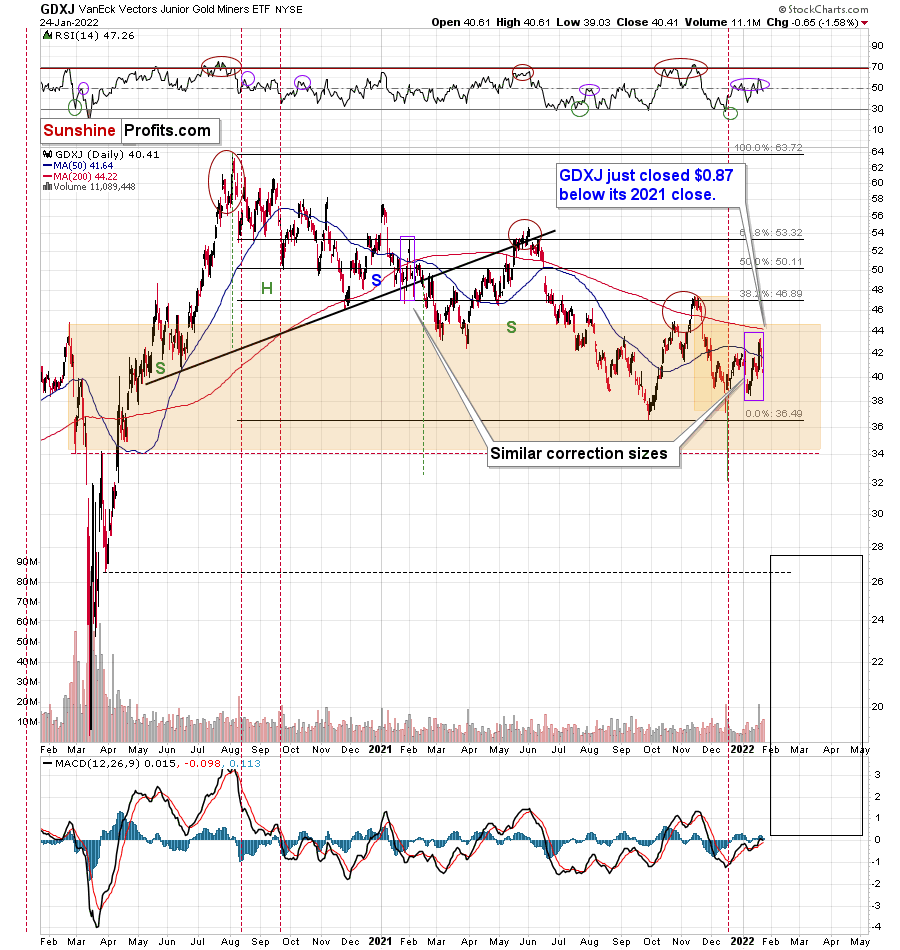
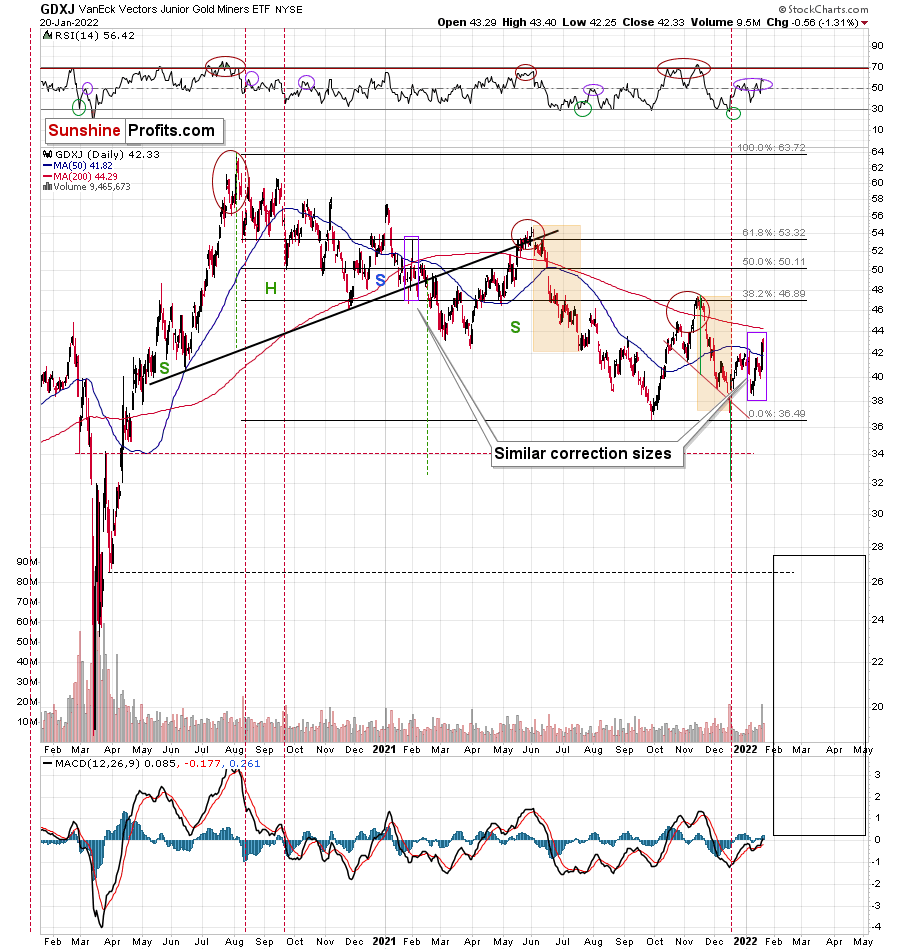
The GDXJ ETF – a proxy for junior mining stocks – declined and reversed some of its declines before the end of the day. This might appear bullish, until you factor in the following facts:
- gold closed the day almost $10 higher;
- the general stock market ended the day higher.
Consequently, mining stocks should have rallied yesterday, but instead they declined by over 1.5% anyway. This underperformance is bearish. Period.
Please note the broad red rectangle that I placed on the above chart. It’s there to illustrate the size of the initial 2020 decline.
Yes, junior miners are already below the price levels from which the 2020 started, and if they simply decline as much as they declined back then (so, I’m not asking for anything “completely new” to happen), they could be at $34 in a matter of days.
For now, junior miners bounced off of their rising support line, but this doesn’t change the fact that they greatly underperformed gold and the general stock market, which means that the implications of yesterday’s session are bearish.
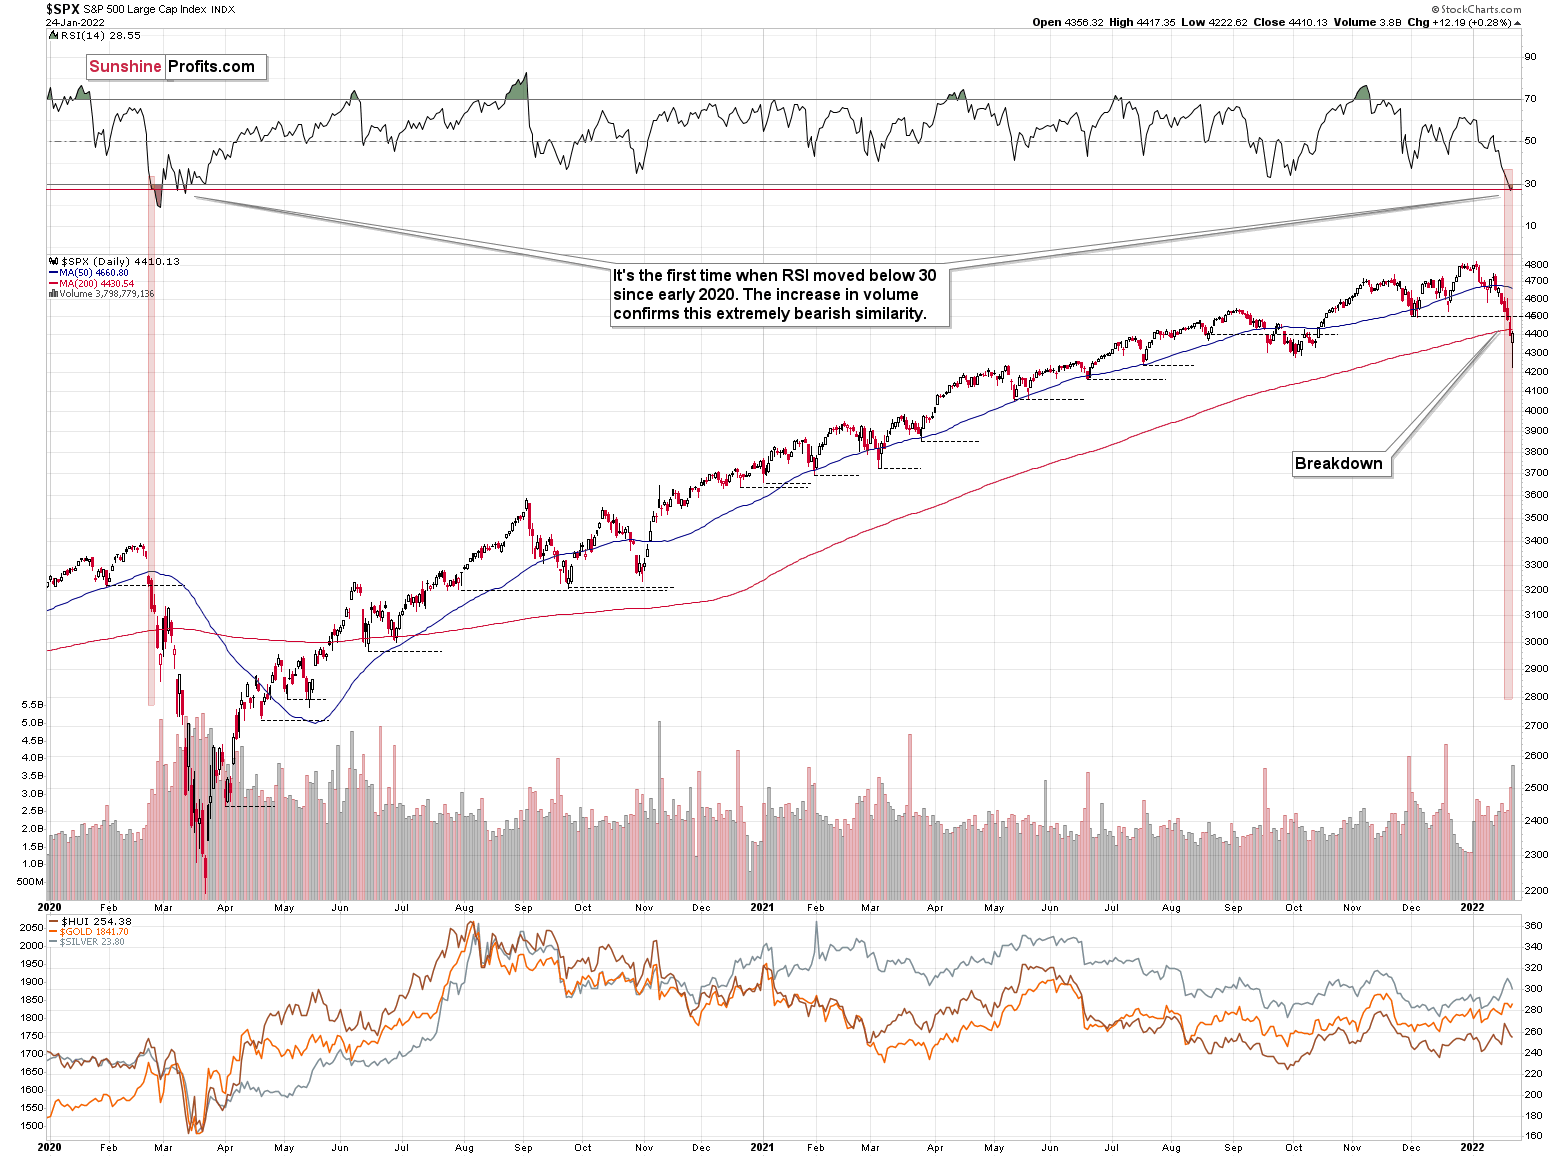
As I mentioned earlier, the S&P 500 declined and then rallied back up yesterday. The daily reversal took place on huge volume, which is bullish at its face value.
On the other hand, however, let’s keep in mind that the early-2020 decline had days of hesitation too. On Feb. 26, 2020, the S&P 500 also moved back and forth, closing only slightly lower. Declines resumed on the following day.
Looking at the RSI, we see that once this indicator moved below 30, it (and the S&P 500 itself) kept declining until it moved below 20. That’s not what happened yesterday.
Also, the initial decline in 2020 took the S&P 500 lower by over 15% before we saw a small corrective upswing. The 2022 decline took the S&P 500 down by a bit over 12%, including yesterday’s intraday low. If history repeats itself to a significant degree, we could see even lower stock market prices before seeing a more visible rebound.
On the other hand, seeing a rebound right away wouldn’t be likely to change anything – it seems that an even bigger, medium-term decline is already underway.
Yes, RSI below 30 is generally considered oversold territory, but the direct analogies take precedence over the “usual” way in which things work in markets in general. In this case, the situation could get from oversold to extremely oversold. Let’s keep in mind that stocks declined very sharply in 2020.
One could say that times were different, but were they really? The key difference is that the monetary authorities are now already after the bullish money-printing cycle and are handling inflation by aiming to increase interest rates, while they had been preparing to cut them in 2020.
The situation regarding the pandemic is not that different either. Sure, back in 2020, it was all new, we had massive lockdowns and there was great uncertainty regarding… pretty much everything. Now, the situation is not entirely unexpected, but given the explosive nature of new COVID-19 cases (likely due to the Omicron variant), it’s still quite new and uncertain.
The uncertainty is not as great as it was back in 2020, but then again, now we’re facing monetary tightening, not dramatic dovish actions. Thus, I wouldn’t exclude a situation in which we really see a repeat of the early-2020 performance, where the declines are sharp and huge. The technicals in the precious metals market have been pointing to that outcome for months, anyway, especially the long-term HUI Index chart that I’ve been discussing previously.
Thank you for reading our free analysis today. Please note that the above is just a small fraction of the full analyses that our subscribers enjoy on a regular basis. They include multiple premium details such as the interim targets for gold and mining stocks that could be reached in the next few weeks. We invite you to subscribe now and read today’s issue right away.
Sincerely,
Przemyslaw Radomski, CFA
Founder, Editor-in-chief -
Why Gold’s Latest Rally Is Nothing to Get Excited About
January 24, 2022, 8:17 AMYou don't have to be a fortune teller to predict some of the precious metals’ behavior in the market. Any incoming signs take the shape of a bear.
What a signal-rich week that was! At least if you’re interested in forecasting gold and predicting silver prices.
The USD Index rallied, but that was the least interesting of the important developments, as it had already reversed during the preceding week. So, the fact that the USD Index continued its medium-term uptrend last week is not that noteworthy.
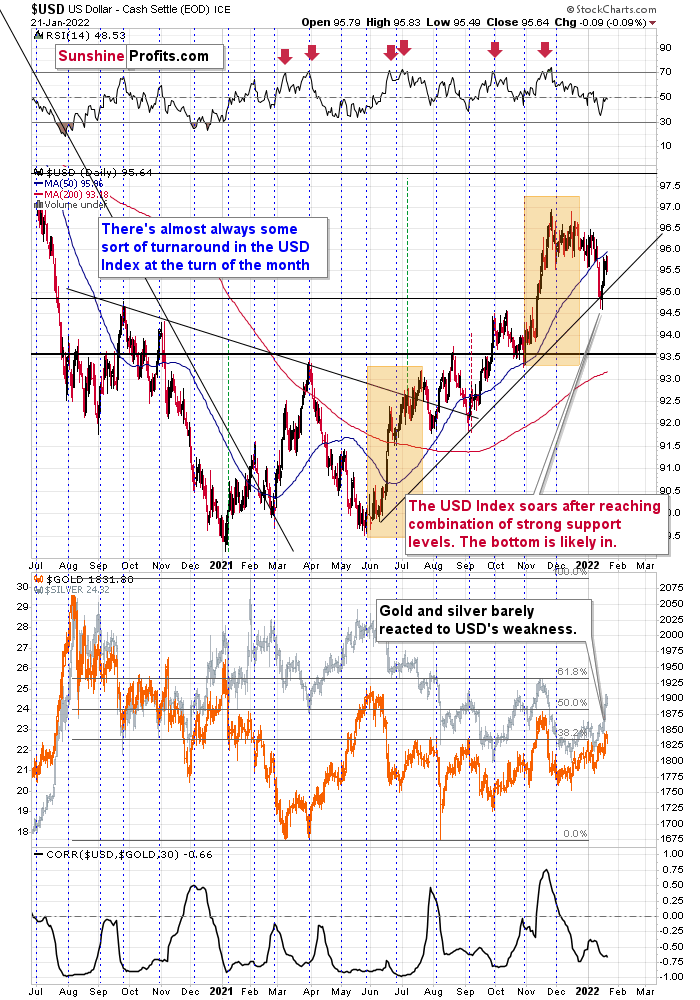
It needs to be said, though, as that continues to be an important factor for the future of the precious metals market. To be clear – the implications for the PM sector are bearish.
What about gold, the key precious metal?
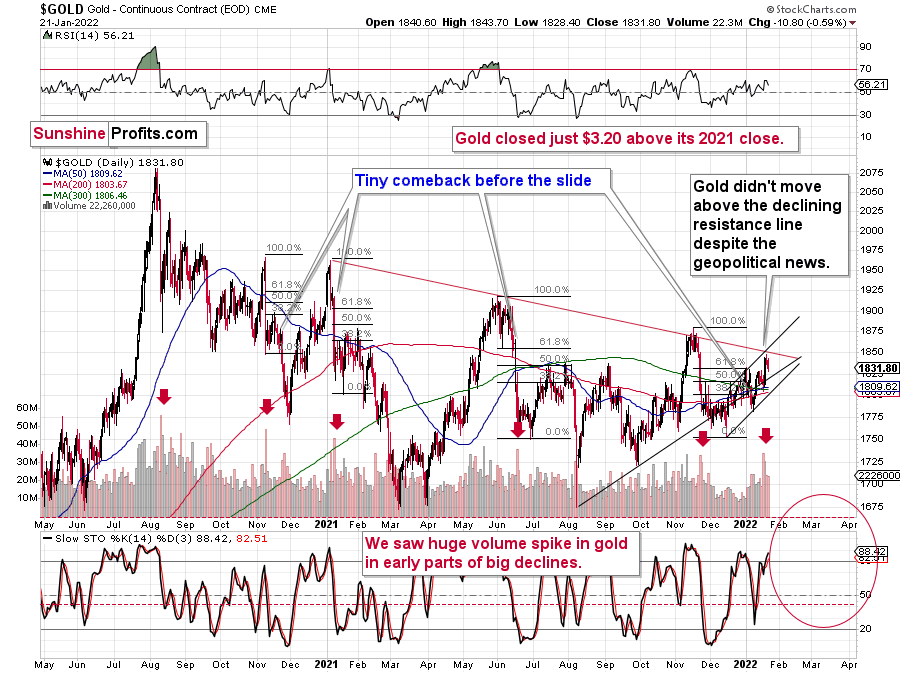
Gold is so far almost unchanged this year, despite the initial decline and the subsequent rally. Overall, gold is up by $3.20 so far in 2022, which is next to nothing.
Gold rallied on a supposedly dangerous situation regarding Ukraine, but it failed to rally above the combination of resistance lines and very little changed technically.
On a side note, I would like to remind you that, based on our own reliable source in Ukraine (one of our team members is located there), the risk of military conflict (in particular, a severe one) is low, and it seems that the market’s reaction was greatly exaggerated.
Anyway, moving back to technicals, let’s keep this $3.20-up-this-year statistic in mind while we take a look at what’s going on in silver and mining stocks.
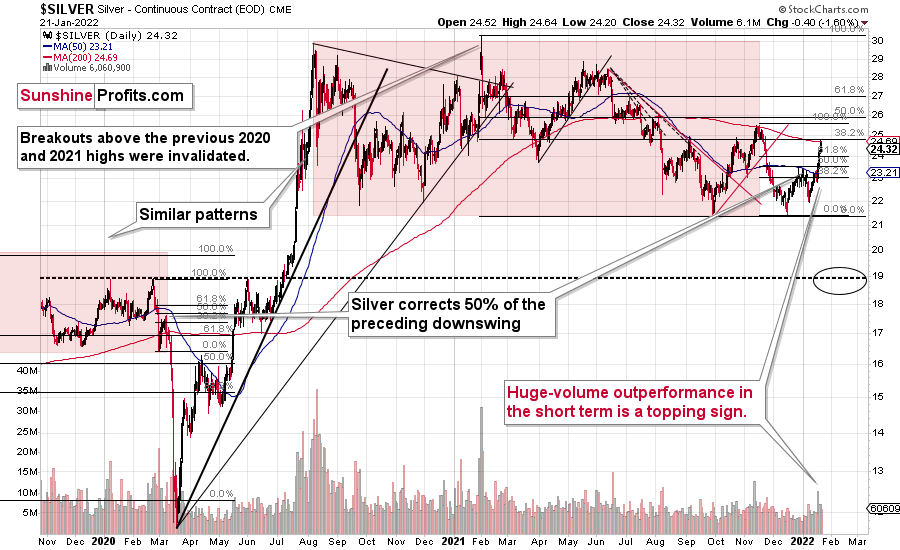
Silver declined on Friday, but it’s still up by $0.97 so far in 2022. This means that on a short-term basis, silver greatly outperformed gold.
What’s up with mining stocks?
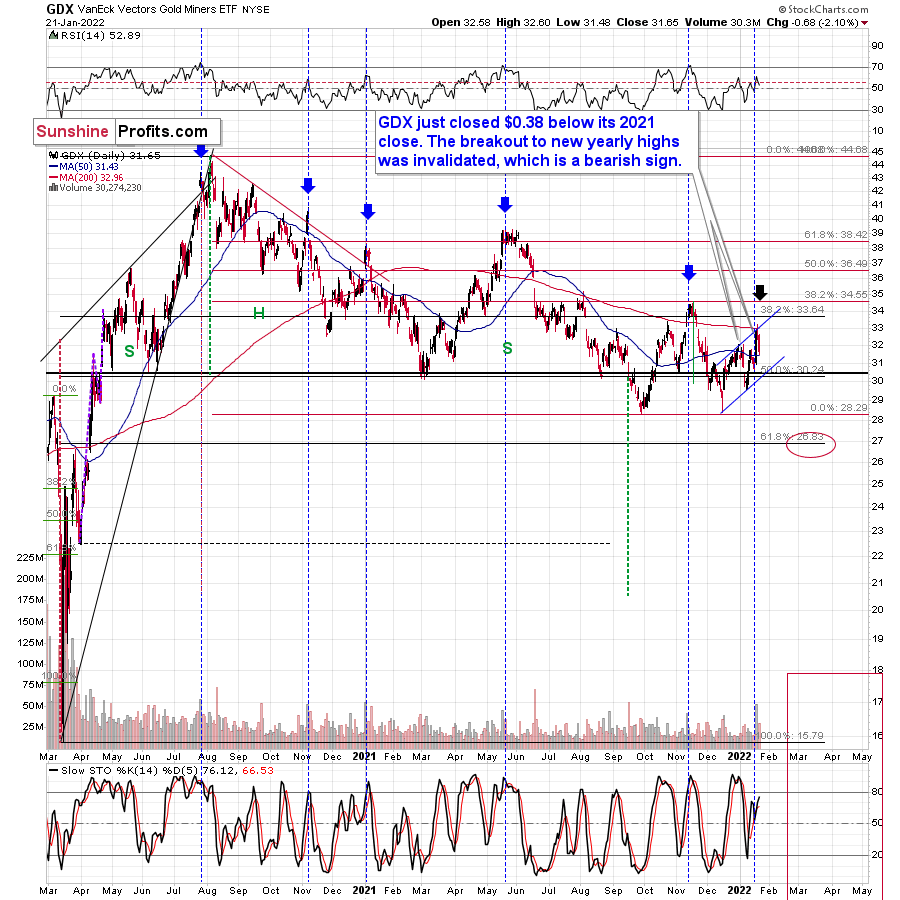
The GDX ETF – a proxy for generally senior mining stocks – is down this year by $0.38, which is 1.19%.
At the same time, the GDXJ ETF is down by $0.87, which is 2.07%.
In other words:
- While silver is outperforming gold on a short-term basis, gold mining stocks are underperforming it.
- Junior mining stocks (our short position) are declining more than senior miners, and in fact, they are declining the most out of the entire precious metals sector.
Silver’s outperformance, accompanied by gold miners weakness, is a powerful bearish combination in the case of the entire precious metals sector.
If the general stock market is going to slide, silver and mining stocks (in particular, junior mining stocks) are likely to decline in a rather extreme manner.
The thing is…
We just saw something in the general stock market that we haven’t seen since early 2020 – right before the massive decline that triggered the huge declines in the precious metals sector.

The RSI Index just moved below 30 for the first time since pre-slide moments. Just like what we saw back then, the S&P 500 is now declining on increasing volume.
Yes, RSI below 30 is generally considered oversold territory, but the direct analogies take precedence over the “usual” way in which things work in markets in general. In this case, the situation could get from oversold to extremely oversold. Let’s keep in mind that stocks declined very sharply in 2020.
One could say that times were different, but were they really? The key difference is that the monetary authorities are now already after the bullish money-printing cycle and are handling inflation by aiming to increase interest rates, while they had been preparing to cut them in 2020.
The situation regarding the pandemic is not that different either. Sure, back in 2020, it was all new, we had massive lockdowns and there was great uncertainty regarding… pretty much everything. Now, the situation is not entirely unexpected, but given the explosive nature of new COVID-19 cases (likely due to the Omicron variant), it’s still quite new and uncertain.
The uncertainty is not as great as it was back in 2020, but then again, now we’re facing monetary tightening, not dramatic dovish actions. Thus, I wouldn’t exclude a situation in which we really see a repeat of the early-2020 performance, where the declines are sharp and huge. The technicals in the precious metals market have been pointing to that outcome for months anyway, especially the long-term HUI Index chart that I’ve been discussing previously.
Thank you for reading our free analysis today. Please note that the above is just a small fraction of the full analyses that our subscribers enjoy on a regular basis. They include multiple premium details such as the interim targets for gold and mining stocks that could be reached in the next few weeks. We invite you to subscribe now and read today’s issue right away.
Sincerely,
Przemyslaw Radomski, CFA
Founder, Editor-in-chief -
Gold Is the Belle of the Ball. Will Its Dance Turn Bearish?
January 21, 2022, 9:38 AMThe precious metals still do pirouettes on the trading floor, but they can stumble in their choreography. The bears are just waiting for it.
With the GDX ETF soaring on significant volume on Jan. 19, the senior miners had a renewed pep in their step. With gold, silver, and mining stocks all dancing to the same beat, the precious metals garnered all of the bullish attention. However, with the trio known to cut their performances short as soon as investors arrive, will the mood music remain so sanguine?
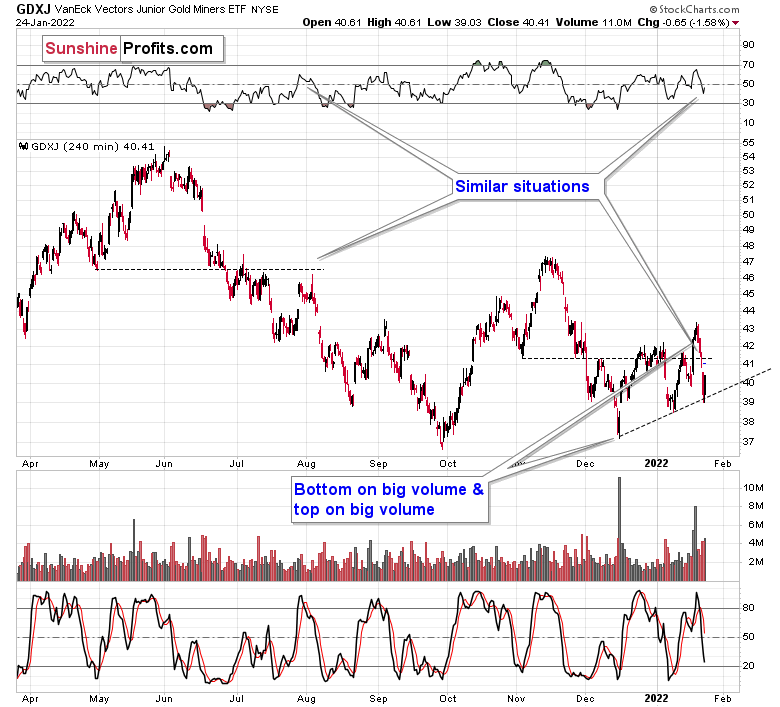
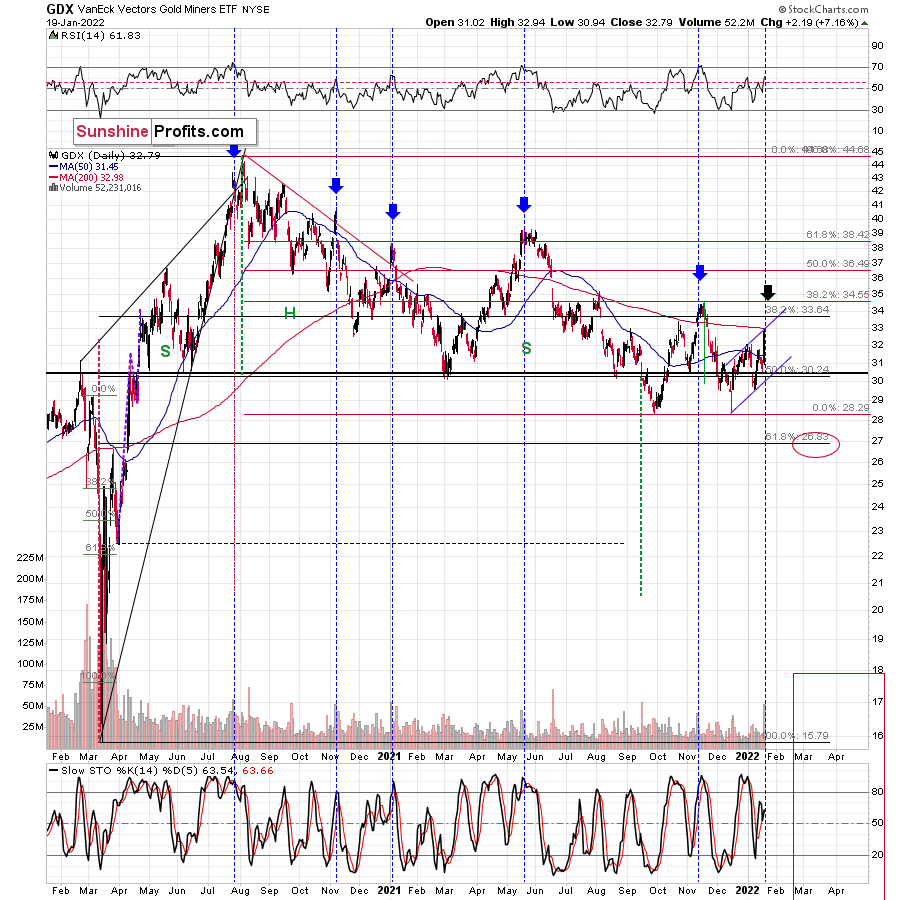
Well, for one, the GDX ETF has a history of peaking when the crowd enters the party. For example, I marked with the blue vertical dashed lines and blue arrows below how large daily spikes in volume often coincide with short-term peaks. Moreover, with another ominous event unfolding on Jan. 19, historical data implies that we’re much closer to the top than the bottom.
To explain, I wrote on Jan. 20:
From the technical point of view, we just saw another day similar to the other days that I marked with vertical dashed lines and black arrows. Those days were either right at the tops or not far from them. As much as yesterday’s (7%!) rally looks bullish, taking a look at the situation from a broad perspective provides us with the opposite – bearish – implications.
The zig-zag scenario is being realized as well. The GDX ETF moved to the upper border of the rising trend channel. Also, doesn’t it remind you of something? Hint: it happened at a similar time of the year.
Yes, the current price/volume action is similar to what we saw in early 2021. The RSI was above 60, a short-term rally that was preceded by a bigger decline, and a strong daily rally on huge volume at the end of the corrective rally. We’ve seen it all now, and we saw it in early 2021.
Please see below:
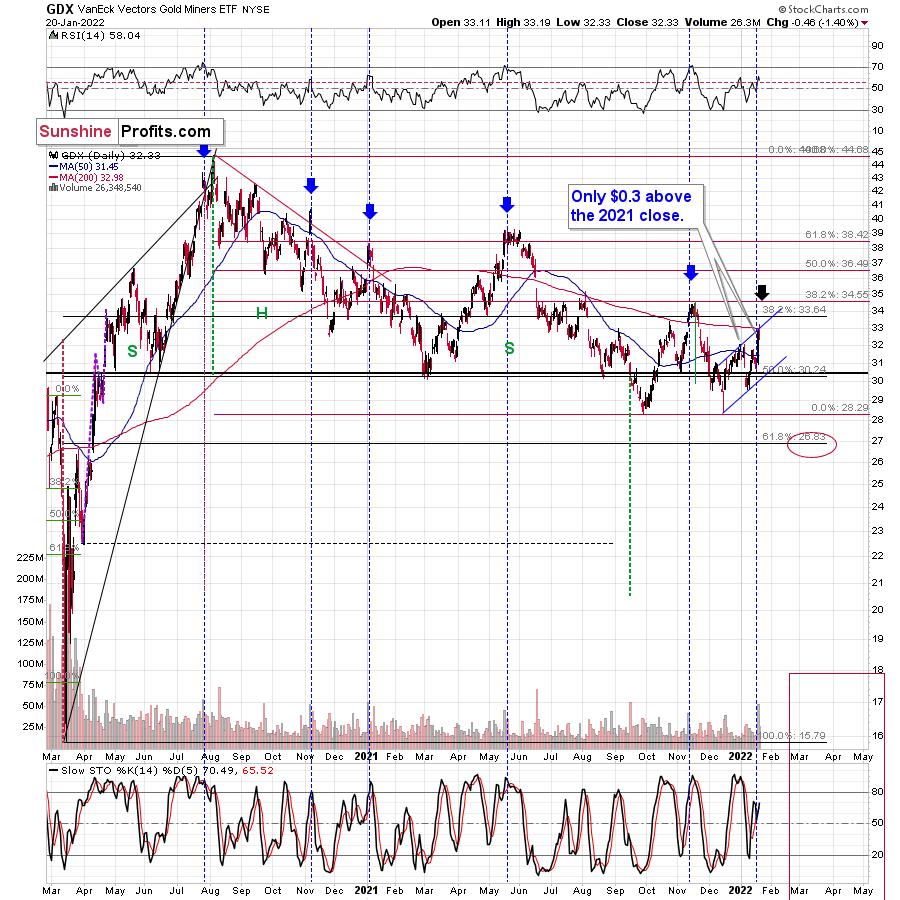
What’s more, the senior miners’ fatigue is already present. For example, the GDX ETF declined by 1.40% on Jan. 20, and the index ended the session only $0.30 above its 2021 close. Likewise, the senior miners failed to rally above the upper trendline of their ascending channel (drawn with the blue lines above). As a result, the price action resembles an ABC zigzag pattern, and while the short-term outlook is less certain, the medium-term outlook is profoundly bearish.
As further evidence, the HUI Index’s weekly chart provides some important clues. For example, despite the profound rally on Jan. 19, the index’s stochastic indicator still hasn’t recorded a buy signal. Moreover, the HUI Index dropped after reaching its 50-week moving average, and the ominous rejection mirrors 2013. Back then, the index approached its 50-week moving average, then suffered a pullback, and then suffered a monumental decline. As a result, is this time really different? Remember – history tends to rhyme, and this time the analogies from the past favor a bearish forecast for gold stocks.

Turning to the GDXJ ETF, the junior miners were off to the races on Jan. 19. However, the size of the rally is actually smaller than what we witnessed in early 2021. Moreover, when the short-term sugar high ended back then, optimism turned to pessimism and the GDXJ ETF sank to new lows. Thus, with the junior miners’ 2021 story one of lower highs and lower lows, 2022 will likely result in more of the same.
Please see below:
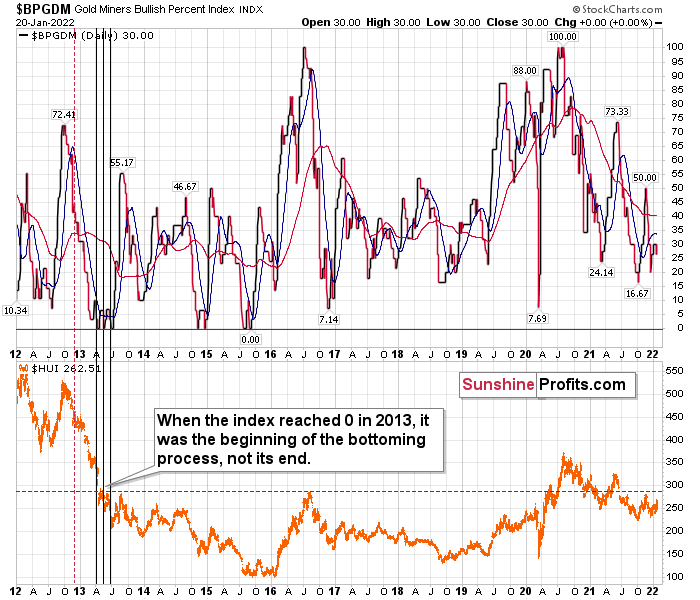
Finally, the Gold Miners Bullish Percent Index ($BPGDM) isn’t at levels that trigger a major reversal. The Index is now at 30. However, far from a medium-term bottom, the latest reading is still more than 20 points above the 2016 and 2020 lows.
Likewise, when the BPGDM hit 30 in 2013, the HUI Index was already in the midst of its medium-term downtrend (similar to what we witnessed in 2021). However, the milestone was far from the final low. With material weakness persisting and a lasting bottom not forming until the end of 2015/early 2016, further downside for gold (and silver) likely lies ahead.
For context, it’s my belief that the precious metals will bottom when the BPGDM hits zero – and perhaps when it remains there for some time.
In conclusion, gold, silver, and mining stocks put on quite a show on Jan. 19. However, with their bullish rhythm known to turn bearish in an instant, investors should proceed with caution. Moreover, the data shows that when investors rush to buy the precious metals, their over-enthusiasm results in medium-term weakness, not strength. As a result, the trio’s declines likely have more room to run before long-term buying opportunities emerge later in 2022.
Thank you for reading our free analysis today. Please note that the above is just a small fraction of the full analyses that our subscribers enjoy on a regular basis. They include multiple premium details such as the interim targets for gold and mining stocks that could be reached in the next few weeks. We invite you to subscribe now and read today’s issue right away.
Sincerely,
Przemyslaw Radomski, CFA
Founder, Editor-in-chief -
Fishy News Sparked a Gold Rally – Is a Bigger Surge Ahead?
January 20, 2022, 8:25 AMIn yesterday’s intraday Gold & Silver Trading Alert, I wrote the following:
Gold, silver, and mining stocks moved to new yearly highs in today’s trading, without any other major moves in the markets. So far, the session is only halfway completed, so quite a lot can still change. If we saw a decline in the second half of the session, the day would become a reversal, and it would be bearish. If we see the daily close in the GDX ETF at the current price levels, then… It will still not be bullish at this time (!).
Huge daily rallies on big volume (and it’s likely that today’s volume will prove to be big) in mining stocks (GDX) are what tends to take place at the end of a given short-term upswing or close to it. For example, we saw that on Nov. 10, 2021, Aug. 27, 2021, Jul. 29, 2021, and May 17, 2021.
Also, please note that zig-zag patterns are quite common form that corrections take place, at least in case of the mining stocks. Another way to call this pattern is an ABC pattern. The bottom that we saw in mid-December could have been the start of the A rally, then we saw the B decline in early January, and what we see now could be the C rally, and perhaps the final part thereof.
Still, most importantly, please keep in mind the examples when the big daily rallies on strong volume were good shorting, not buying opportunities. It’s rather unlikely that right now – AFTER the daily rally – we are at a favorable moment to go long or to close the short positions. It seems much more likely that we are in a situation where short positions are much more justified from the risk to reward point of view.
The reason I’m quoting this Alert is that it remains up-to-date. The GDX ETF ended the day visibly above the previous yearly highs, and the volume that accompanied yesterday’s sizable decline was indeed huge.
What does it mean? Well, it means that, from the technical point of view, we just saw another day similar to the other days that I marked with vertical dashed lines and black arrows. Those days were either right at the tops or not far from them. As much as yesterday’s (7%!) rally looks bullish, taking a look at the situation from a broad perspective provides us with the opposite – bearish – implications.
The zig-zag scenario is being realized as well. The GDX ETF moved to the upper border of the rising trend channel. Also, doesn’t it remind you of something? Hint: it happened at a similar time of the year.
Yes, the current price/volume action is similar to what we saw in early 2021. The RSI was above 60, a short-term rally that was preceded by a bigger decline, and a strong daily rally on huge volume at the end of the corrective rally. We’ve seen it all now, and we saw it in early 2021.
In the case of gold, we see something similar, but this time, the rally is visibly smaller.
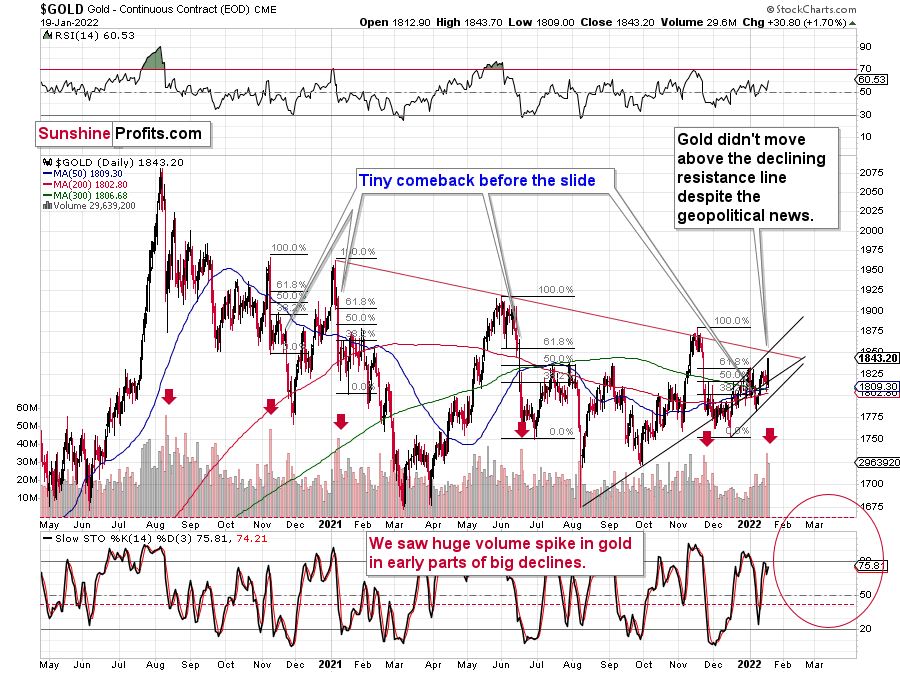
The volume is still significant, and the implications, theoretically, should be bearish. Here’s what I wrote on that yesterday:
The rally above the 2021 highs in bond yields might have come as a shock to many investors, and they might not have been sure how to react or what to make of it. It might also have been the “buy the rumor, sell the fact” type of reaction. Either way, it seems to me that we’ll have to wait a few days and see how it plays out once the dust settles.
The volume that we saw yesterday was huge. After a period of relatively average volume, we saw this huge volume spike. I marked the previous cases with red arrows. In those cases, such volume accompanied gold’s sizable declines. This time, the volume spike accompanied a $4.10 decline, which might appear perplexing.
Fortunately, gold is not the only market that we can analyze, and – as it’s often the case – context provides us with details that help to make sense of what really happened. Let’s check the key supplemental factor – silver’s price action.
Gold didn’t decline, but it moved higher instead. Why could that be?
Tensions around Ukraine have just supposedly escalated, which likely made people buy the precious metals (and mining stocks) as safe havens against possible geopolitical turmoil – against any possible annexations, war, and similar.
I put “supposedly” in bold because, in my opinion, that’s simply not true. It’s possible (everything is, right?), but just because something is possible, doesn’t make it likely.
In particular, in the case of the above-mentioned supposed “news” about greatly increased tensions, I don’t think that the safe-haven buying frenzy is justified. It’s not, and there are several good reasons for it.
Here are two articles on that:
https://www.theguardian.com/world/2022/jan/19/russia-could-act-against-ukraine-at-any-moment-says-us
https://www.bbc.com/news/world-europe-60048395
First of all, let’s consider the source of the information. The source was the White House, which is on the other side of the planet. It’s the very opposite of the “local source”, or a source that would not be biased by any agenda (here: political). It’s also the same source that provided misleading and/or unverified information many times in the past.
Remember when gold soared on the U.S.-based news that an Iranian ship attacked some other ship, “likely” leading to conflict? Nothing like that was confirmed by any other source. Remember Iraq’s weapons of mass destruction (before the U.S. invasion of that country) that were never found? I don’t mean to say that everything coming from the U.S. government and White House is “bad”. I’m saying that the information on which the market rallied is of relatively low quality when it comes to objectivity, and thus that market’s reaction was way too big, compared to what makes sense.
One of the article titles says “Russia could act against Ukraine ‘at any moment’, says US” and the other says “Ukraine tension: Blinken says Russia could attack at short notice”. Please note that while they both make it sound like it’s something “very likely” or that it’s likely to happen “soon”, the text actually says nothing like that. Just because Russia “could” attack, doesn’t mean that it’s likely. It could attack any day, and it could have attacked on any day in the past decades. If something is just 0.0000001% likely, then it’s still true that it “could” happen and both titles would be true. However, it doesn’t mean that acting on it is justified!
One of our Team Members is located in Ukraine (the source doesn’t get any more “local” and objective than this), and he had this to say about the current situation:
“I’m sure that Russia, with its current president Putin, will never take massive military action against Ukraine. If they wanted to do it, they could probably “capture” all of Ukraine in a matter of weeks, if not days. It would be a quick fix for the problem of uniting what has always been one country (Kiev, the ancient capital of Russia, and Kharkov, where I was born, had always been in one state with Moscow until thirty years ago).
However, such military action would create the ideologema of a “captured” Ukraine for future generations of Ukrainian nationalists, resulting in the obvious intent to liberate the “captured” state. It might also make countries that are currently friendly to Russia perceive it as an aggressor. Those are just a couple of the many reasons why it’s obvious to me that such military action is not going to happen any time soon.
The news/propaganda might be targeted toward forming the public opinion on joining Ukraine to NATO, painting the picture of “Russian aggression” or other social engineering purposes”.
Moreover, please note that what we’re discussing here is a geopolitical event, and such events are likely to have only a temporary impact on the precious metals prices. We wrote about that in our Dictionary section, and you’ll find more details there.
All in all, we saw a rally, but it’s unlikely to be the start of a bigger rally. Instead, it’s likely that what we saw was either the final part of the corrective upswing that started in mid-December, 2021, or it’s close to the final part of the corrective upswing. Either way, I think that the short position in the junior mining stocks remains justified from the risk-to-reward point of view.
Thank you for reading our free analysis today. Please note that the above is just a small fraction of the full analyses that our subscribers enjoy on a regular basis. They include multiple premium details such as the interim targets for gold and mining stocks that could be reached in the next few weeks. We invite you to subscribe now and read today’s issue right away.
Sincerely,
Przemyslaw Radomski, CFA
Founder, Editor-in-chief


Gold Investment News
Delivered To Your Inbox
Free Of Charge
Bonus: A week of free access to Gold & Silver StockPickers.
Gold Alerts
More-
Status
New 2024 Lows in Miners, New Highs in The USD Index
January 17, 2024, 12:19 PM -
Status
Soaring USD is SO Unsurprising – And SO Full of Implications
January 16, 2024, 8:40 AM -
Status
Rare Opportunity in Rare Earth Minerals?
January 15, 2024, 2:06 PM

