
Briefly: In our opinion no speculative short positions in gold, silver and mining stocks are currently justified from the risk/reward perspective.
In the past days we wrote that if gold managed to disconnect itself from the USD Index, then the situation would become very bearish for gold as a possible top in the USD Index would not be a threat to gold’s decline. Yesterday, gold and especially silver and miners declined significantly without visible action in the USD Index. Is this “the sign”?
Our best answer to this question is “almost”. Let’s take a look why, starting with the USD Index (charts courtesy of http://stockcharts.com).
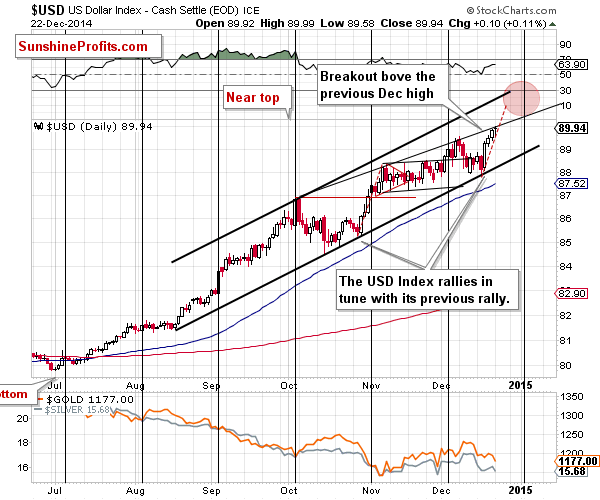
The USD Index barely moved yesterday and since we didn’t see any declines, it seems that the breakout above the previous December high is confirmed. It generally moved only as much as the rising short-term resistance line allowed it to. Since it remains on this line, our previous comments that were based on such a situation remain up-to-date:
In Friday’s alert we wrote that the “problem” with the breakout was that it was very small. It’s now much more visible and confirmed and it seems that we can already expect higher values in the USD Index in the coming weeks. Will gold decline? Probably yes – and we have already seen a first sign of that taking place.
However, keeping in mind that the USD Index rallied on Friday, it seems that Monday’s decline in gold was not really something that happened without the dollar’s influence. It’s more likely that gold’s reaction was simply delayed and we can view it as a response to the USD’s Friday rally.
Consequently, while gold’s decline is bearish, it’s not extremely bearish just yet – it doesn’t signal the above-mentioned disconnection just yet.
Before moving to the analysis of gold, let’s take a look at the situation in the USD Index from the very long-term perspective.
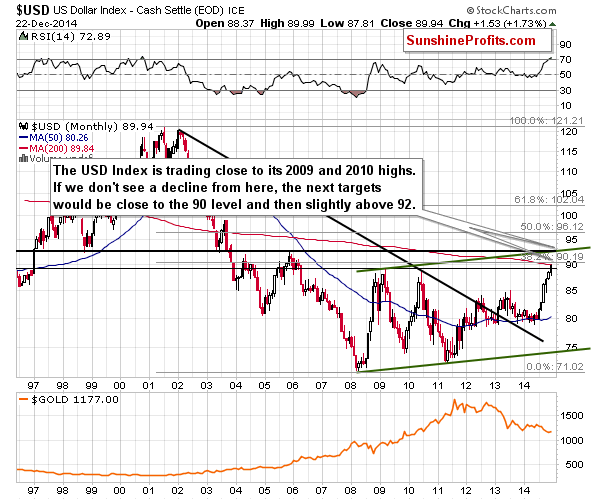
The USD Index has just one more major resistance to surpass before a rally to 92 becomes very probable – the 90.19 level, which is the 38.2% Fibonacci retracement levels based on the entire 2002 – 2008 decline.
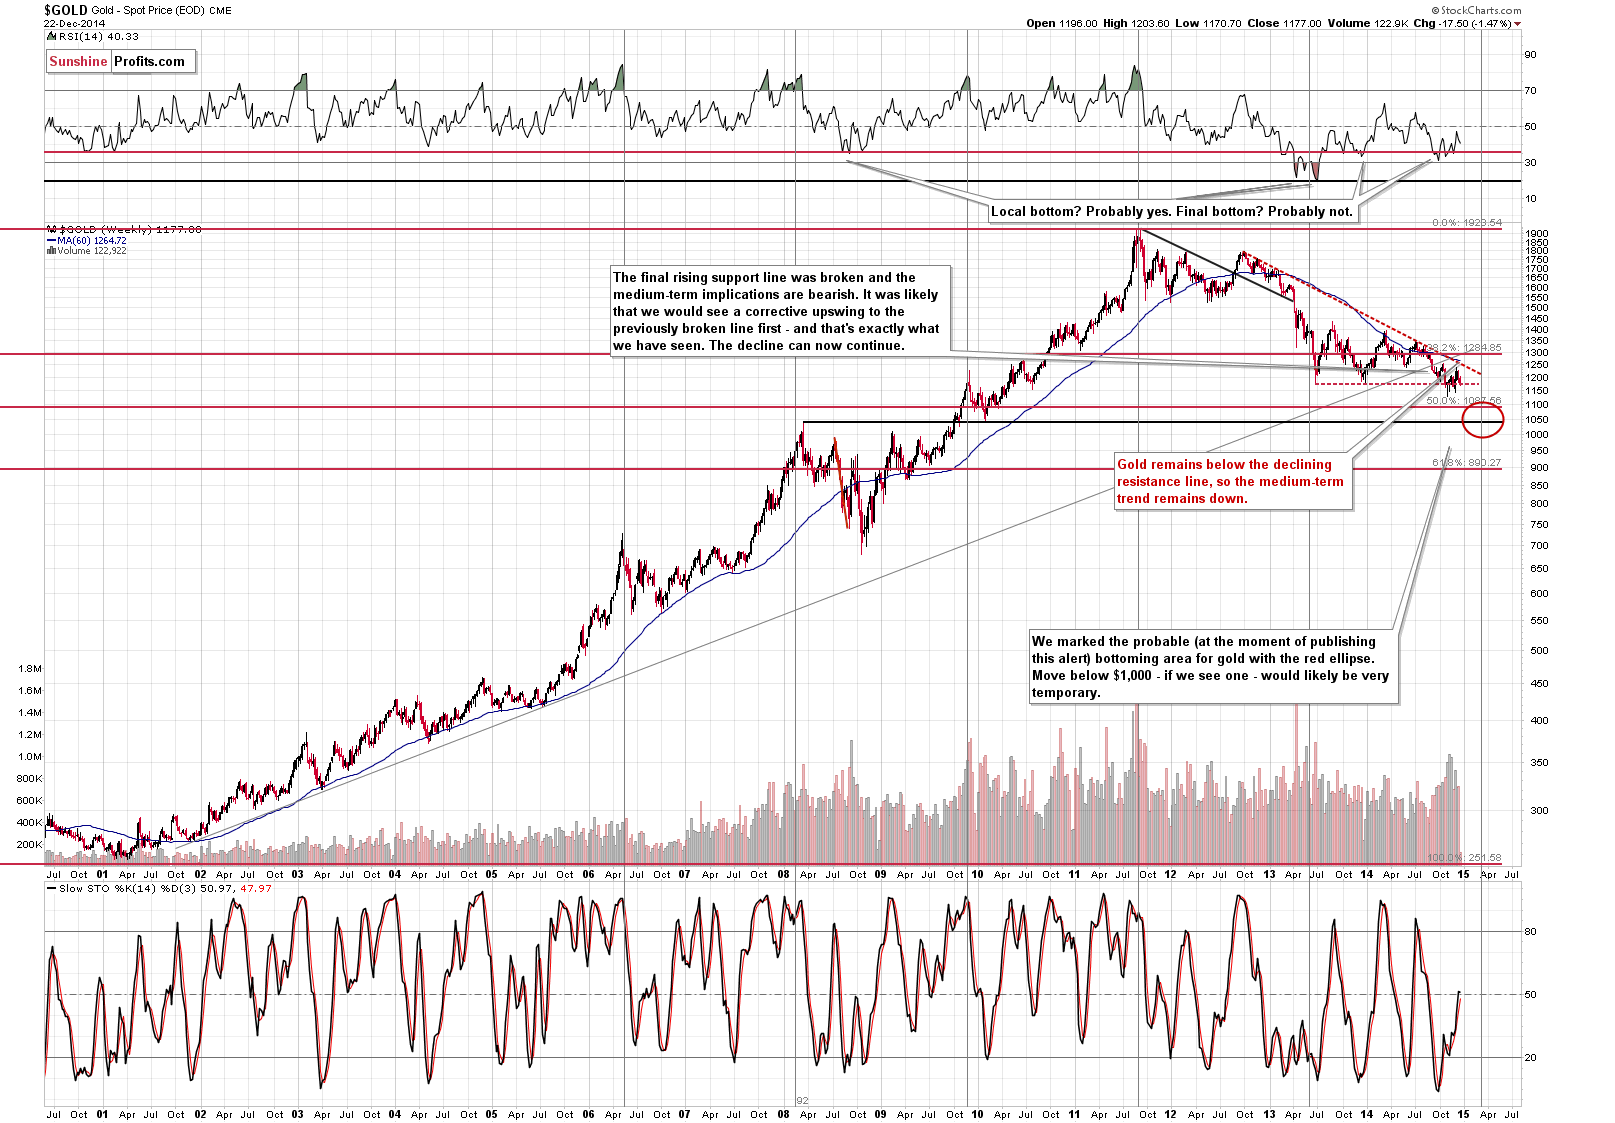
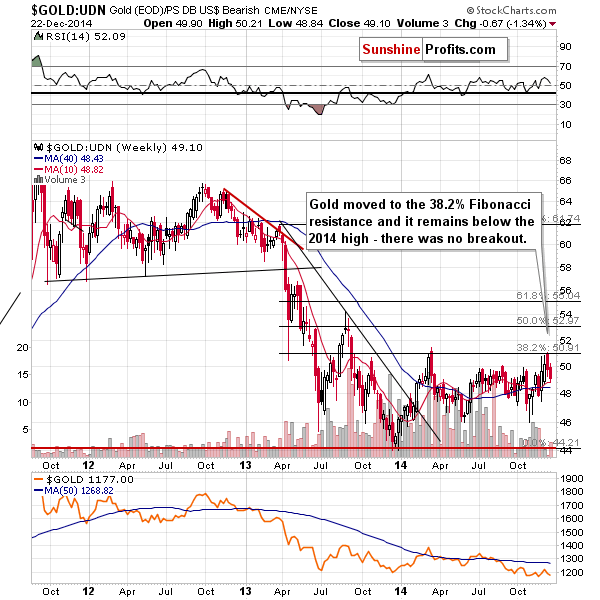
As far as gold itself is concerned, nothing changed from the medium-term perspective, so our previous comments remain up-to-date:
Let’s keep in mind that gold remains in a medium-term downtrend and could move even higher in the short term (to $1,250 or so) and still remain in it. In other words, another short-term rally here would not invalidate the bearish medium-term outlook.
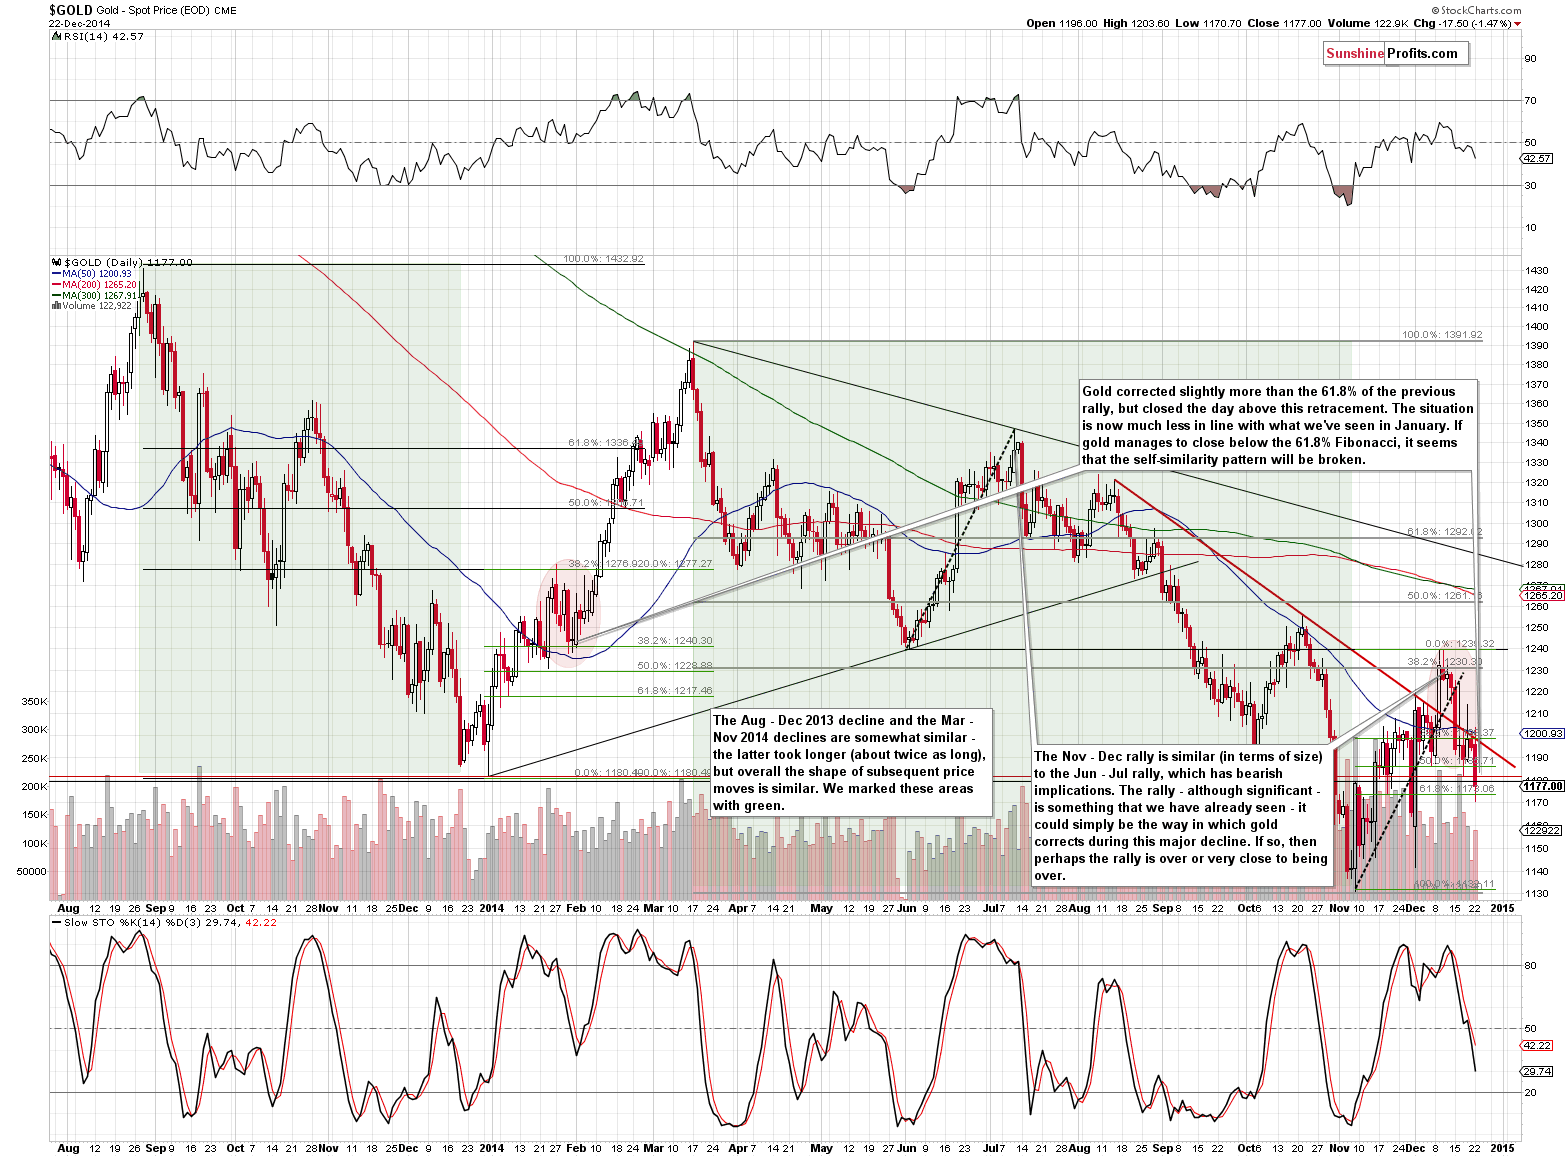
The above chart clearly shows gold’s yesterday’s decline and the levels that were reached. Gold moved initially below the 61.8% Fibonacci retracement level, but moved back above it before the session ended.
We previously wrote the following:
The price of the yellow metal declined slightly below the 38.2% Fibonacci retracement level based on the short-term rally. This is more or less where gold corrected in late January 2014 before rallying quite sharply. Since the previous declines (marked with green) were similar in terms of shape, we could see a similar rally also here, if this self-similarity pattern continues.
The more important implication of yesterday’s decline is that the current situation is no longer very similar to what happened in January – back then gold didn’t decline as much after the preceding rally. It only declined to the first Fibonacci retracement, but not to the final of the classic ones. However, history doesn’t have to repeat itself to the letter, so we could still see a rally soon based on the above-mentioned self-similar pattern. The probability for the rally is now smaller so the situation deteriorated.
The less important implication is that without a move below the 61.8% Fibonacci retracement, the very recent decline could still be a correction of the Nov – Dec rally. In other words, technically, the situation has not yet become really bearish here.
The situation in the gold market seen from the non-USD perspective deteriorated a bit, but our previous comments remain up-to-date:
Gold seen from the non-USD perspective declined after moving to the 38.2% Fibonacci retracement level, which means that so far the recent run-up is nothing more than a correction after a big decline. The implications here are bearish.

The silver market declined visibly and it seems that the previous run-up was nothing more than a correction to the previously broken rising resistance line. The breakdown was verified and the medium-term implications are bearish. It’s one of the things that justify staying out of the market with the long-term investment capital in our view.
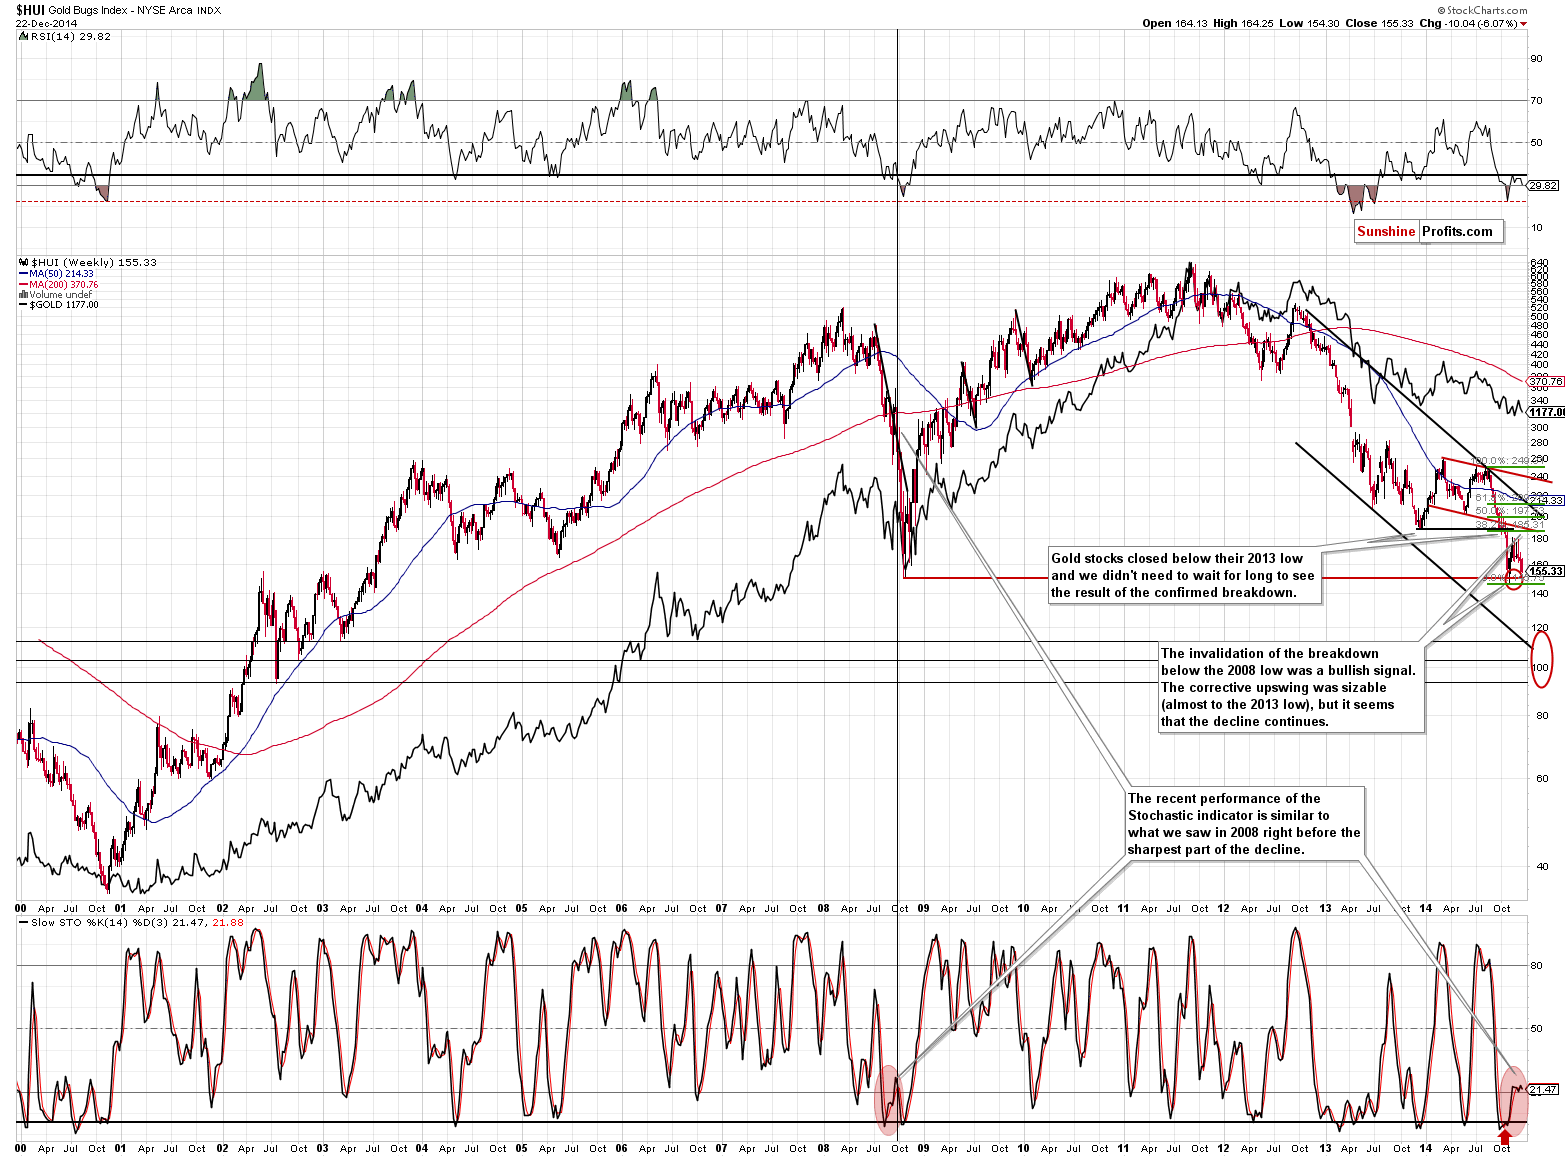
Gold stocks declined visibly and are now very close to their 2008 and 2014 lows. The recent decline is something that makes the current situation look much different than what we saw in January. Back then gold stocks held up very well during the correction in gold. Right now gold stocks are leading gold lower.
We saw another interesting – and bearish – development in gold stocks. The Stochastic indicator recently moved above the 20 level and declined once again. For now the sell signal is insignificant, but it’s important that we have seen it, as it was something that we had seen in 2008 after the mid-decline consolidation and right before the sharpest part of the decline.
At this time the decline is taking place at a slower pace, so we may have more than just several days before the slide accelerates, but it seems much more likely.
Moreover, please note that the upward correction that we saw several weeks ago didn’t take gold stocks above the 38.2% Fibonacci retracement, which means that the mining stocks sector is rather weak.
Additionally, it’s important to note that gold stocks declined yesterday despite a move higher in the main stock indices. Miners had a good reason to hold up relatively well – and they underperformed gold instead. This is another bearish sign.
Before summarizing, let’s take a look at the situation in the bond market. It didn’t change, but it’s important to keep it in mind, so we are brining it to your attention once again.
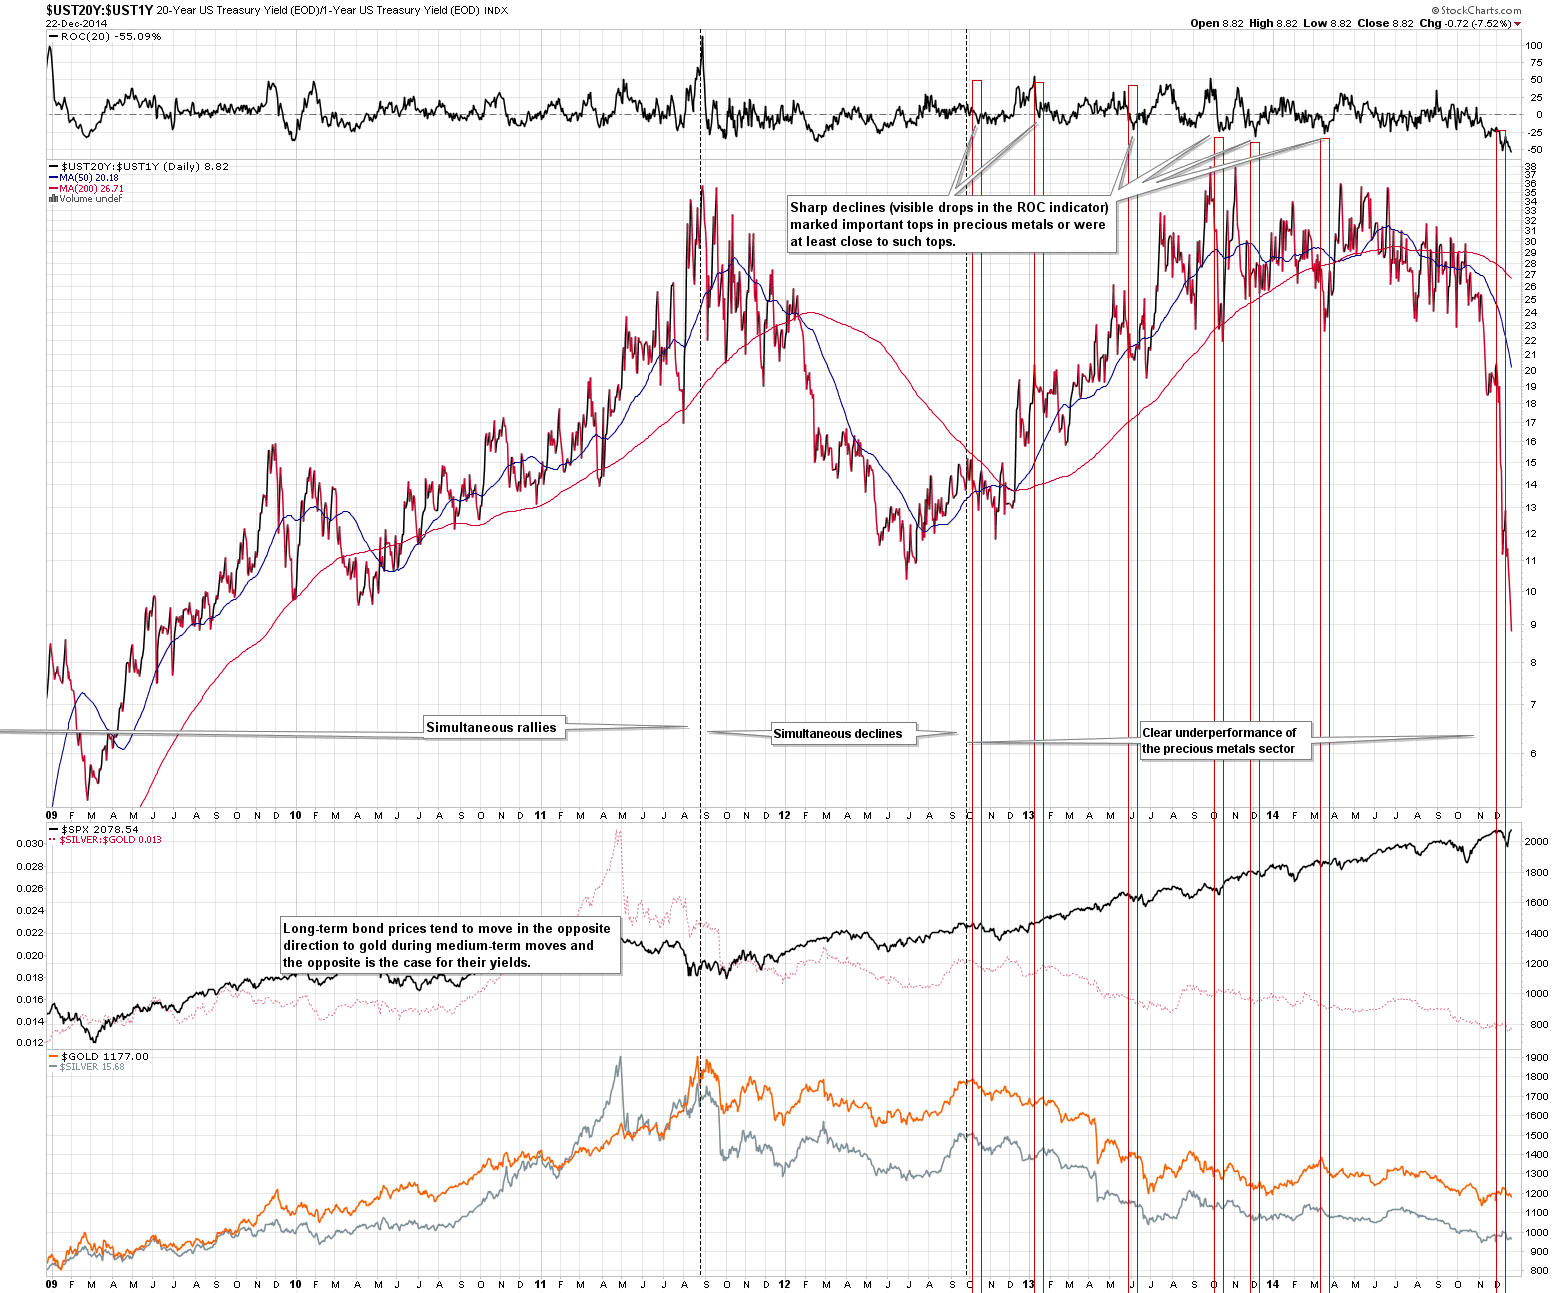
Our previous comments on the above picture remain up-to-date and so are the implications for the precious metals market:
Sharp declines in the yields of 20-year bonds relative to the yields of 1-year bonds are something that marked or preceded important tops in the precious metals market. The slide in the value of the ratio that we have just seen was enormous, which is a significant bearish signal for the precious metals market.
We just saw another slide in the ratio (both yesterday and on Friday), which makes the bearish implications even more bearish.
Summing up, the situation in the precious metals market deteriorated based on yesterday’s decline, but since there was no confirmation of the disconnection between gold and the USD Index, we need to keep the situation in the USD Index in mind. The USD Index could form a local top relatively soon – at 90.12 or so (38.2% Fibonacci retracement level of the entire 2002 – 2008 decline). With a threat of a decline in the USD Index not far away (which would likely have bullish implications for the precious metals market) and a combination of bearish factors seen in the precious metals market and the bond market, it seems that the overall short-term picture is still too unclear to open speculative short positions.
If we see a confirmed breakout above the 90.12 level in the USD Index or a confirmation that gold can decline independently from the U.S. dollar’s decline, we might consider opening short positions in gold, silver and mining stocks, but in our opinion it’s too soon to do so at this time.
With gold stocks being very close to their 2008 and 2014 lows and silver close to $15, it’s certainly good to be out of the market with the long-term investments in this sector – something that we have been writing about for many months now. It seems that we will see much lower prices for precious metals in the coming weeks or months regardless of the short-term developments.
It seems that another trading opportunity is just around the corner and even though not much seems to be going on, it might be that paying close attention to the precious metals market at this time and in the coming days will be well worth it. We will be monitoring the market and we’ll keep you – our subscribers - informed.
To summarize:
Trading capital (our opinion): No positions
Long-term capital (our opinion): No positions
Insurance capital (our opinion): Full position
Please note that a full position doesn’t mean using all of the capital for a given trade. You will find details on our thoughts on gold portfolio structuring in the Key Insights section on our website.
As a reminder – “initial target price” means exactly that – an “initial” one, it’s not a price level at which we suggest closing positions. If this becomes the case (like it did in the previous trade) we will refer to these levels as levels of exit orders (exactly as we’ve done previously). Stop-loss levels, however, are naturally not “initial”, but something that, in our opinion, might be entered as an order.
Since it is impossible to synchronize target prices and stop-loss levels for all the ETFs and ETNs with the main markets that we provide these levels for (gold, silver and mining stocks – the GDX ETF), the stop-loss levels and target prices for other ETNs and ETF (among other: UGLD, DGLD, USLV, DSLV, NUGT, DUST, JNUG, JDST) are provided as supplementary, and not as “final”. This means that if a stop-loss or a target level is reached for any of the “additional instruments” (DGLD for instance), but not for the “main instrument” (gold in this case), we will view positions in both gold and DGLD as still open and the stop-loss for DGLD would have to be moved lower. On the other hand, if gold moves to a stop-loss level but DGLD doesn’t, then we will view both positions (in gold and DGLD) as closed. In other words, since it’s not possible to be 100% certain that each related instrument moves to a given level when the underlying instrument does, we can’t provide levels that would be binding. The levels that we do provide are our best estimate of the levels that will correspond to the levels in the underlying assets, but it will be the underlying assets that one will need to focus on regarding the sings pointing to closing a given position or keeping it open. We might adjust the levels in the “additional instruments” without adjusting the levels in the “main instruments”, which will simply mean that we have improved our estimation of these levels, not that we changed our outlook on the markets. We are already working on a tool that would update these levels on a daily basis for the most popular ETFs, ETNs and individual mining stocks.
Our preferred ways to invest in and to trade gold along with the reasoning can be found in the how to buy gold section. Additionally, our preferred ETFs and ETNs can be found in our Gold & Silver ETF Ranking.
As always, we'll keep you - our subscribers - updated should our views on the market change. We will continue to send out Gold & Silver Trading Alerts on each trading day and we will send additional Alerts whenever appropriate.
The trading position presented above is the netted version of positions based on subjective signals (opinion) from your Editor, and the automated tools (SP Indicators and the upcoming self-similarity-based tool).
As a reminder, Gold & Silver Trading Alerts are posted before or on each trading day (we usually post them before the opening bell, but we don't promise doing that each day). If there's anything urgent, we will send you an additional small alert before posting the main one.
=====
Latest Free Trading Alerts:
We saw yet another day of appreciation yesterday. The move up was also on volume higher than on the day before. Does this mean that the short-term picture is now bullish?
Bitcoin Trading Alert: Important Developments Possibly Not Far Away
=====
Hand-picked precious-metals-related links:
Cheap Oil Is Dragging Down the Price of Gold
Ukraine Cuts Gold Reserve to Nine-Year Low as Russia Buys
=====
In other news:
Saudi Arabia: We'll never cut oil production
Ukrainian parliament angers Moscow by scrapping 'non-aligned' status
Could Russia back its currency with gold?
=====
Thank you.
Sincerely,
Przemyslaw Radomski, CFA
Founder, Editor-in-chief
Gold & Silver Trading Alerts
Forex Trading Alerts
Oil Investment Updates
Oil Trading Alerts
P.S. On an administrative note, there will be no alerts on Thursday (Dec. 25) and Friday (Dec. 26) this week. We will start posting them again on Monday, Dec. 29.

