
Briefly: In our opinion no speculative short positions in gold, silver and mining stocks are currently justified from the risk/reward perspective.
As you know, the USD Index is one of the things that are very important in determining gold’s short-term direction – perhaps even the most important one. USD has just closed above the previous December high and is now at the highest levels since 2006. Will the U.S. dollar’s breakout translate into a breakdown in gold?
Unfortunately (because if it was otherwise, we would have a good trading opportunity) it’s too early to say that this will indeed be the case. Gold is quite far from its 2014 low and it has yet to prove its ability to move down regardless of the U.S. dollar’s price swings. Let’s take a look at the breakout (charts courtesy of http://stockcharts.com).
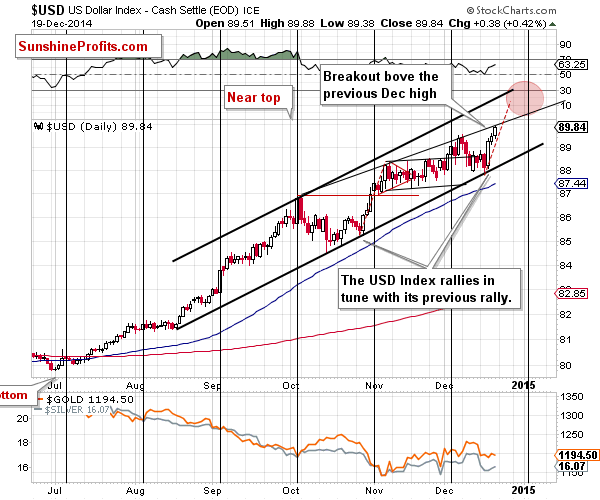
In Friday’s alert we wrote that the “problem” with the breakout was that it was very small. It’s now much more visible and it seems that we can already expect higher values in the USD Index in the coming weeks. Will gold decline? Probably yes – eventually – but at this time the gold market is not breaking lower.
It’s not confirmed and thus we can’t really discuss its implications at this time. While the move itself is a positive sign, it’s not very important at this time. Perhaps traders and investors are waiting for the USD to break out above the 90 level, in order to push the sell button on their gold positions.
Our comments from Wednesday’s Forex Trading Alert remain up-to-date:
Please note that the November – early December period could be viewed as a rising form of consolidation. The rally didn’t end and there was no big correction after the late-October rally. Instead, we saw USD Index trading sideways. Keeping the above in mind, one can expect the move that is about to take place – after the end of the consolidation – to be rather similar to the move that preceded it. This means that we could see the USD Index a few index point higher relatively soon. The long-term chart tells us that the next strong resistance is close to 92, so this is where the next stop or pause or top could be seen.
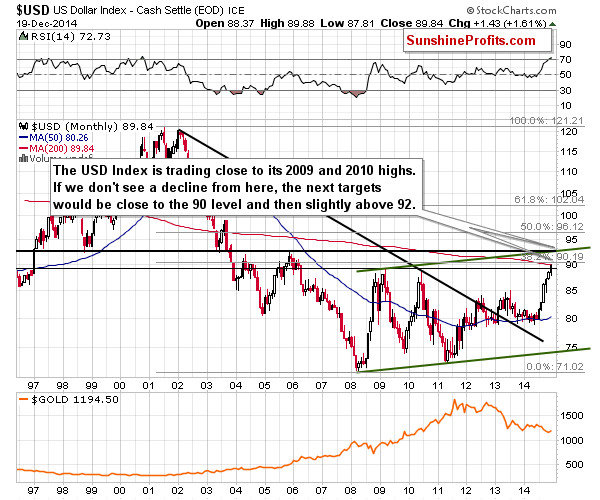
While the USD Index moved indeed higher, it has yet to break out above the previous highs and the 90 level before 92 becomes a very probable target.
If the USD Index breaks above 90 and gold breaks significantly lower, we will most likely see a bigger decline in gold in the days that would follow. For now, without a breakout in the USD above 90, it’s too early to discuss such implications.
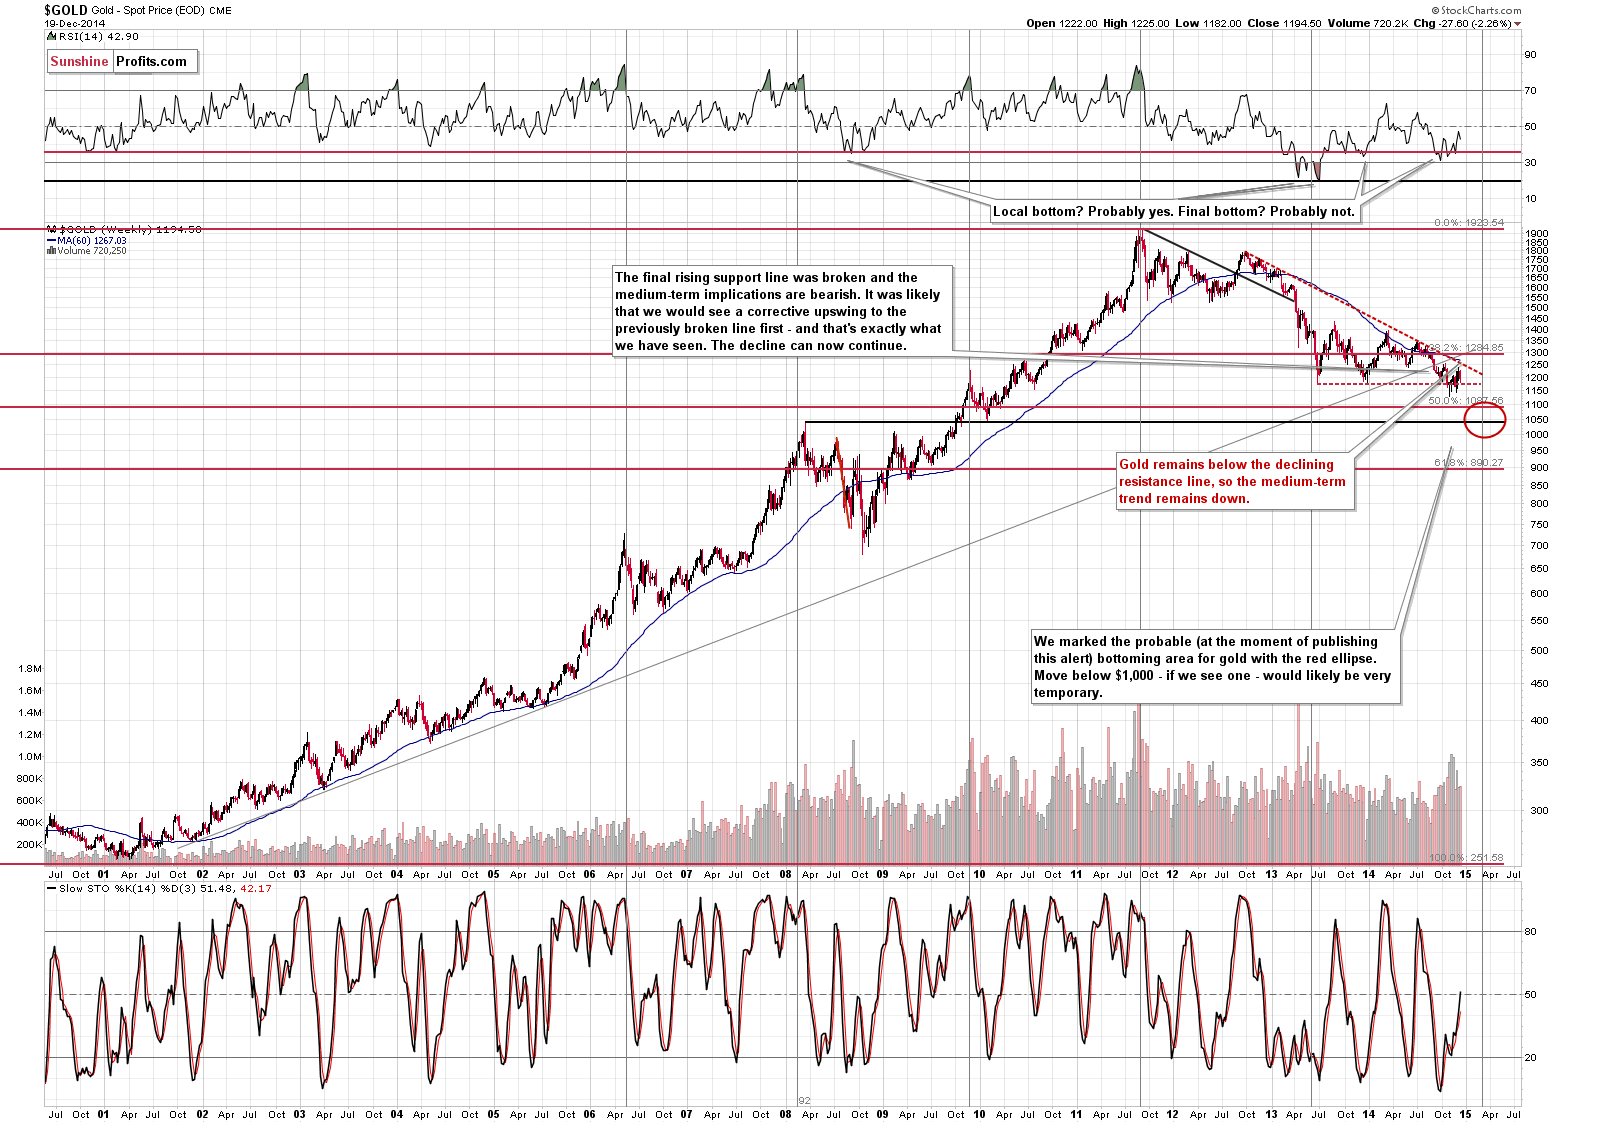
As far as gold itself is concerned, nothing changed from the medium-term perspective, so our previous comments remain up-to-date:
Let’s keep in mind that gold remains in a medium-term downtrend and could move even higher in the short term (to $1,250 or so) and still remain in it. In other words, another short-term rally here would not invalidate the bearish medium-term outlook.
Gold moved lower on very low volume on Friday, which is a small bullish sign for the short term. The yellow metal also moved only a little lower on Friday while the USD Index moved visibly higher, which is another small bullish sign for the short term.
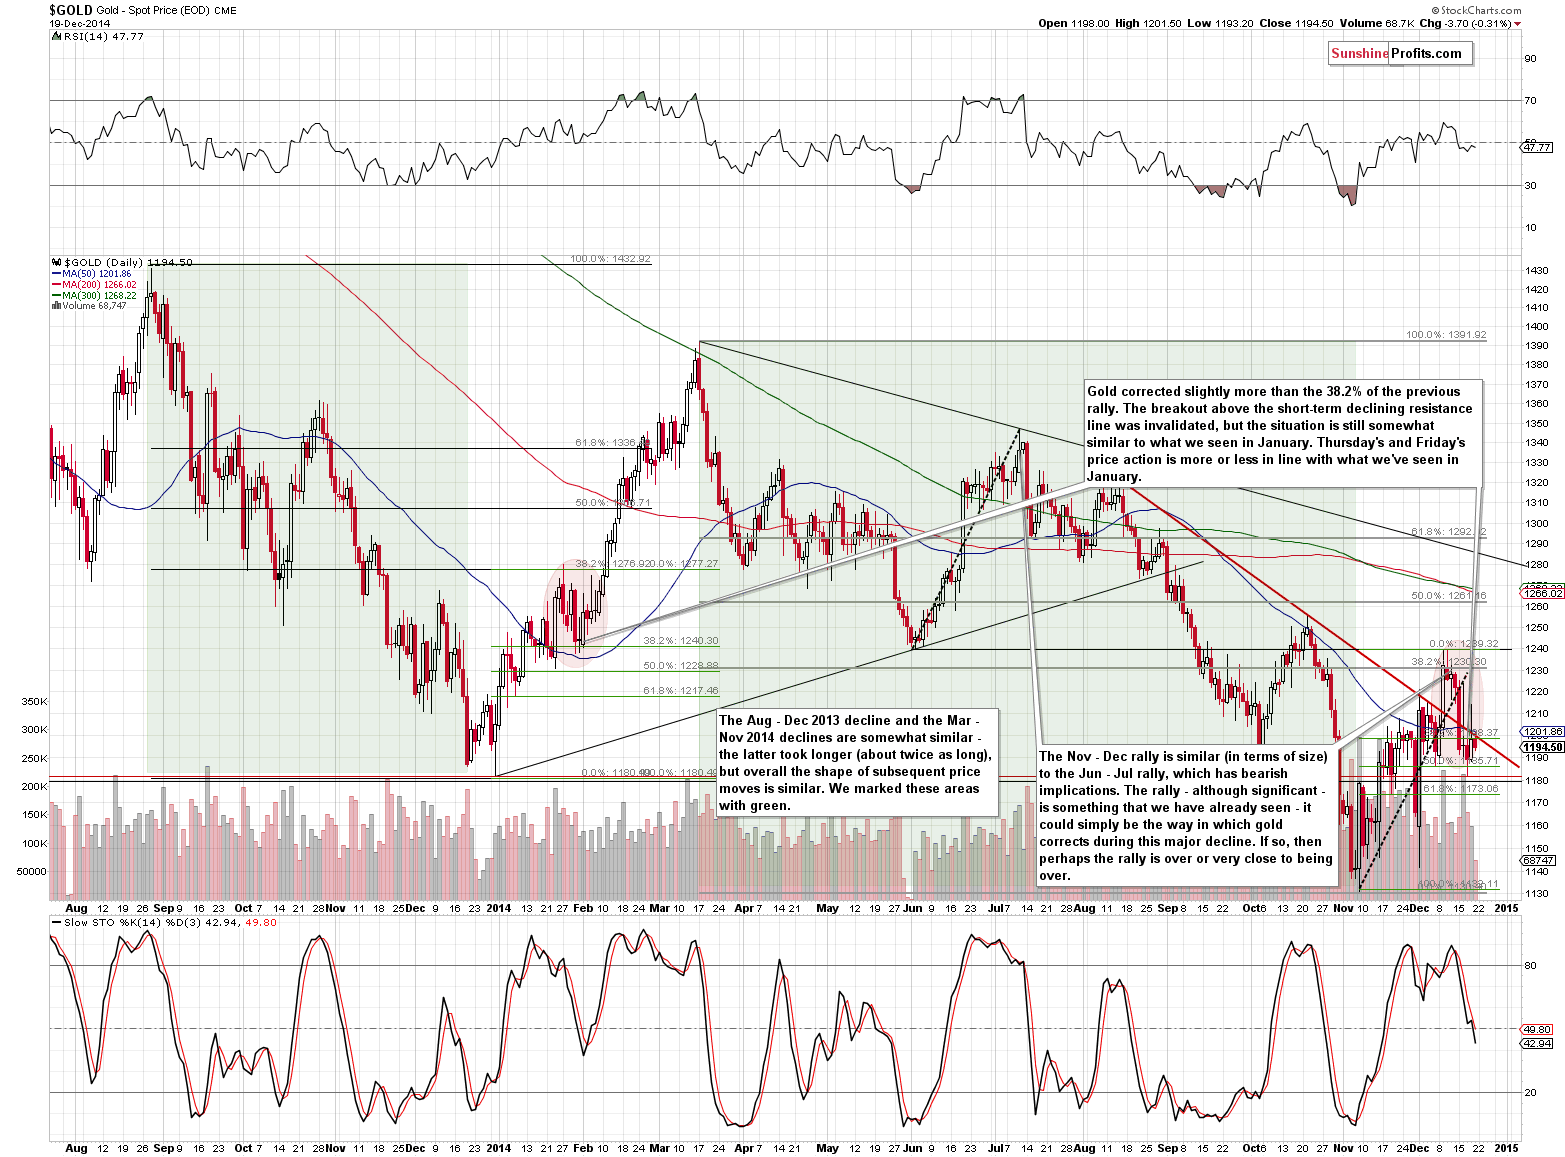
Other than that, the short-term situation remains unchanged and our previous comments are still up-to-date:
The price of the yellow metal declined slightly below the 38.2% Fibonacci retracement level based on the short-term rally. This is more or less where gold corrected in late January 2014 before rallying quite sharply. Since the previous declines (marked with green) were similar in terms of shape, we could see a similar rally also here, if this self-similarity pattern continues.
With the medium-term being down, the gold-USD link being unclear and with some bullish signs in the gold market, the situation is simply too unclear at this time as far as the short term is concerned to open any speculative positions in our view.
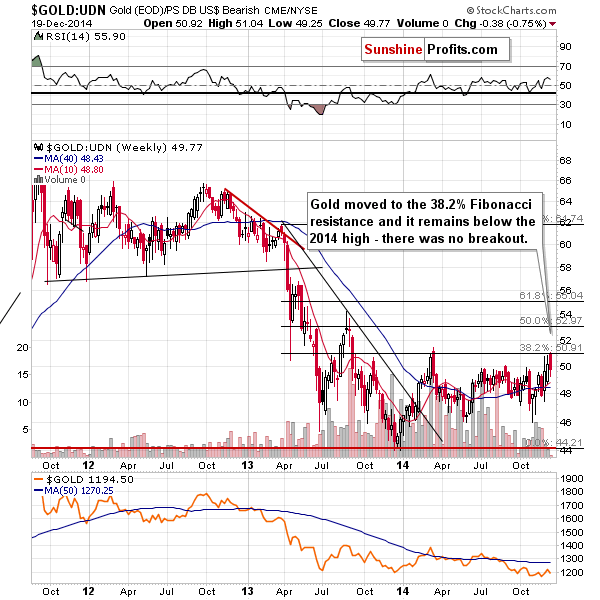
Gold seen from the non-USD perspective declined after moving to the 38.2% Fibonacci retracement level, which means that so far the recent run-up is nothing more than a correction after a big decline. The implications here are bearish, which adds to the overall lack of clarity in the gold market as far as the short-term outlook is concerned.
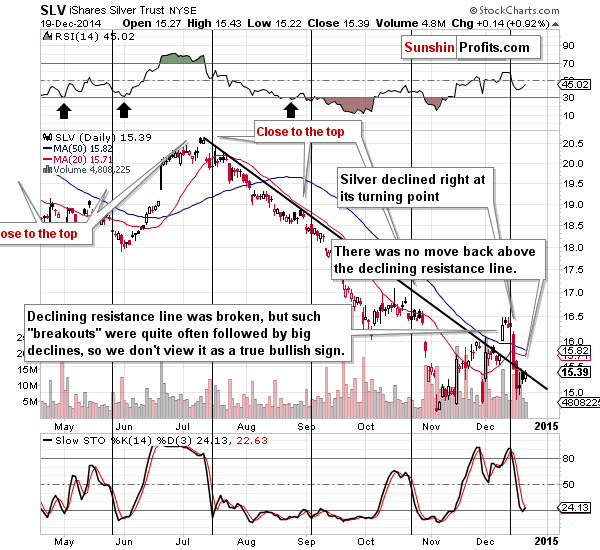
The silver price remains below the declining resistance line, which is a bearish sign if we factor in the rally in the general stock market in the past few days.
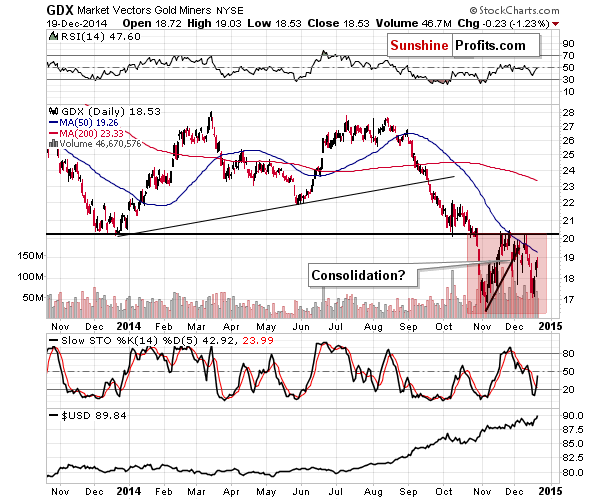
The situation in mining stocks developed in a similar way to what we saw in gold – miners declined but on low volume, which could be viewed as a bullish sign. Other than that, our previous comments remain up-to-date:
The general stock market moved sharply higher yesterday, which is the likely reason behind the miners’ rally. Consequently, their daily outperformance doesn’t necessarily imply strength in the precious metals sector.
Before summarizing, let’s take a look at the situation in the bond market. It didn’t change, but it’s important to keep it in mind, so we are bringing it to your attention once again.
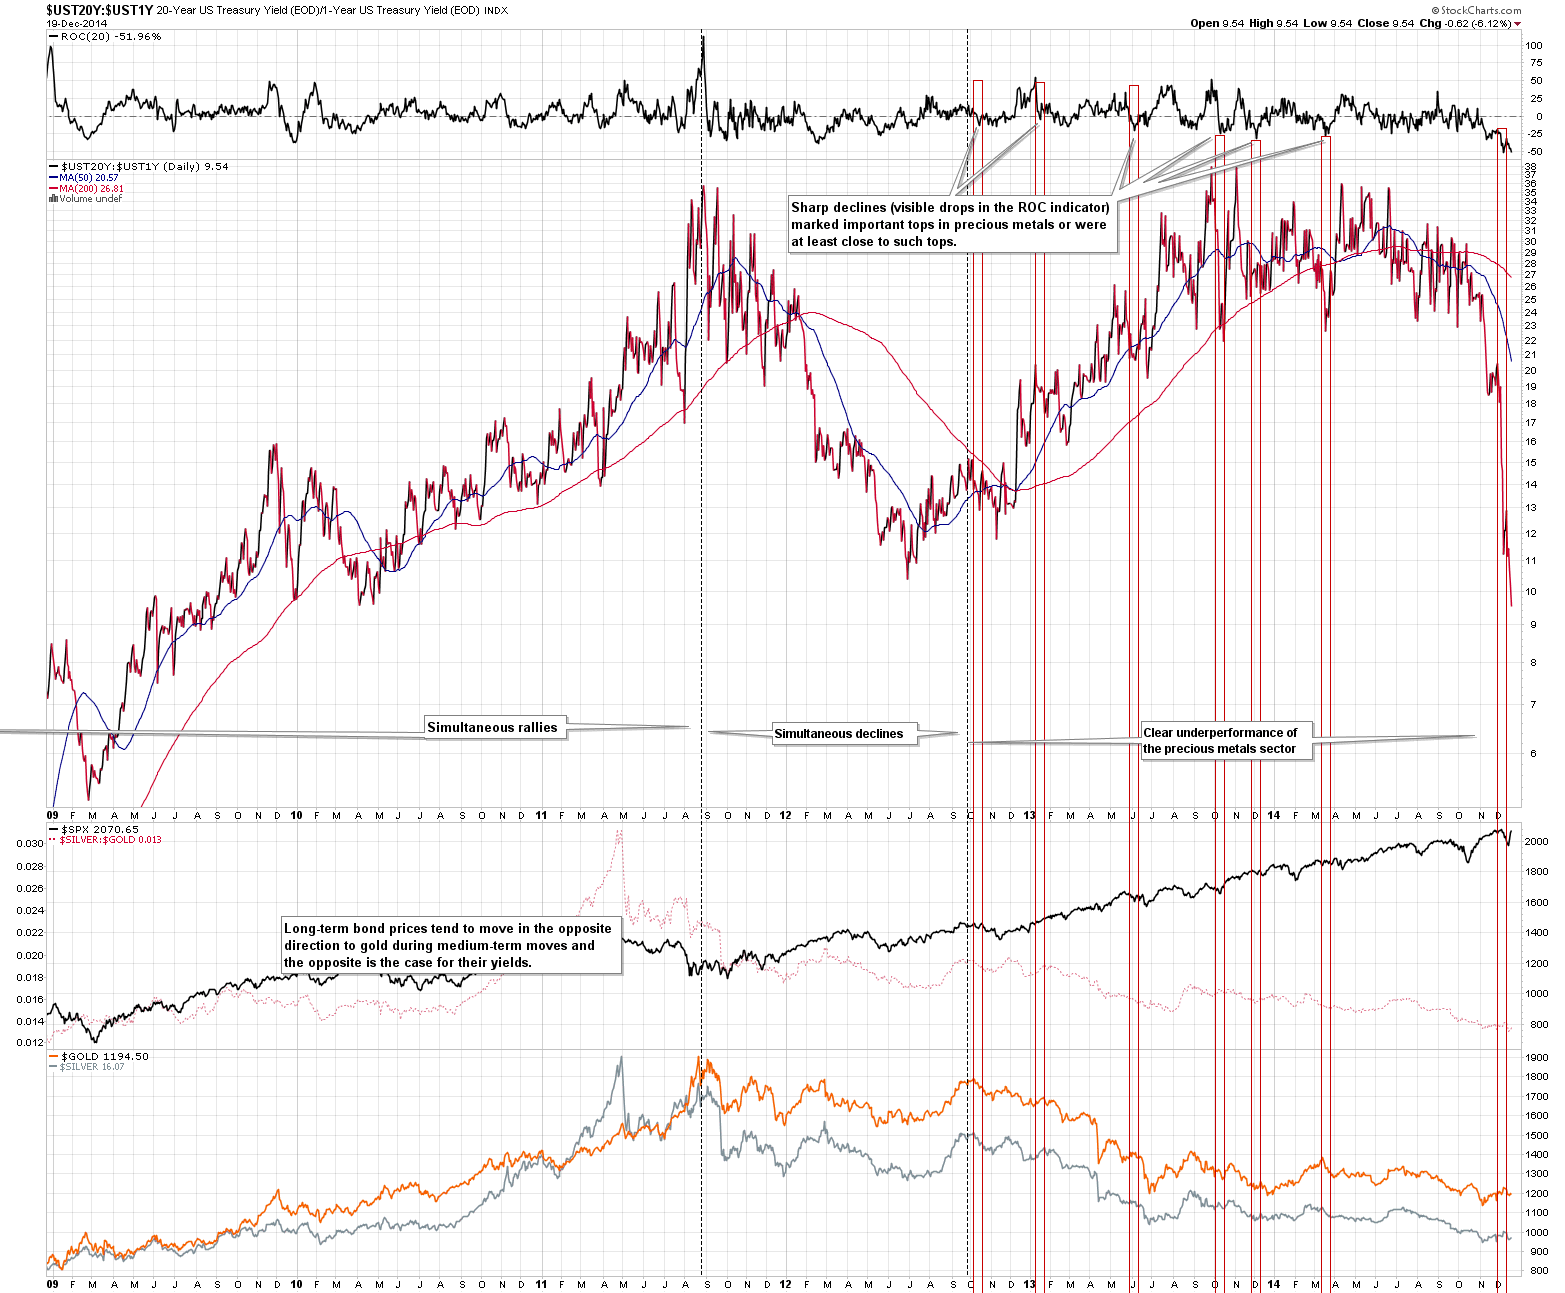
Our previous comments on the above picture remain up-to-date and so are its implications for the precious metals market:
Sharp declines in the yields of 20-year bonds relative to the yields of 1-year bonds are something that marked or preceded important tops in the precious metals market. The slide in the value of the ratio that we have just seen was enormous, which is a significant bearish signal for the precious metals market.
We have just seen another slide in the ratio, which makes the bearish implications even more bearish.
Summing up, , the last several weeks of trading seem to be a consolidation after a big decline and a verification of the breakdown below the 2013 lows. The medium-term outlook remains bearish, but the short-term one is unclear.
The situation in various ratios (silver stocks to silver, gold stocks to gold) and in the bond market continues to have bearish implications for the precious metals market (as described in previous alerts), but there are bullish signs present in the gold market and the link between gold and the USD Index is rather cloudy, which makes the overall short-term picture both tense and unclear. The medium-term trend remains down.
With gold stocks being very close to their 2008 and 2014 lows and silver close to $15, it’s certainly good to be out of the market with the long-term investments in this sector – something that we have been writing about for many months now. It seems that we will see much lower prices for precious metals in the coming weeks or months regardless of the short-term developments.
It seems that another trading opportunity is just around the corner and even though not much seems to be going on, it might be that paying close attention to the precious metals market at this time and in the coming days will be well worth it. We will be monitoring the market and we’ll keep you – our subscribers - informed.
To summarize:
Trading capital (our opinion): No positions
Long-term capital (our opinion): No positions
Insurance capital (our opinion): Full position
Please note that a full position doesn’t mean using all of the capital for a given trade. You will find details on our thoughts on gold portfolio structuring in the Key Insights section on our website.
As a reminder – “initial target price” means exactly that – an “initial” one, it’s not a price level at which we suggest closing positions. If this becomes the case (like it did in the previous trade) we will refer to these levels as levels of exit orders (exactly as we’ve done previously). Stop-loss levels, however, are naturally not “initial”, but something that, in our opinion, might be entered as an order.
Since it is impossible to synchronize target prices and stop-loss levels for all the ETFs and ETNs with the main markets that we provide these levels for (gold, silver and mining stocks – the GDX ETF), the stop-loss levels and target prices for other ETNs and ETF (among other: UGLD, DGLD, USLV, DSLV, NUGT, DUST, JNUG, JDST) are provided as supplementary, and not as “final”. This means that if a stop-loss or a target level is reached for any of the “additional instruments” (DGLD for instance), but not for the “main instrument” (gold in this case), we will view positions in both gold and DGLD as still open and the stop-loss for DGLD would have to be moved lower. On the other hand, if gold moves to a stop-loss level but DGLD doesn’t, then we will view both positions (in gold and DGLD) as closed. In other words, since it’s not possible to be 100% certain that each related instrument moves to a given level when the underlying instrument does, we can’t provide levels that would be binding. The levels that we do provide are our best estimate of the levels that will correspond to the levels in the underlying assets, but it will be the underlying assets that one will need to focus on regarding the sings pointing to closing a given position or keeping it open. We might adjust the levels in the “additional instruments” without adjusting the levels in the “main instruments”, which will simply mean that we have improved our estimation of these levels, not that we changed our outlook on the markets. We are already working on a tool that would update these levels on a daily basis for the most popular ETFs, ETNs and individual mining stocks.
Our preferred ways to invest in and to trade gold along with the reasoning can be found in the how to buy gold section. Additionally, our preferred ETFs and ETNs can be found in our Gold & Silver ETF Ranking.
As always, we'll keep you - our subscribers - updated should our views on the market change. We will continue to send out Gold & Silver Trading Alerts on each trading day and we will send additional Alerts whenever appropriate.
The trading position presented above is the netted version of positions based on subjective signals (opinion) from your Editor, and the automated tools (SP Indicators and the upcoming self-similarity-based tool).
As a reminder, Gold & Silver Trading Alerts are posted before or on each trading day (we usually post them before the opening bell, but we don't promise doing that each day). If there's anything urgent, we will send you an additional small alert before posting the main one.
=====
Latest Free Trading Alerts:
The significant decline in Bitcoin started on Monday with Bitcoin closing below $350. Yesterday was another day of declines. Bitcoin went down and on strong volume. But today we saw somewhat different development which might be of interest to Bitcoin traders.
Bitcoin Trading Alert: Important Development for Bitcoin Traders
=====
Hand-picked precious-metals-related links:
Why Russia will not sell its gold to solve the rouble crisis
Path of the gold price is in China’s hands
Canada approves world's largest copper-gold project
INFOGRAPHIC: the many phases of silver
=====
In other news:
Worst Russian Stock Drop Since 2008 Seen Continuing
China Offers Russia Help With Currency Swap Suggestion
=====
P.S. On an administrative note, there will be no alerts on Thursday (Dec. 25) and Friday (Dec. 26) this week. We will start posting them again on Monday, Dec. 29.
Thank you.
Sincerely,
Przemyslaw Radomski, CFA
Founder, Editor-in-chief
Gold & Silver Trading Alerts
Forex Trading Alerts
Oil Investment Updates
Oil Trading Alerts

