
Briefly: In our opinion no speculative short positions in gold, silver and mining stocks are currently justified from the risk/reward perspective.
Gold declined sharply yesterday, and so did silver and – especially – mining stocks. The gold stocks to gold ratio has broken below its previous 2014 lows. The above is particularly bearish as there was no huge rally in the USD Index yesterday. Yet, gold managed to rally in today’s pre-market trading despite the above-mentioned bearish combination. Is the decline over or about to really start?
The situation is not simple. Surprisingly the situation is not unclear just because gold rallied today, but because of where it declined before the rally. We’ll move to that in just a few minutes. First, let’s take a look at the context – the USD Index (charts courtesy of http://stockcharts.com).
Here’s what we wrote previously about to USD Index:
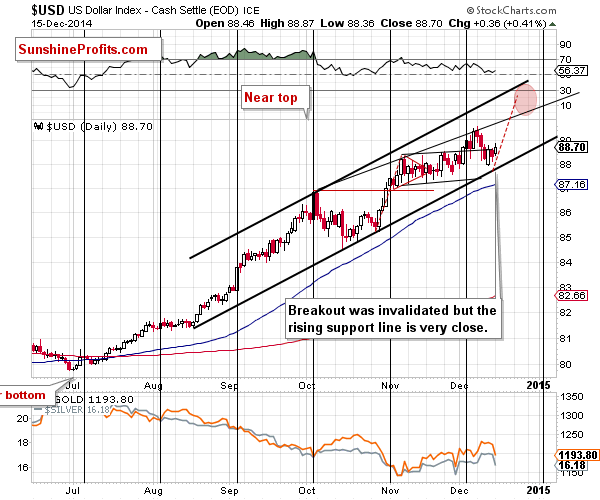
(…) since the rising support line was not reached, it seems that we could see another very short-term downswing that would be followed by a bigger move up.
Without a breakdown here, the short-term trend, and thus the outlook, remains bullish.
We still haven’t seen a breakdown and in today’s pre-market trading, we saw a move right to the support line, so we could be seeing a local bottom at this time.
We also wrote the following:
In the recent alerts we wrote that one of the things that could make the outlook for gold much more bearish was its ability to decline regardless of what was going on in the USD Index. In Thursday’s alert we emphasized that: gold indeed declined along with the USD Index yesterday, but it doesn’t seem that this was significant enough to indicate a new tendency. That was just daily price action, and since gold’s previous upswing was very sharp and significant, a daily pause is something natural – it doesn’t have to imply anything more.
The move was invalidated in both the USD and gold on Thursday, so overall not much changed in the gold-USD link in the past 2 days.
On Friday, however, gold declined along with the USD Index, so perhaps we are seeing a start of a disconnection of the two markets. Just like it was the case previously, we will need to see more of this kind of performance to say that gold can decline significantly without the dollar’s help.
Gold declined again yesterday, and the move was more significant than what one might have been expecting to see based on USD’s little rally. Thus, gold’s underperformance continued. Today, gold moved back up in light of a much greater decline in the USD. Overall both: gold and USD moved lower in the last 2 days.
While we still remain skeptical toward the gold’s ability to decline regardless of the U.S. dollar’s price swings, it seems that we might be really seeing a beginning of this kind of relationship (lack thereof). The implications are bearish for gold and the rest of the precious metals sector.
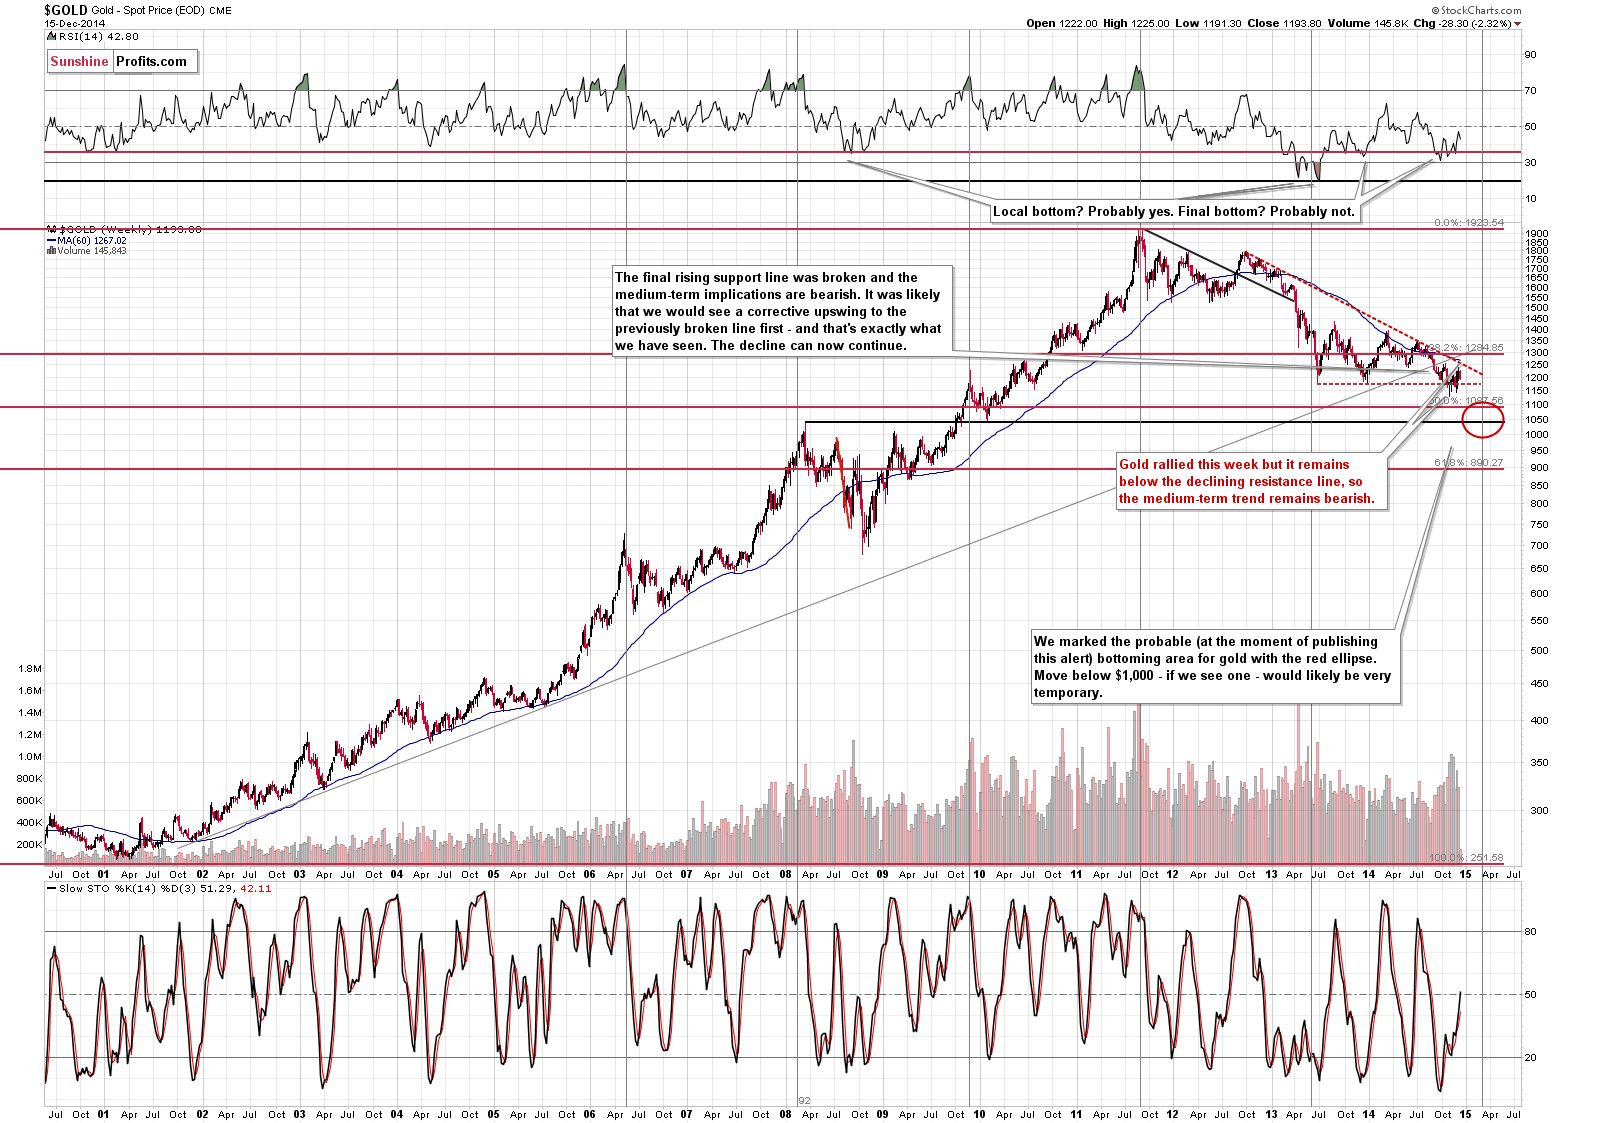
Meanwhile, nothing changed from the long-term perspective, so our previous comments remain up-to-date:
Let’s keep in mind that gold remains in a medium-term downtrend and could move even higher in the short term (to $1,250 or so) and still remain in it. In other words, another short-term rally here would not invalidate the bearish medium-term outlook.
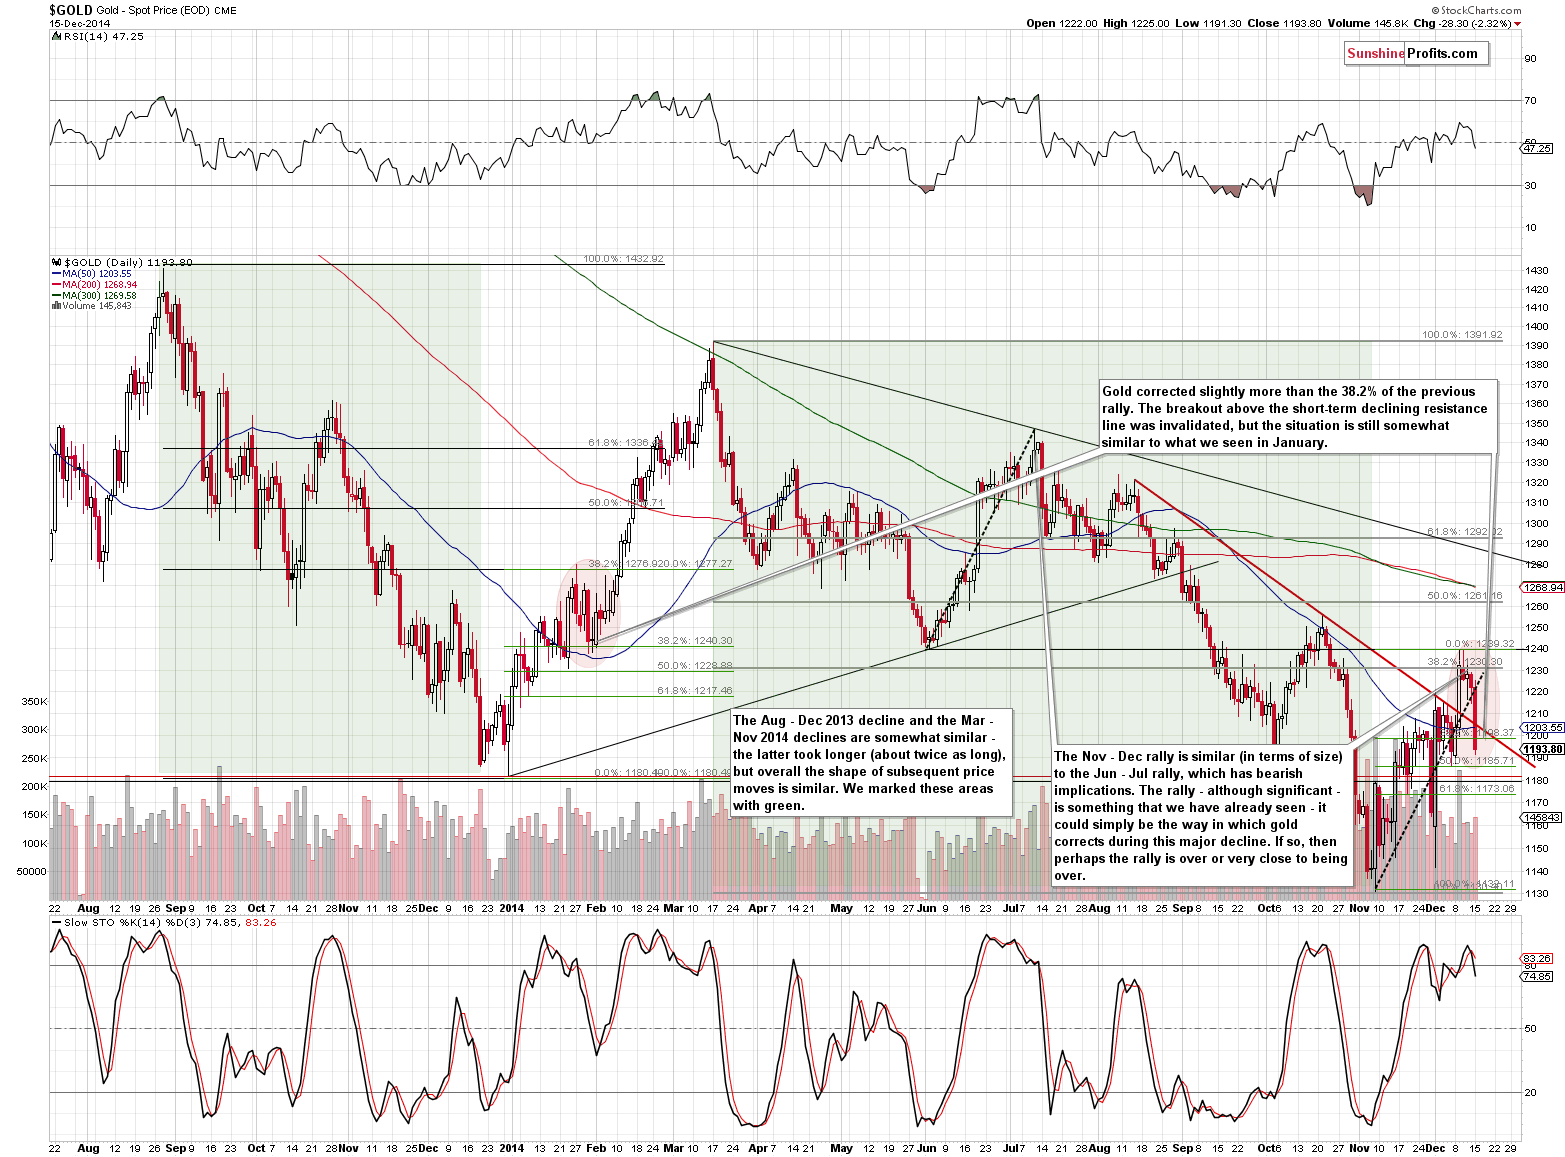
The short-term picture, however, changed and the changes are very important.
First of all, the breakout above the declining resistance line was invalidated yesterday. Even though gold moved back above it in today’s pre-market trading, it’s still a bearish factor – without a daily close back above this line, the implications are simply limited.
However, the key thing about yesterday’s decline is how low it took gold. The price of the yellow metal declined slightly below the 38.2% Fibonacci retracement level based on the short-term rally. This is more or less where gold corrected in late January 2014 before rallying quite sharply. Since the previous declines (marked with green) were similar in terms of shape, we could see a similar rally also here, if this self-similarity pattern continues.
Today’s rally in gold seems to confirm that the above pattern remains in place and the implications remain bullish.
On the short-term basis we don’t have much new to comment on. Gold moved lower in the last few trading days, after the previous sharp rally, but the decline took place on relatively low volume, so it could be the case that what we’re seeing now is a pause within a short-term rally. Overall, the above picture doesn’t provide us with clear implications.
Let’s move to silver.
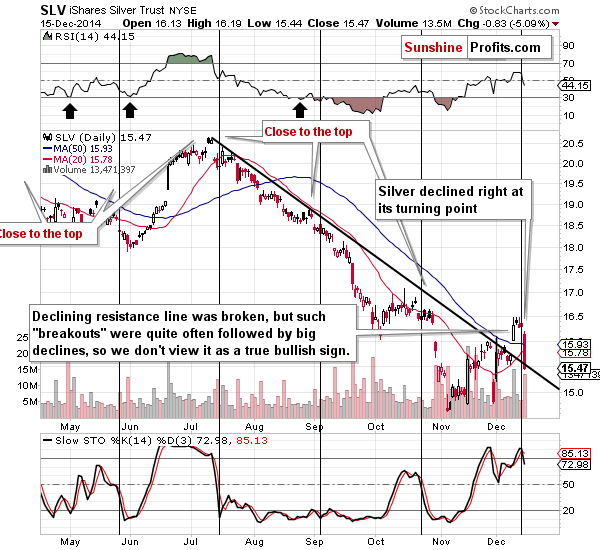
In yesterday’s alert we write that silver’s lack of real declines is not really encouraging because it means that the current turning point has bearish implications.
Silver declined yesterday - right at its cyclical turning point - and it has done so on relatively high volume. It didn’t move much up today (at least not at the moment of writing these words: +$0.17), and the implications are bearish.
Gold stocks declined significantly.
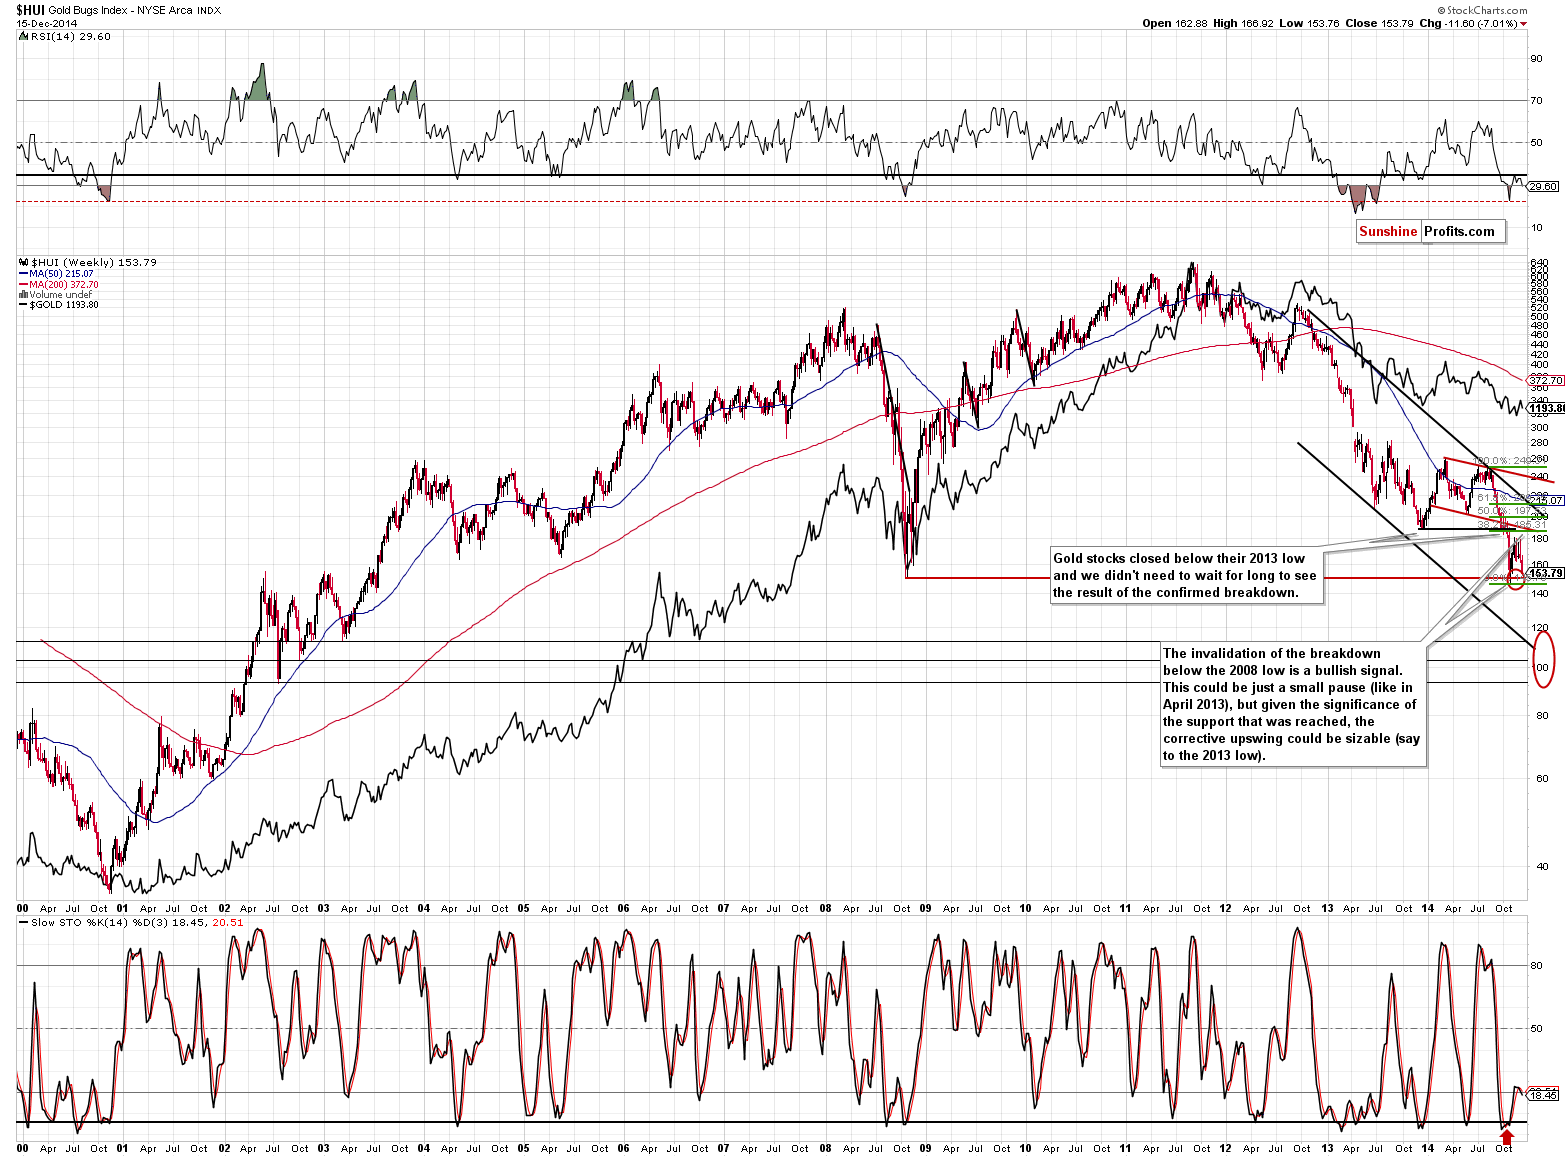
The HUI Index has almost erased the recent corrective rally and gold stocks are now very close to their previous 2014 and 2008 lows.
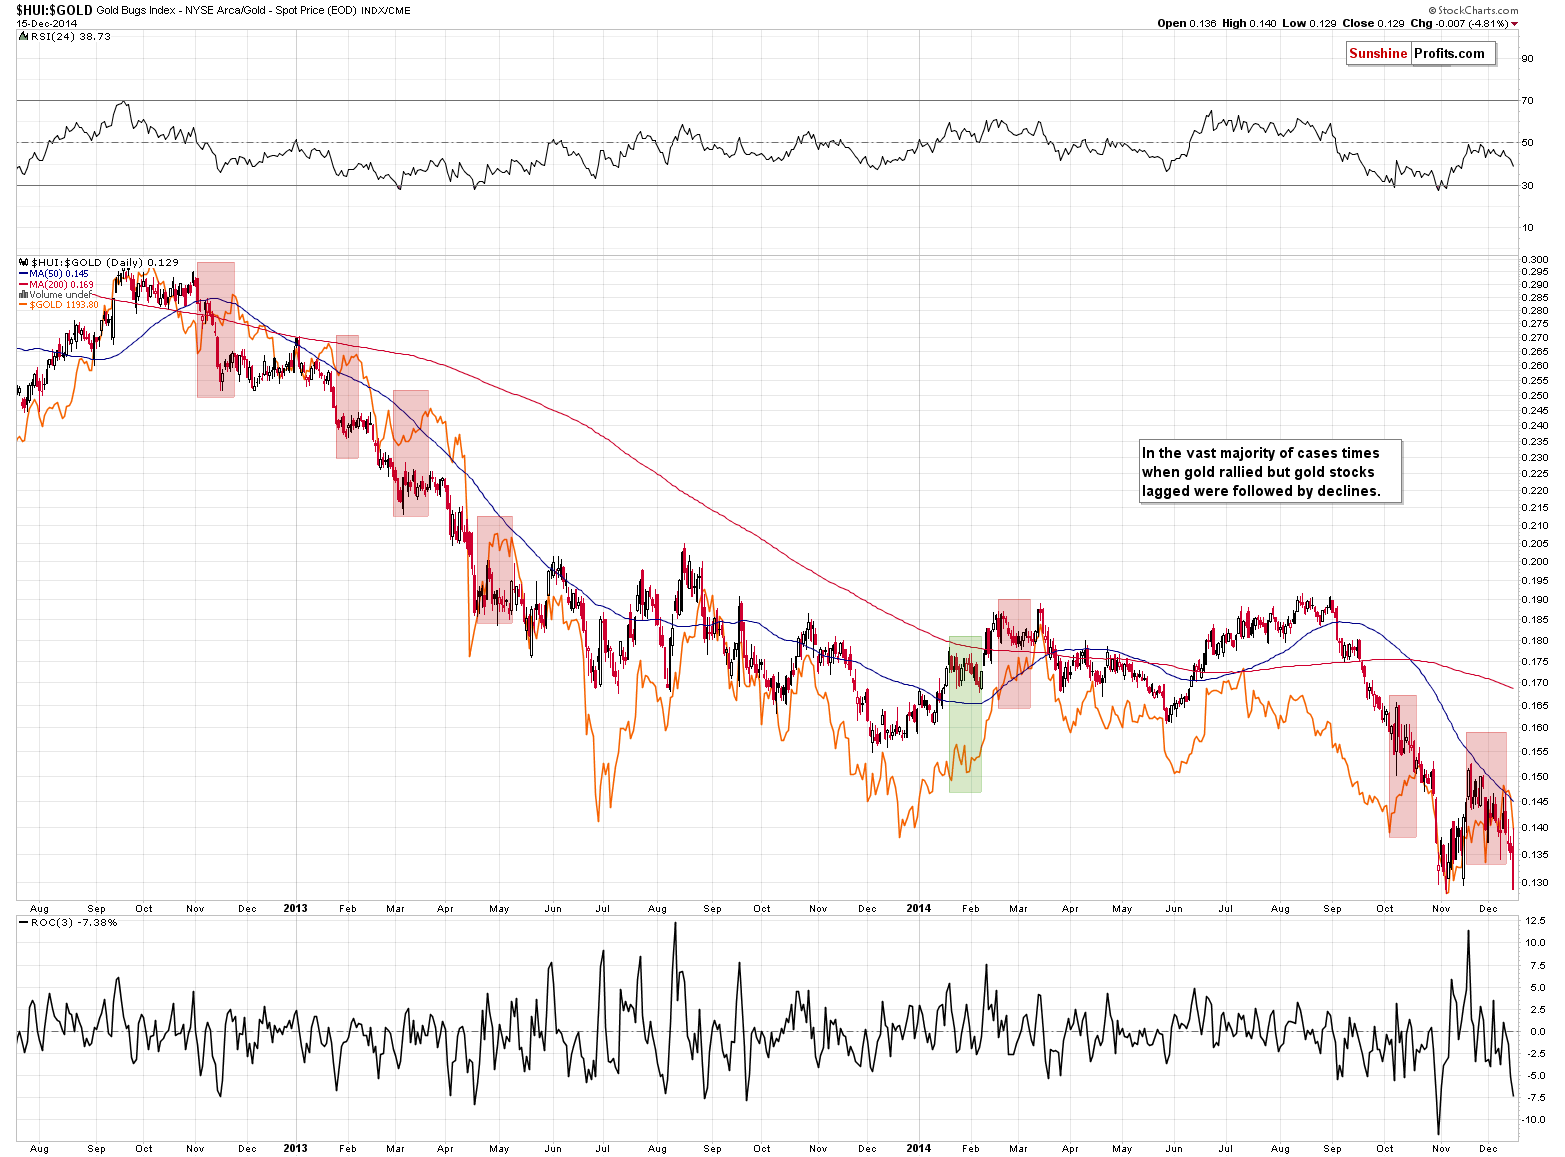
More importantly, the gold stocks to gold ratio declined once again on Monday and the bearish implications are now very strong, as the ratio has already moved below its previous low.
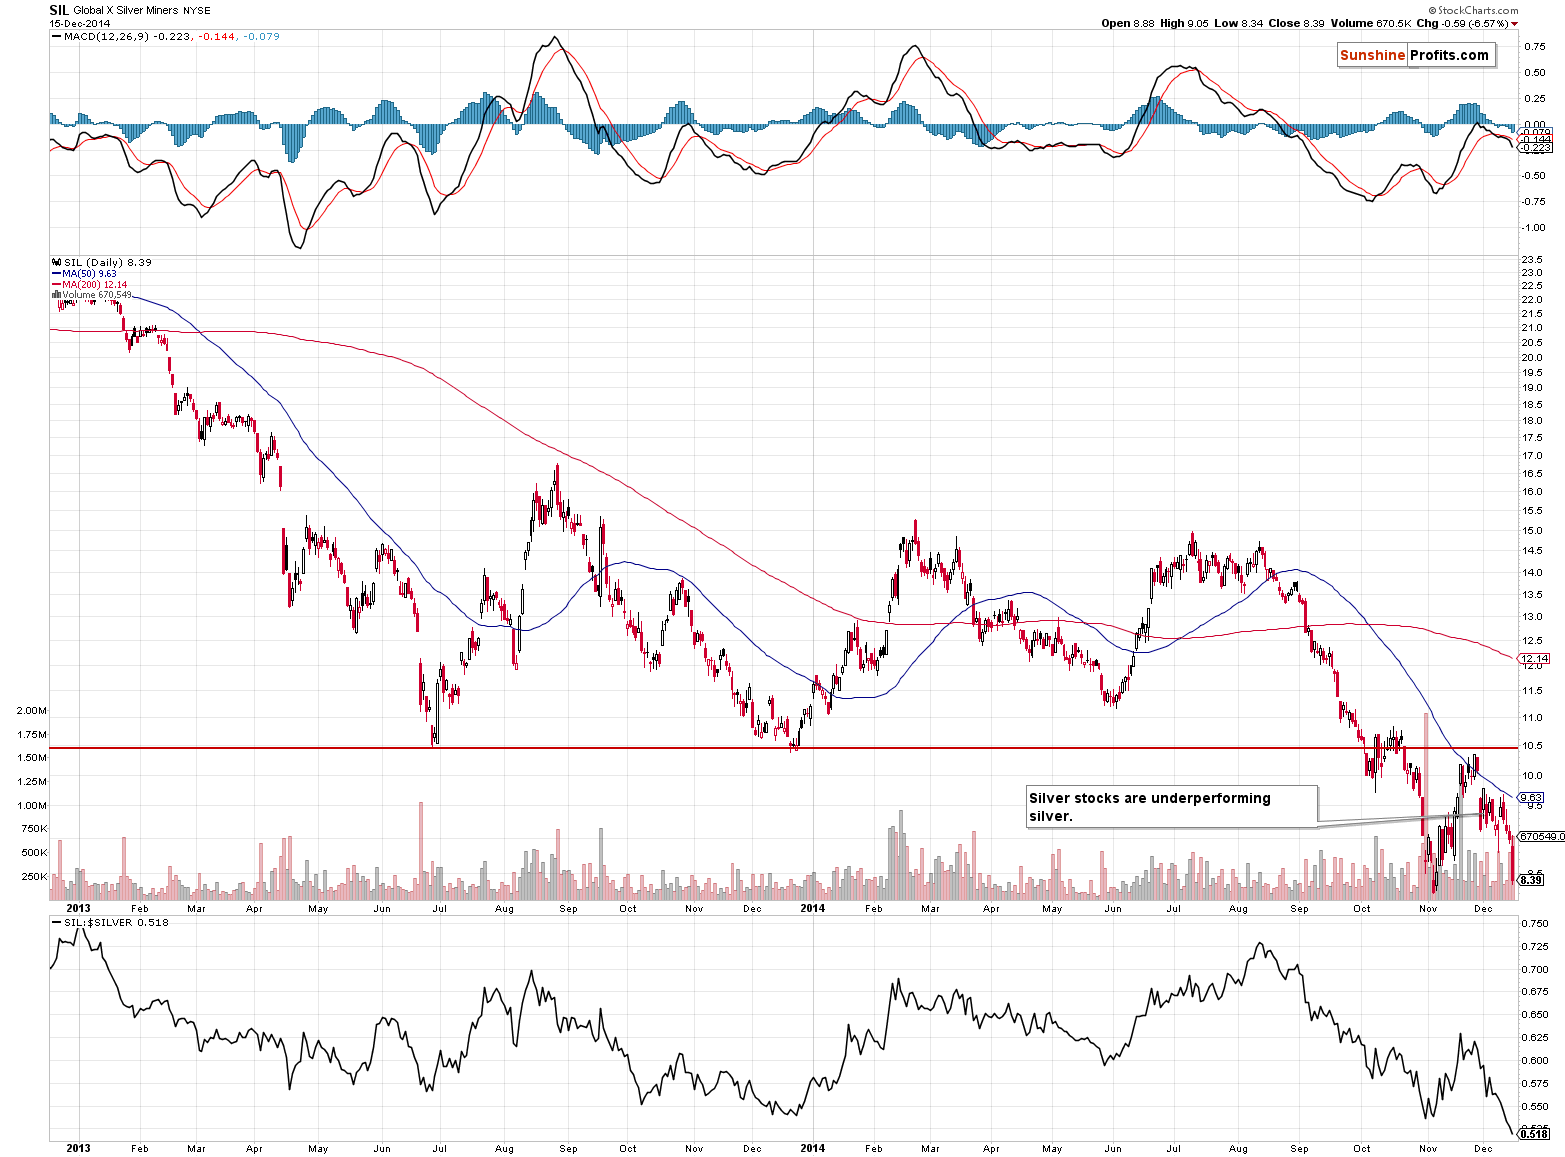
Silver stocks provide confirmation for the above. The have also moved to their previous 2014 low and their ratio to silver (bottom part of the above chart) has already moved below the previous lows. The implications are bearish.
Summing up, the situation is very tense and while most factors point to lower gold prices in the short run, there is one factor that prevents us from re-opening short positions in the precious metals sector at this point – the similarity of the recent decline-and-correction pattern to what we’ve seen previously. At this time the scenario in which we’ll see another short-term move up, like in February and early March this year, still can’t be ruled out. If gold stocks continue to disappoint and gold continues to perform poorly given signals from the USD Index, we will most likely see the short positions as justified – but that is not the case just yet.
With gold stocks being very close to their 2008 and 2014 lows it’s certainly good to be out of the market with the long-term investments in this sector – something that we have been favoring for many months now. It seems that we will see much lower prices of the precious metals in the coming weeks or months regardless of the short-term developments.
We’ll keep you – our subscribers - informed.
To summarize:
Trading capital (our opinion): No positions
Long-term capital (our opinion): No positions
Insurance capital (our opinion): Full position
Please note that a full position doesn’t mean using all of the capital for a given trade. You will find details on our thoughts on gold portfolio structuring in the Key Insights section on our website.
As a reminder – “initial target price” means exactly that – an “initial” one, it’s not a price level at which we suggest closing positions. If this becomes the case (like it did in the previous trade) we will refer to these levels as levels of exit orders (exactly as we’ve done previously). Stop-loss levels, however, are naturally not “initial”, but something that, in our opinion, might be entered as an order.
Since it is impossible to synchronize target prices and stop-loss levels for all the ETFs and ETNs with the main markets that we provide these levels for (gold, silver and mining stocks – the GDX ETF), the stop-loss levels and target prices for other ETNs and ETF (among other: UGLD, DGLD, USLV, DSLV, NUGT, DUST, JNUG, JDST) are provided as supplementary, and not as “final”. This means that if a stop-loss or a target level is reached for any of the “additional instruments” (DGLD for instance), but not for the “main instrument” (gold in this case), we will view positions in both gold and DGLD as still open and the stop-loss for DGLD would have to be moved lower. On the other hand, if gold moves to a stop-loss level but DGLD doesn’t, then we will view both positions (in gold and DGLD) as closed. In other words, since it’s not possible to be 100% certain that each related instrument moves to a given level when the underlying instrument does, we can’t provide levels that would be binding. The levels that we do provide are our best estimate of the levels that will correspond to the levels in the underlying assets, but it will be the underlying assets that one will need to focus on regarding the sings pointing to closing a given position or keeping it open. We might adjust the levels in the “additional instruments” without adjusting the levels in the “main instruments”, which will simply mean that we have improved our estimation of these levels, not that we changed our outlook on the markets. We are already working on a tool that would update these levels on a daily basis for the most popular ETFs, ETNs and individual mining stocks.
Our preferred ways to invest in and to trade gold along with the reasoning can be found in the how to buy gold section. Additionally, our preferred ETFs and ETNs can be found in our Gold & Silver ETF Ranking.
As always, we'll keep you - our subscribers - updated should our views on the market change. We will continue to send out Gold & Silver Trading Alerts on each trading day and we will send additional Alerts whenever appropriate.
The trading position presented above is the netted version of positions based on subjective signals (opinion) from your Editor, and the automated tools (SP Indicators and the upcoming self-similarity-based tool).
As a reminder, Gold & Silver Trading Alerts are posted before or on each trading day (we usually post them before the opening bell, but we don't promise doing that each day). If there's anything urgent, we will send you an additional small alert before posting the main one.
=====
Latest Free Trading Alerts:
On Friday, crude oil lost 2.81% as the International Energy Agency cut its outlook for demand growth in 2015. In this environment, the commodity hit a fresh multi-year low of $57.34 and reached its key support line. Will we see a rebound from here?
Oil Trading Alert: Crude Oil – Oil Bears In Charge
=====
Hand-picked precious-metals-related links:
India to weigh gold policy impact after 38 pct spurt in Nov imports
Barclays: silver vulnerable to further downside
=====
In other news:
Why 1998 Was Different, and Same, to Emerging-Market Crisis Now
The real reason behind the EM rout
Why Russia’s monster rate hike spells trouble ahead
=====
Thank you.
Sincerely,
Przemyslaw Radomski, CFA
Founder, Editor-in-chief
Gold & Silver Trading Alerts
Forex Trading Alerts
Oil Investment Updates
Oil Trading Alerts

