
Briefly: In our opinion no speculative positions are currently justified from the risk/reward perspective.
Gold and mining stocks didn’t do much yesterday – they didn’t move above the previous November high. Silver, however, moved visibly higher and closed above the previous November high. Is silver leading other metals higher or is this a “short again” signal?
In short, we are leaning toward the latter interpretation. The white metal is known for short-term outperformance near local tops, so this could be the case also this time. Things are not crystal clear, though.
As usually, let’s start today’s analysis with the USD Index (charts courtesy of http://stockcharts.com).
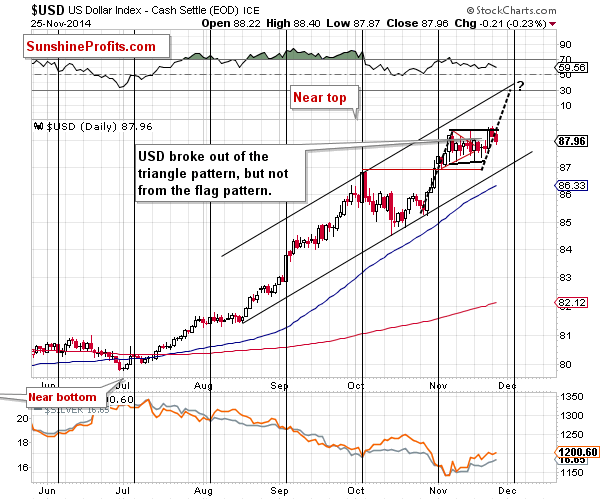
The USD Index moved a bit lower yesterday – there was no breakout and no breakdown out of the flag pattern. Consequently, our previous comments remain up-to-date once again:
The USD Index moved visibly higher on Friday, breaking out of the triangle pattern. The implications are bullish but not strongly bullish, as the pattern started to resemble more of a flag than a triangle. Since the flag pattern was not broken, many traders probably thought that the situation hadn’t changed. This could explain the lack of response in the precious metals market. If we saw a strong breakout and metals didn’t react, then it would definitely be a sign of strength, but at this time, it could be the case that the market participants are still not viewing the dollar’s move as a something real.
(…)
The downside is limited in case of a breakdown, and the upside is visibly higher in case of a breakout. If we see a move similar to the one that preceded the recent consolidation, then we could see a move close to the 89 level that would materialize in the first part of December. This scenario seems quite likely also given the resistance line that would be reached (it would simply “fit”) and the cyclical turning point – we are likely to see at least a local top close to it.
We could see a small move lower before the rally starts, though. This means that the above doesn’t invalidate our previous outlook and price targets for the precious metals sector.
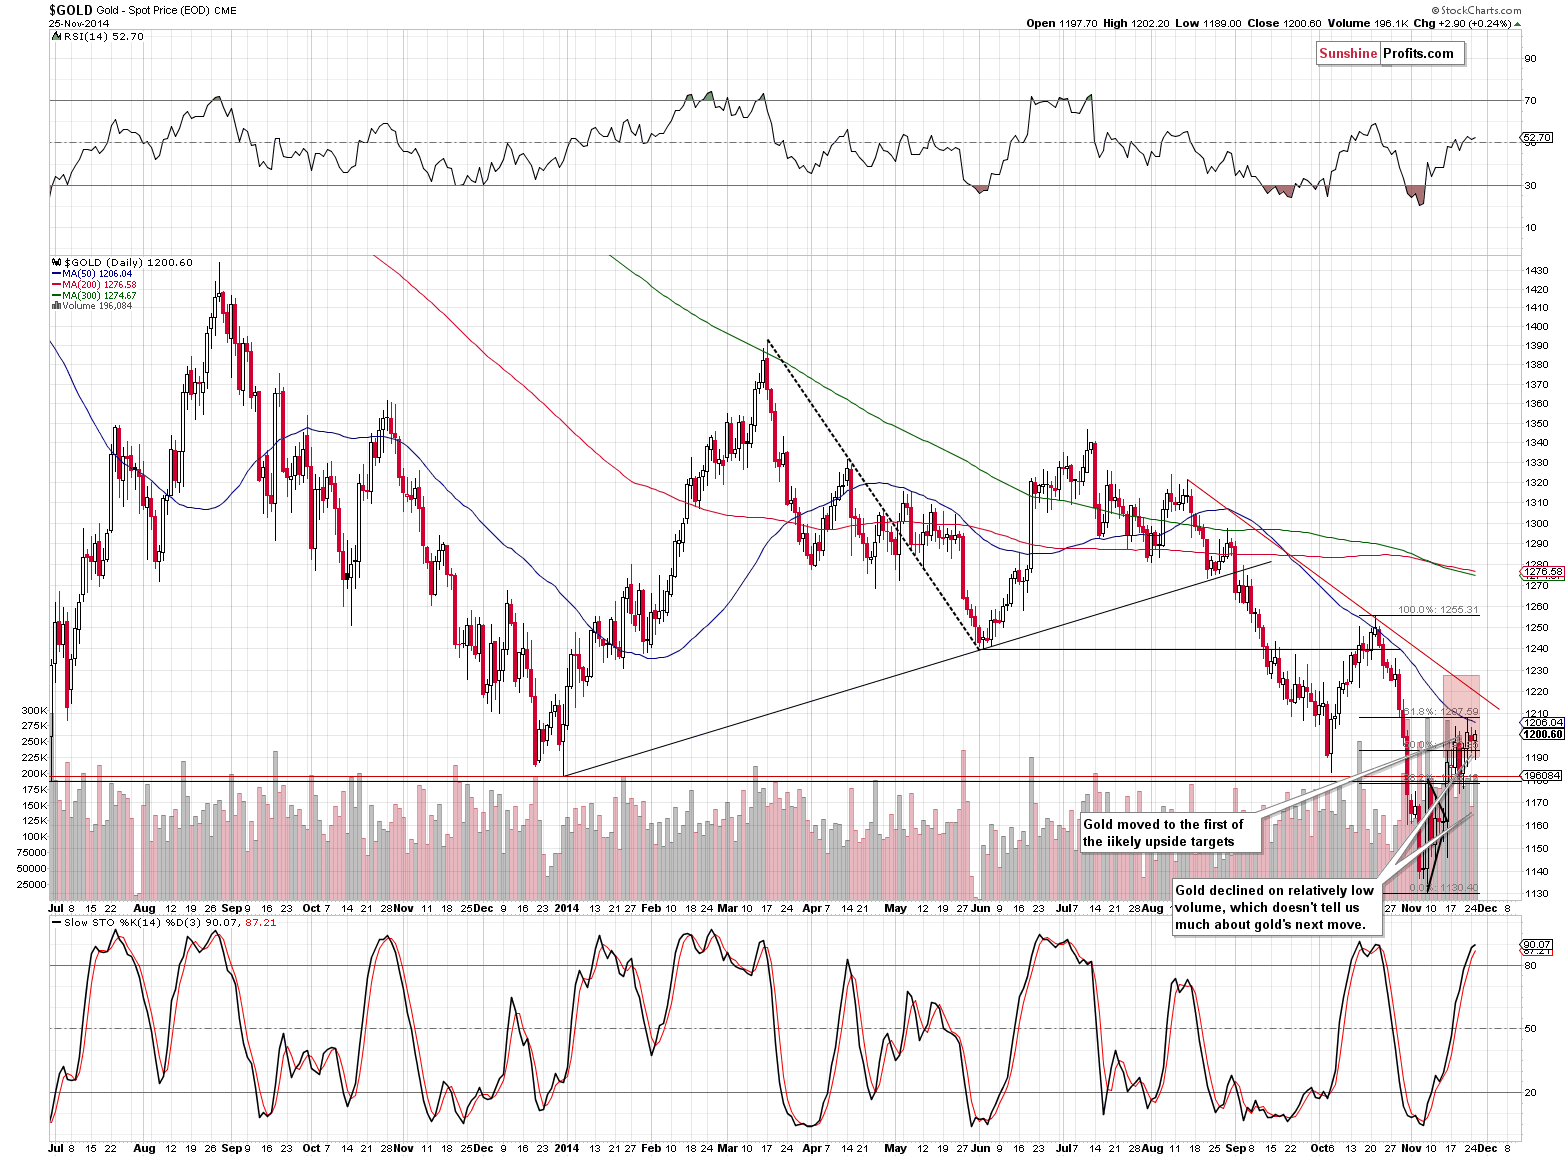
Gold paused yesterday and there were no changes in this market as well:
(…) we can see that gold moved to the lower of our upside target levels. This level is created by the 61.8% Fibonacci retracement level and the 50-day moving average. The last time gold touched its 50-day MA, it was one day ahead of the top.
The implications of the above are bearish, but at this time we can’t rule out another $20 or so move higher, which would take gold to the declining resistance line.
Since gold moved higher along with the USD, we could very well see a further upswing (if the USD declines at least a bit), but if the USD breaks above the flag pattern, then gold will likely decline right away.
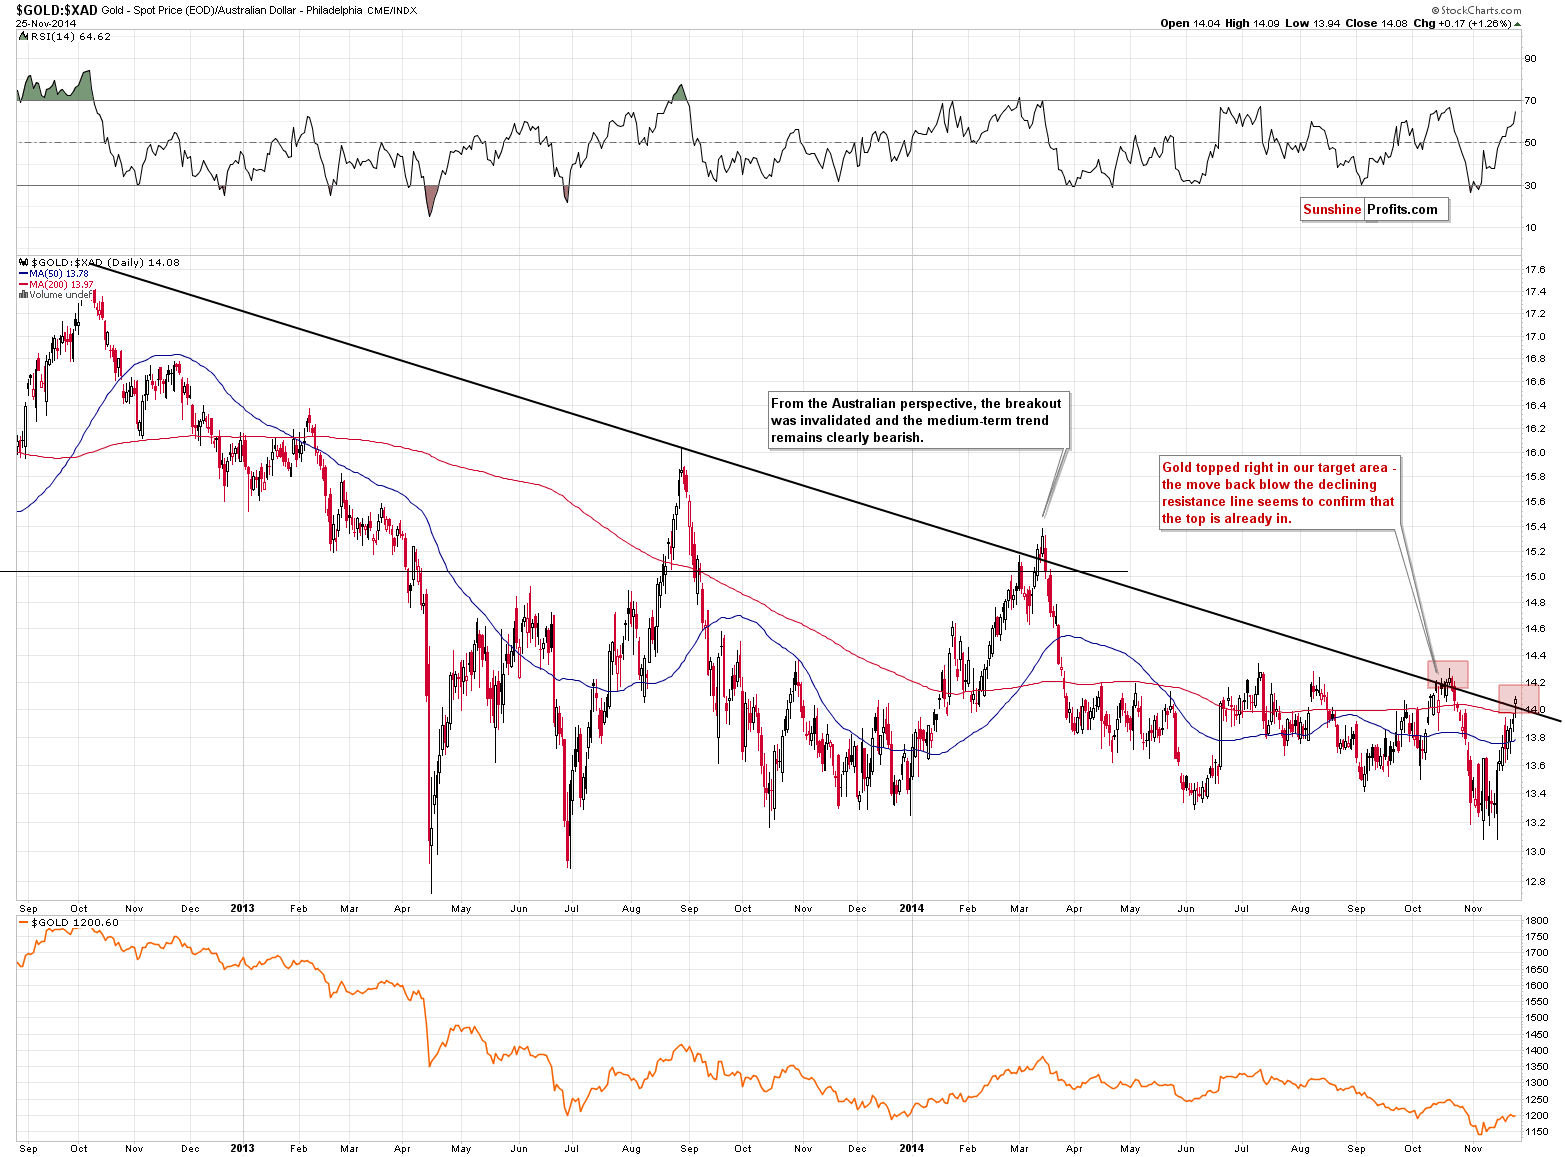
We’ve seen a more interesting development in gold from the Australian perspective. Gold priced in the Australian dollar moved above the declining medium-term resistance line. Even though the breakout seems to be a bullish factor, it really isn’t as the previous 2 “breakouts” turned out to be fakeouts and they both marked major tops in gold also from the USD perspective. The implications, therefore, are bearish.
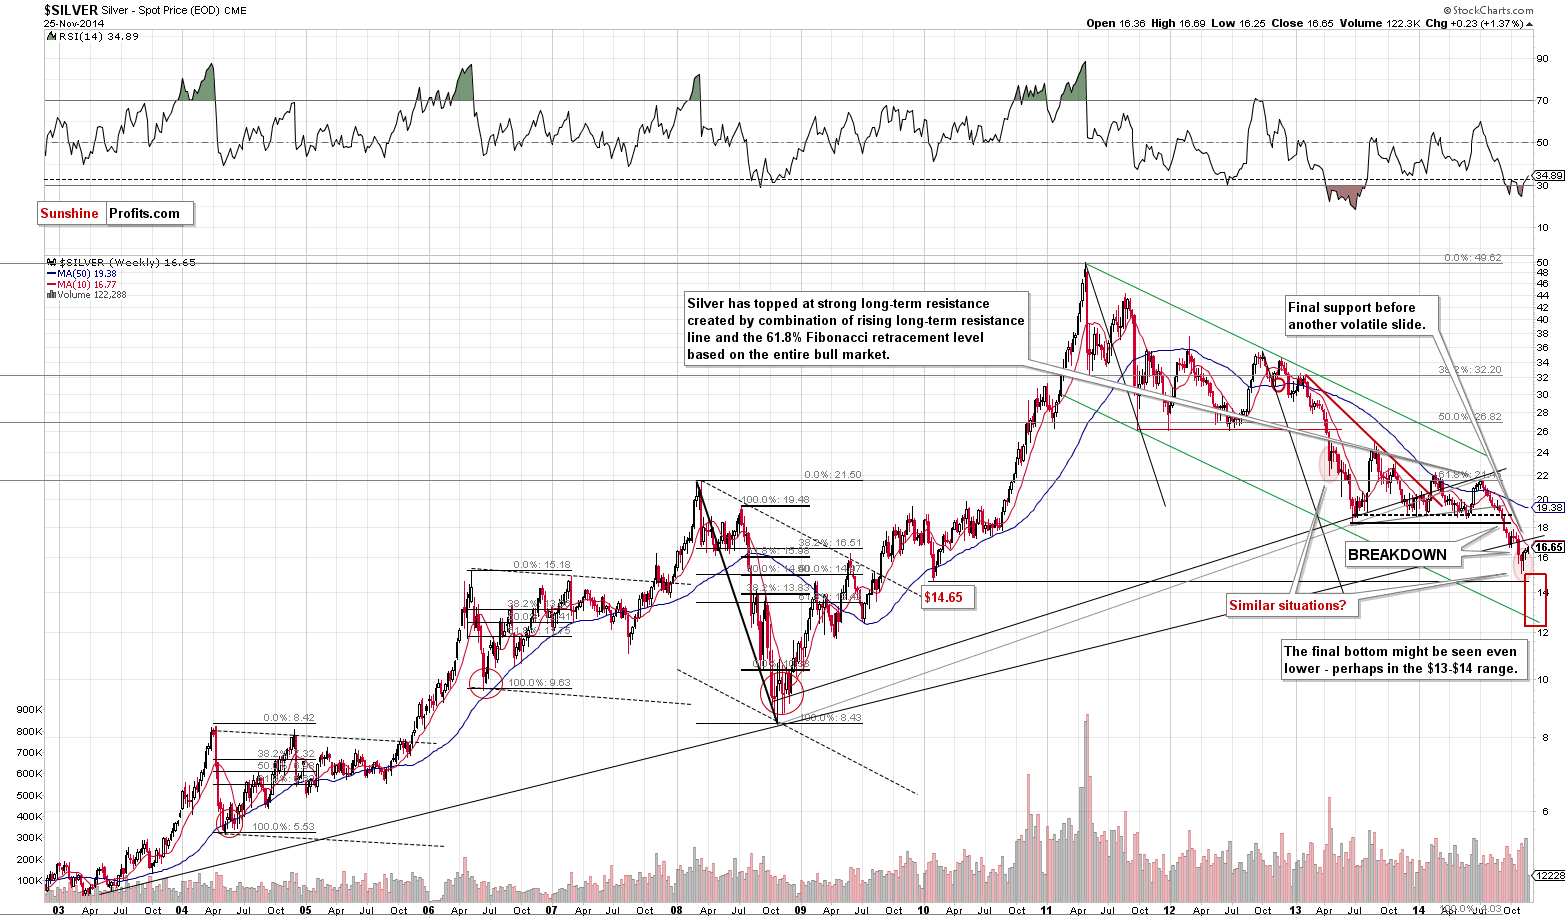
From the long-term perspective, the recent move higher still seems to be nothing more than a correction. The thing that we would like to emphasize today is that back in 2008, during the previous big slide, silver corrected approximately to its 10-week moving average and this is more or less where silver moved yesterday. Consequently, it might be the case the next local top is very close.
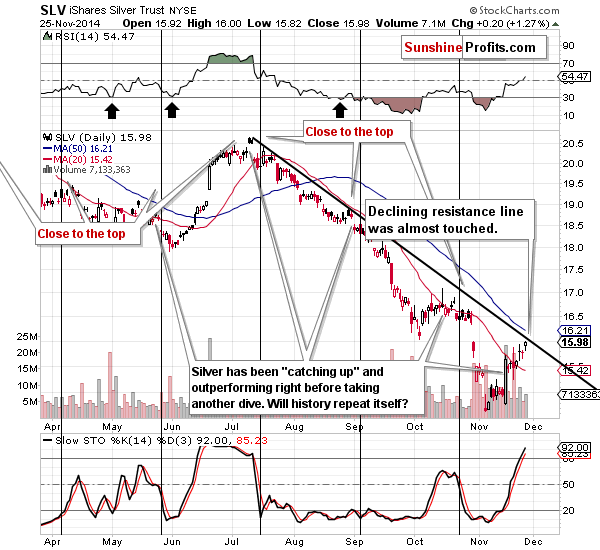
On the short-term chart, and using the SLV ETF as a proxy, we see that silver is about $0.23 below the 50-day moving average (the 10-week MA’s counterpart), so the upside (given the 2008 analogy) is indeed limited. Moreover, silver moved very close to the declining resistance line, which is another big cautionary flag.
Additionally, silver’s move higher is significant in that it means a move visibly below the previous November high. This means that silver is outperforming gold and miners on a short-term basis, which might be a sign that a local top is near. The outperformance was not accompanied by a sharp move – something that we would like to see as a confirmation of the above bearish tendency (that’s the way in which silver often heralded that a plunge was about to be seen).
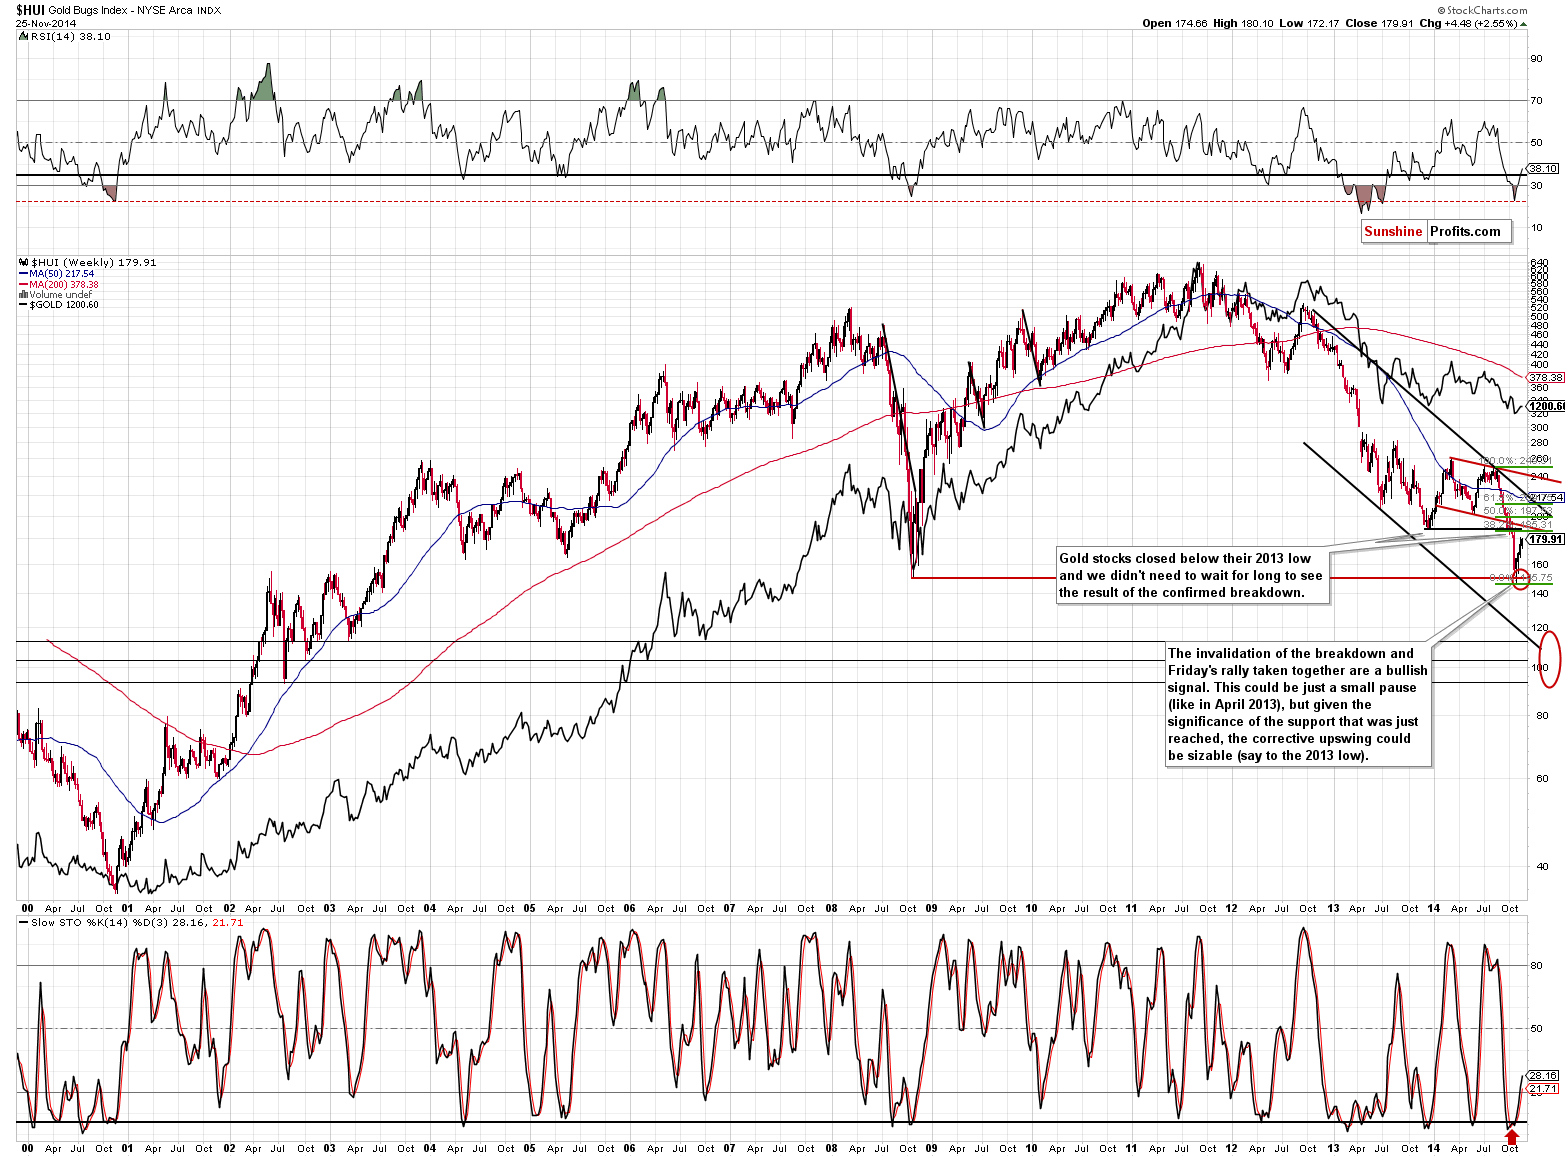
Gold stocks moved higher as well and are once again just several index points below the 2013 low. After the HUI moved to 164.54, we commented that gold miners could move even higher and these comments remain up-to-date:
Gold stocks moved higher last week after reaching our initial target area but that’s no proof that the decline is completely over. During the 2008 decline there were sharp corrective upswings as well, but they didn’t mean that the decline was over. The current decline has been significant, so a corrective upswing (a pause within the decline) would be something normal.
How high could gold stocks go before the decline is resumed? It’s a tough call as the market has been very volatile lately, but at this time we wouldn’t rule out a move back to the previously broken support at the 2013 low. The 38.2% Fibonacci retracement based on the recent decline is very close to it, so it seems quite likely that the 185-190 level would stop a rally.
Summing up, we have some signs that the precious metals market is topping at this time (gold at a combination of resistance levels, the GDX ETF at the 2013 low, the USD Index’s rally and the invalidation of a breakout in platinum), but without a clearer and more definitive bearish confirmation it seems that opening a speculative short position is not justified from the risk/reward perspective. For instance, gold’s, silver’s, and miners’ ability not to decline on Friday when the USD rallied strongly is a bullish sign. We are very close to the point when short positions will be justified, but – in our opinion - we are not there just yet.
One of the signs that could make the risk/reward ratio favorable enough for us to mention short positions again is a sharp, temporary outperformance in silver – but we didn’t see such move yesterday.
As always, we will continue to monitor the situation and report to you – our subscribers – accordingly. We will aim to multiply the recent profits and will quite likely open another trading position shortly – stay tuned.
On an administrative note, the markets in the U.S. will be closed on Thursday and we expect the trading activities to be limited on Friday as well. Consequently, we there will be no Gold & Silver Trading Alerts on Thursday and Friday. The alerts will be posted until Wednesday and will then be posted normally beginning on Monday, Dec 1.
Have a happy Thanksgiving holiday weekend!
To summarize:
Trading capital (our opinion): No positions
Long-term capital (our opinion): No positions
Insurance capital (our opinion): Full position
Please note that a full position doesn’t mean using all of the capital for a given trade. You will find details on our thoughts on gold portfolio structuring in the Key Insights section on our website.
As a reminder – “initial target price” means exactly that – an “initial” one, it’s not a price level at which we suggest closing positions. If this becomes the case (like it did in the previous trade) we will refer to these levels as levels of exit orders (exactly as we’ve done previously). Stop-loss levels, however, are naturally not “initial”, but something that, in our opinion, might be entered as an order.
Our preferred ways to invest in and to trade gold along with the reasoning can be found in the how to buy gold section. Additionally, our preferred ETFs and ETNs can be found in our Gold & Silver ETF Ranking.
As always, we'll keep you - our subscribers - updated should our views on the market change. We will continue to send out Gold & Silver Trading Alerts on each trading day and we will send additional Alerts whenever appropriate.
The trading position presented above is the netted version of positions based on subjective signals (opinion) from your Editor, and the automated tools (SP Indicators and the upcoming self-similarity-based tool).
As a reminder, Gold & Silver Trading Alerts are posted before or on each trading day (we usually post them before the opening bell, but we don't promise doing that each day). If there's anything urgent, we will send you an additional small alert before posting the main one.
=====
Latest Free Trading Alerts:
S&P 500 index made yet another new all-time high, before closing slightly lower. Will uptrend continue ahead of long holiday weekend?
Stock Trading Alert: No Clear Short-Term Direction As Stocks Fluctuate Along Record Highs
Yesterday was a continuation of what we had seen over a weekend. Today, we've also seen rising prices. Does this mean that it's time to get on the long side of the market?
Bitcoin Trading Alert: One Tick Closer to a Decisive Move
Earlier today, the Conference Board showed that its index of consumer confidence dropped to 88.7 in November, missing analysts’ expectations for an increase to 95.9. In a response, the U.S. dollar moved lower, which pushed the EUR/USD pair to an important resistance line. Will we see a breakout and further improvement?
Forex Trading Alert: EUR/USD – Currency Bulls Don’t Give Up
=====
Hand-picked precious-metals-related links:
Goldman, BASF, HSBC accused of metals price fixing - U.S. lawsuit
China 2014 gold demand heading for 2,100 tonnes
Global gold supply in deficit this year, even more so next
Glencore-Rio Merger Will Happen, Hannam Tells Hedge Funds
WGC ties up with IIM-A to set up Gold Policy Centre
=====
In other news:
El-Erian: October volatility a preview of what's ahead
Tail Risk Indicator Back To Extreme Levels
ECB can decide on QE in first quarter: Vice President
EU's Juncker proposes $380 billion investment plan
=====
Thank you.
Sincerely,
Przemyslaw Radomski, CFA
Founder, Editor-in-chief
Gold & Silver Trading Alerts
Forex Trading Alerts
Oil Investment Updates
Oil Trading Alerts

