
Briefly: In our opinion no speculative positions are currently justified from the risk/reward perspective.
Yesterday’s session and today’s pre-market trading were as volatile as they were perplexing to the precious metals traders. Gold, silver and mining stocks moved significantly lower in the early part of the session, after which gold and miners moved back up only to decline once again before the end of the session. Gold moved back up in today’s pre market trading. What are the implications?
In short, the implication is that it’s good to be on the sidelines at the time, watching this very short-term volatility. With opened positions, volatile market means a bigger chance of being thrown out of the market due to a stop-loss order that would be accidentally touched.
When are we likely to see some more decisive movement? Let’s take a look at the charts starting with the USD Index (charts courtesy of http://stockcharts.com).
The US currency didn’t do much yesterday in terms of daily closing prices. It’s still consolidating. Consequently, our yesterday’s comments remain up-to-date:
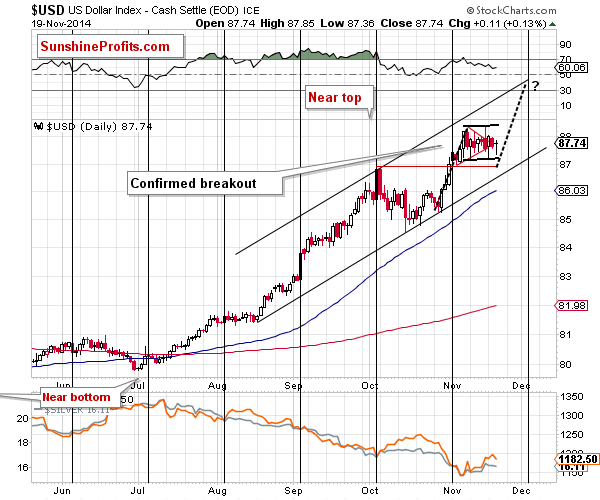
The USD Index declined once again yesterday, and while it’s once again within the triangle pattern, it could be the case that the pattern is actually a flag (marked with black, solid lines). The implications are generally the same (flag is also a continuation pattern), but in this case we will not have a breakout or breakdown until the USD moves approximately below or above its most recent highs or lows, respectively.
The downside is limited in case of a breakdown, and the upside is visibly higher in case of a breakout. If we see a move similar to the one that preceded the recent consolidation, then we could see a move close to the 89 level that would materialize in the first part of December. This scenario seems quite likely also given the resistance line that would be reached (it would simply “fit”) and the cyclical turning point – we are likely to see at least a local top close to it.
We could see a small move lower before the rally starts, though. This means that the above doesn’t invalidate our previous outlook and price targets for the precious metals sector.
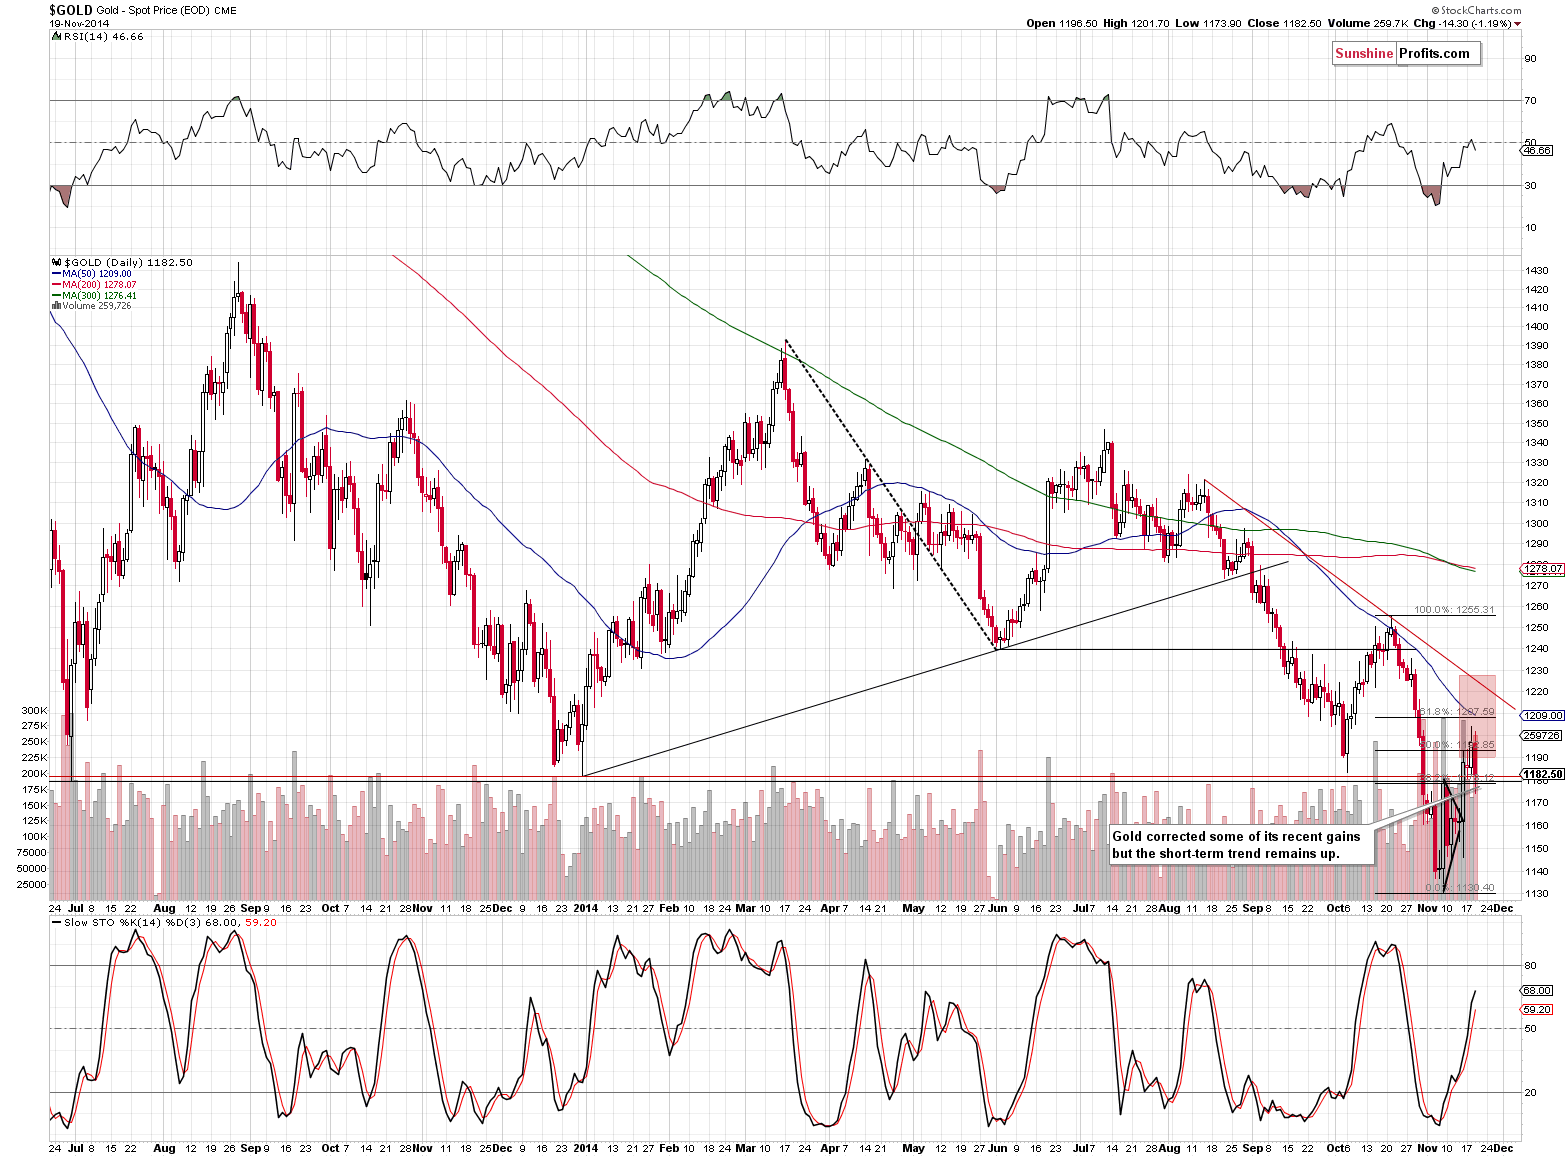
Gold move a bit below our target area yesterday but it’s back in it today. Much happened, but little changed. Overall, since it hasn’t moved to any of the 2 resistance levels that we featured previously (61.8% Fibonacci retracement level and the declining red resistance line), it seems that the rally is not over just yet.
Yesterday’s comments remain up-to-date:
(…) after such a sizable daily rally on strong volume, we can expect some more strength in the coming day(s). So, how high can gold go? To the following resistance levels, of course. The next one is the 61.8% Fibonacci retracement, and a bit higher we have the declining short-term resistance line. It seems likely to us that one of them will stop the rally, as they more or less correspond to the support levels in the USD Index. Which of them is more likely? It’s a touch call at this time – it seems that focusing on other markets / ratios and waiting for a confirmation is a good idea at this time.
The situation in the silver market remains unchanged as well.
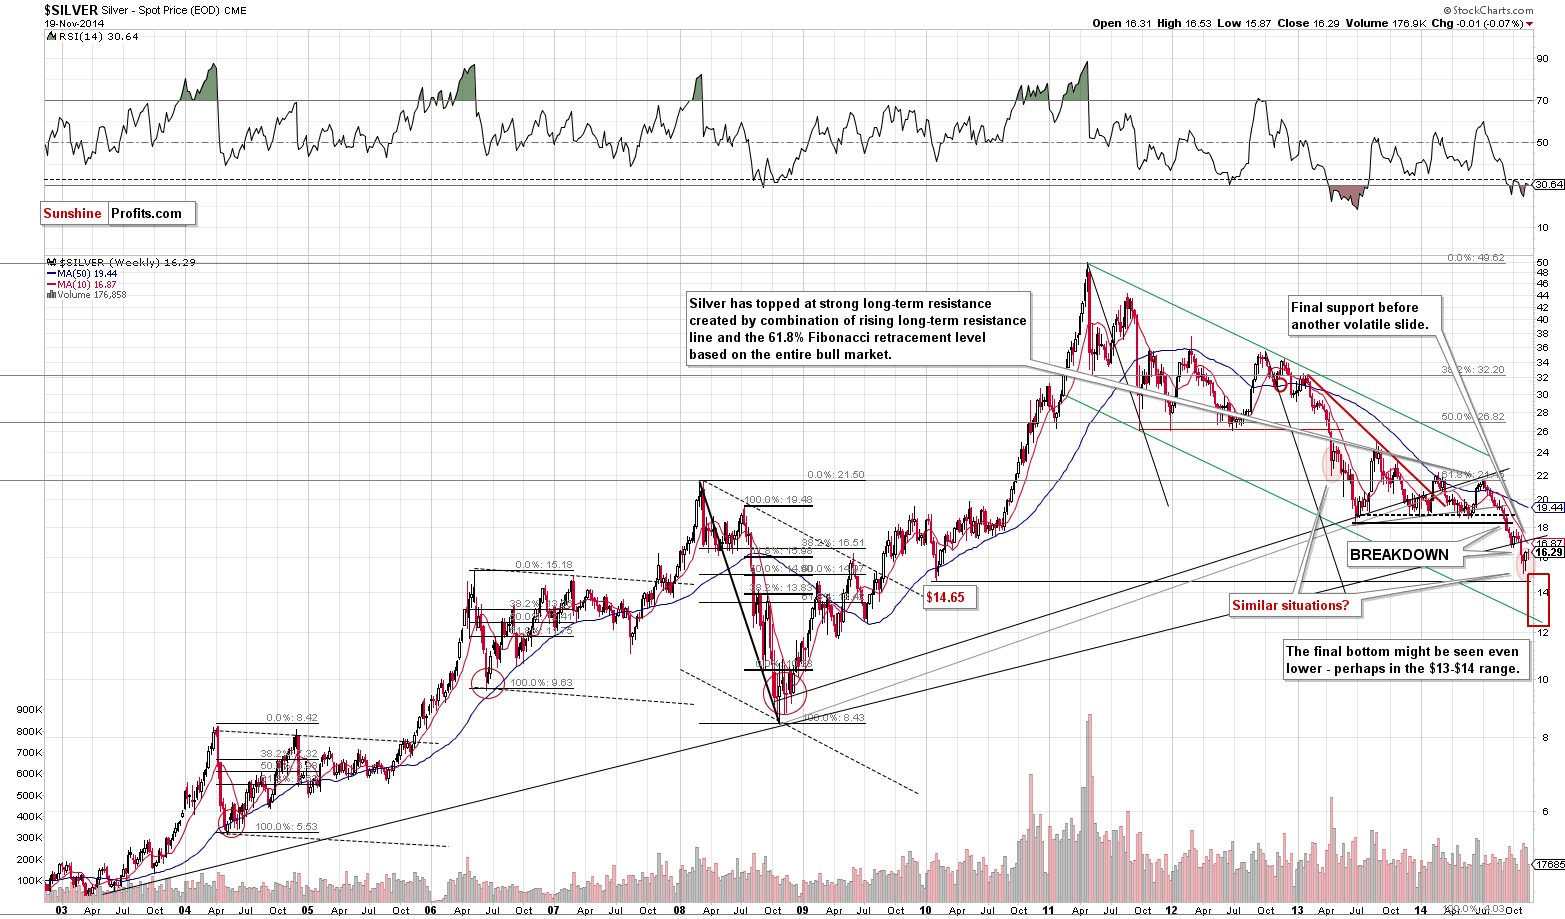
From the long-term perspective, the consolidation seems to continue, which is in tune with what we saw in April 2013. The analogy to this month has bearish implications as back then declines followed. Please note that silver spent a few weeks trading back and forth before its decline continued, so just because silver is not moving lower again is not concerning.
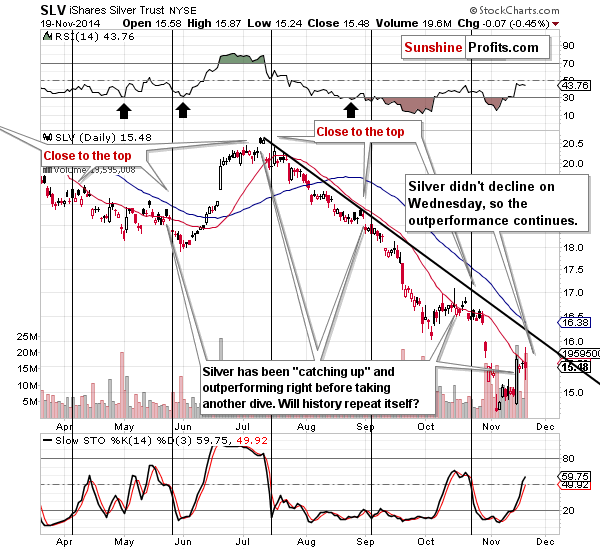
From the short-term point of view, we see that the SLV ETF did very little this week (after having rallied strongly on Friday) – the 20-day moving average seems to be providing a strong resistance. It seems quite likely to us that we will see a fake breakout above this move before the next slide follows. Something like that happened in the first part of October. At this time we would not be surprised to see a move to the declining resistance line, but that’s definitely not a requirement for the decline to continue. Such a rally simply could happen and it shouldn’t surprise is if it does.
Having said that, let’s take a look at the gold stocks.
Quoting yesterday’s comments once again seems appropriate:
Gold miners have their resistance level relatively high, but since they are ones that have recently dropped particularly significantly, it’s no wonder that the correction is also big.
(…)
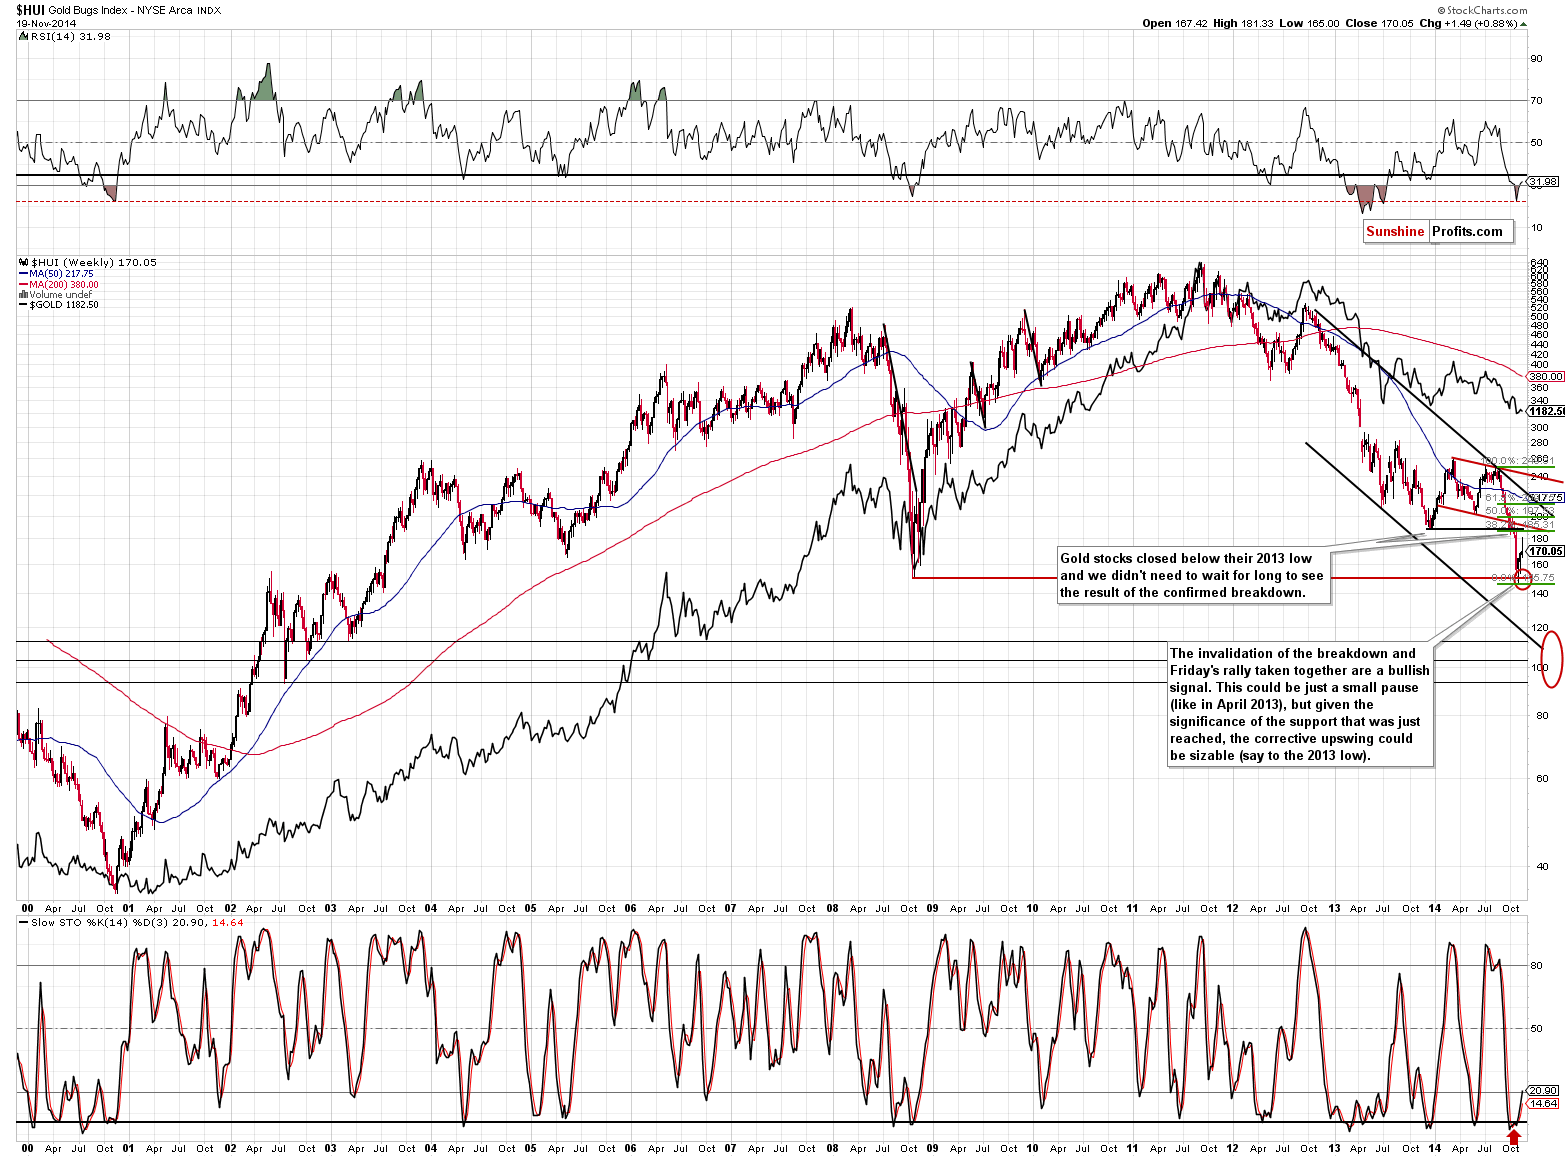
Gold stocks moved higher last week after reaching our initial target area but that’s no proof that the decline is completely over. During the 2008 decline there were sharp corrective upswings as well, but they didn’t mean that the decline was over. The current decline has been significant, so a corrective upswing (a pause within the decline) would be something normal.
How high could gold stocks go before the decline is resumed? It’s a tough call as the market has been very volatile lately, but at this time we wouldn’t rule out a move back to the previously broken support at the 2013 low. The 38.2% Fibonacci retracement based on the recent decline is very close to it, so it seems quite likely that the 185-190 level would stop a rally.
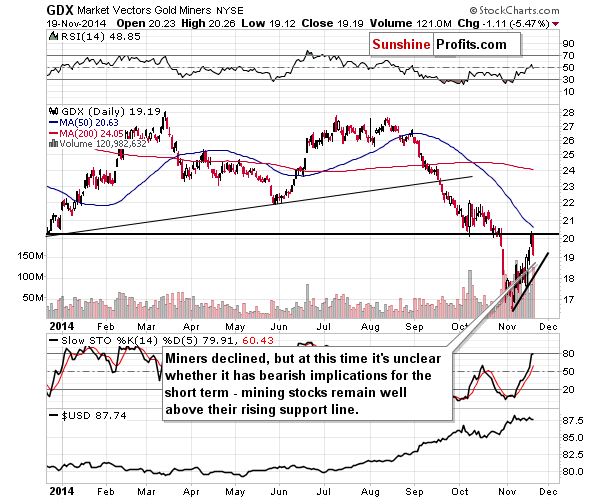
While the above remains up-to-date, the particularly interesting fact is that the GDX ETF is already at its 2013 low, but the XAU and HUI indices are not. The latter are more important than the ETF, so we don’t view the move to the 2013 low as being completed.
However, as you can see on the above chart, the resistance is very close – about 4-9 index points higher in the HUI Index. This means that we will probably consider opening short positions shortly. We want to see a confirmation in volume and perhaps an intra-day reversal before we jump back into the short positions, though.
So far, based on the above charts, it doesn’t seem that the rally is completely over and today’s pre-market move higher in gold seems to confirm it. As stated above, we would like to see a confirmation that the local top is in before entering a position, especially in such a volatile environment as we have right now.
Summing up, the precious metals sector continues to correct its recent downswing, while remaining in the medium-term downtrend, and it seems that it will move a little higher before turning south again. The move higher doesn’t have to be significant anymore – it seems that most of what was likely to happen is already behind us.
As always, we will continue to monitor the situation and report to you – our subscribers – accordingly. We will aim to multiply the recent profits and will quite likely open another trading position shortly – stay tuned.
To summarize:
Trading capital (our opinion): No positions
Long-term capital (our opinion): No positions
Insurance capital (our opinion): Full position
Please note that a full position doesn’t mean using all of the capital for a given trade. You will find details on our thoughts on gold portfolio structuring in the Key Insights section on our website.
As a reminder – “initial target price” means exactly that – an “initial” one, it’s not a price level at which we suggest closing positions. If this becomes the case (like it did in the previous trade) we will refer to these levels as levels of exit orders (exactly as we’ve done previously). Stop-loss levels, however, are naturally not “initial”, but something that, in our opinion, might be entered as an order.
Our preferred ways to invest in and to trade gold along with the reasoning can be found in the how to buy gold section. Additionally, our preferred ETFs and ETNs can be found in our Gold & Silver ETF Ranking.
As always, we'll keep you - our subscribers - updated should our views on the market change. We will continue to send out Gold & Silver Trading Alerts on each trading day and we will send additional Alerts whenever appropriate.
The trading position presented above is the netted version of positions based on subjective signals (opinion) from your Editor, and the automated tools (SP Indicators and the upcoming self-similarity-based tool).
As a reminder, Gold & Silver Trading Alerts are posted before or on each trading day (we usually post them before the opening bell, but we don't promise doing that each day). If there's anything urgent, we will send you an additional small alert before posting the main one.
=====
Latest Free Trading Alerts:
S&P 500 index remains close to its all-time high as it trades slightly below the level of 2,050. Is holding short position justified?
On Tuesday, crude oil lost 1.67% as ongoing speculation the Organization of the Petroleum Exporting Countries will not cut output continued to weigh on the price. As a result, the commodity extended losses and approached the key support line. Will light crude finally rebound from here?
Oil Trading Alert: What's Next For Crude Oil?
=====
Hand-picked precious-metals-related links:
HSBC says SNB will stand firm on cap even if gold vote goes against them
Unusual gold moves in Asian hours puzzle jittery traders
The ECB's gold buying idea is a non-starter
Support for Swiss gold referendum wanes
=====
In other news:
Yellen Gets That Sinking Feeling Greenspan Once Knew
S&P sounds warning on Chinese property sector, Russian banks
What matters for markets next year: Goldman Sachs
Fed and Markets More Co-Dependent Than Ever
What Do You Call a Banker Offered $200? A Liar
=====
Thank you.
Sincerely,
Przemyslaw Radomski, CFA
Founder, Editor-in-chief
Gold & Silver Trading Alerts
Forex Trading Alerts
Oil Investment Updates
Oil Trading Alerts

