
Briefly: In our opinion no speculative positions are currently justified from the risk/reward perspective.
In yesterday’s alert we commented on the mining stocks’ outperformance as something that was likely to be followed by further strength in the precious metals sector. We didn’t need to wait long for a confirmation. Miners soared yesterday and the rest of the precious metals sector moved higher as well. The rally in miners was extraordinary – how much does it imply at this time?
Well, it implies that the situation is evolving in tune with our previous expectations. The precious metals sector had declined and miners had declined particularly significantly, so the correction in the latter was likely to be also sizable – and it is.
Let’s take a look at the charts starting with the USD Index (charts courtesy of http://stockcharts.com).
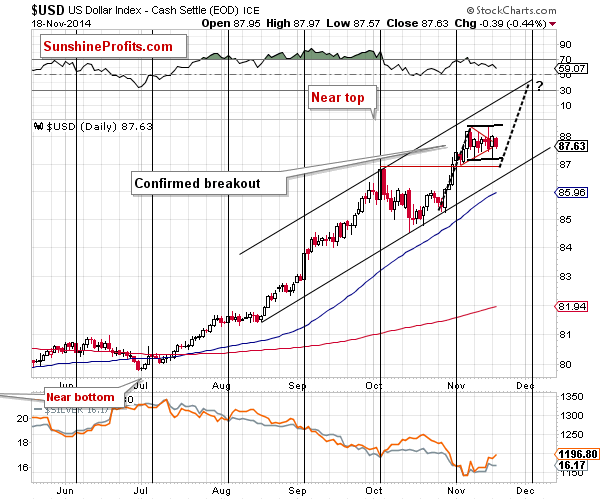
The USD Index declined once again yesterday, and while it’s once again within the triangle pattern, it could be the case that the pattern is actually a flag (marked with black, solid lines). The implications are generally the same (flag is also a continuation pattern), but in this case we will not have a breakout or breakdown until the USD moves approximately below or above its most recent highs or lows, respectively.
The downside is limited in case of a breakdown, and the upside is visibly higher in case of a breakout. If we see a move similar to the one that preceded the recent consolidation, then we could see a move close to the 89 level that would materialize in the first part of December. This scenario seems quite likely also given the resistance line that would be reached (it would simply “fit”) and the cyclical turning point – we are likely to see at least a local top close to it.
We could see a small move lower before the rally starts, though. This means that the above doesn’t invalidate our previous outlook and price targets for the precious metals sector.
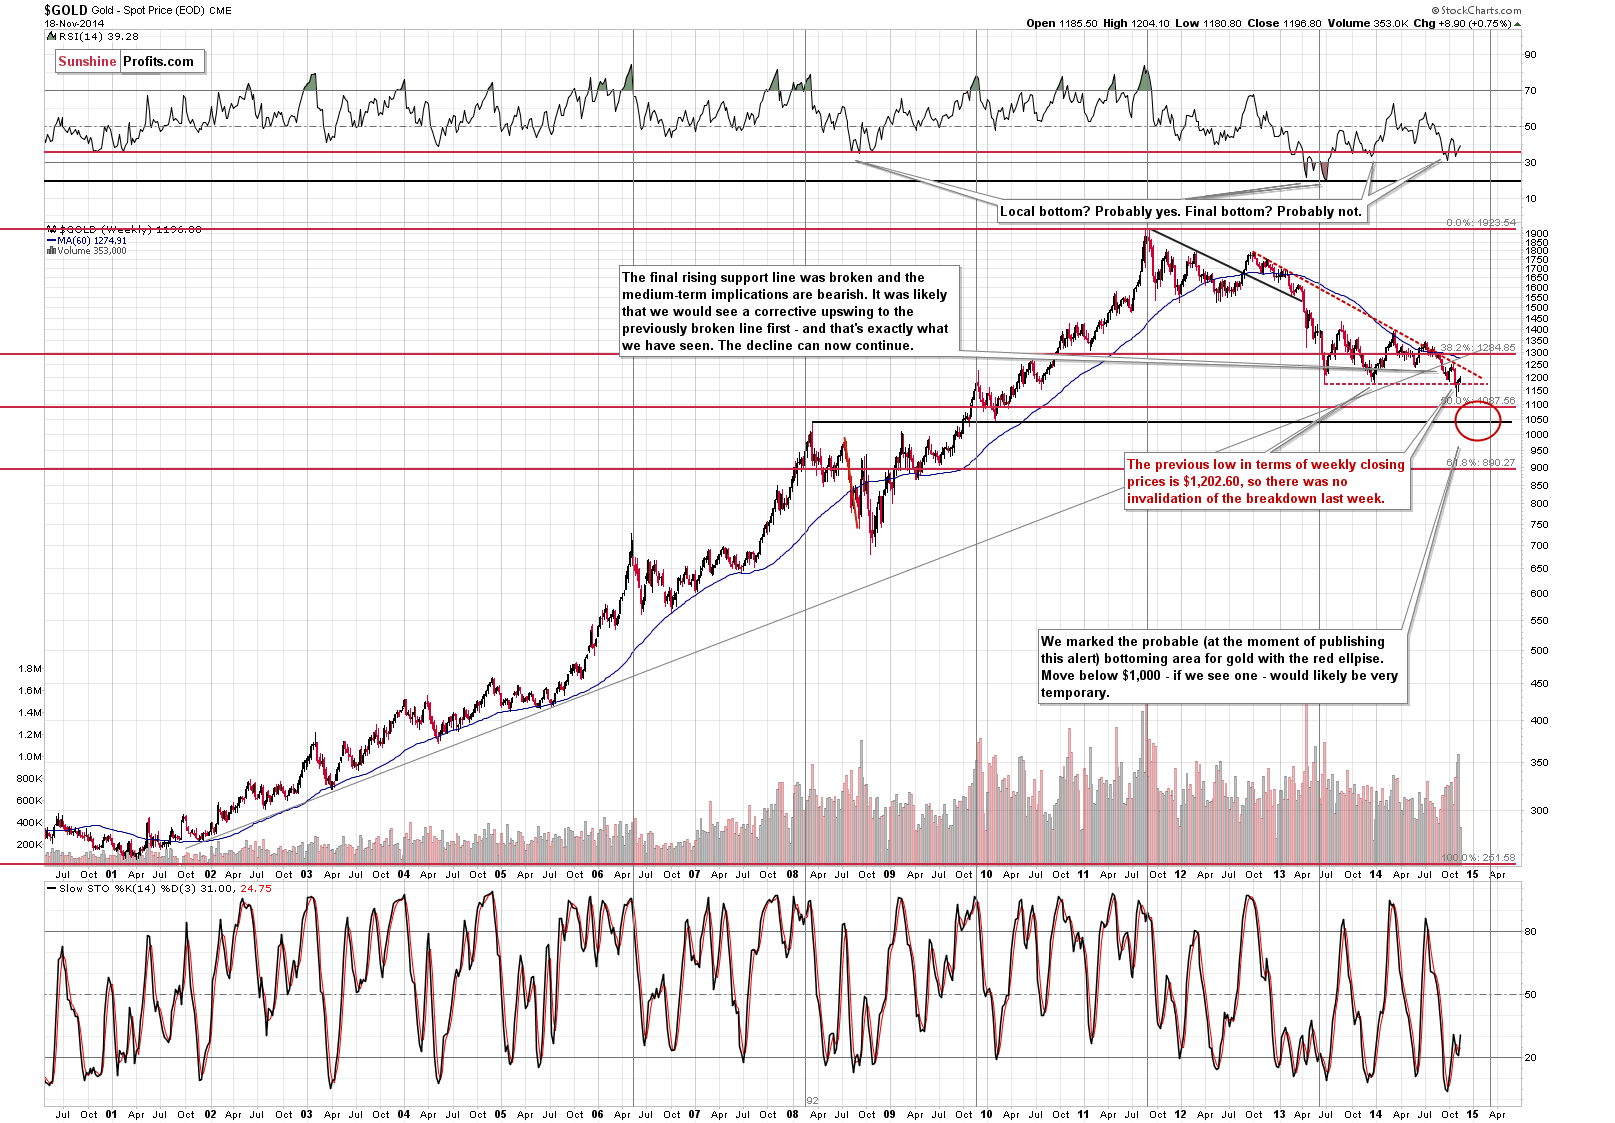
Let’s start talking about gold by emphasizing that the medium-term trend remains down, as gold is visibly below the declining dashed resistance line. The next big move, therefore, is likely to be to the downside.
What about the short term?
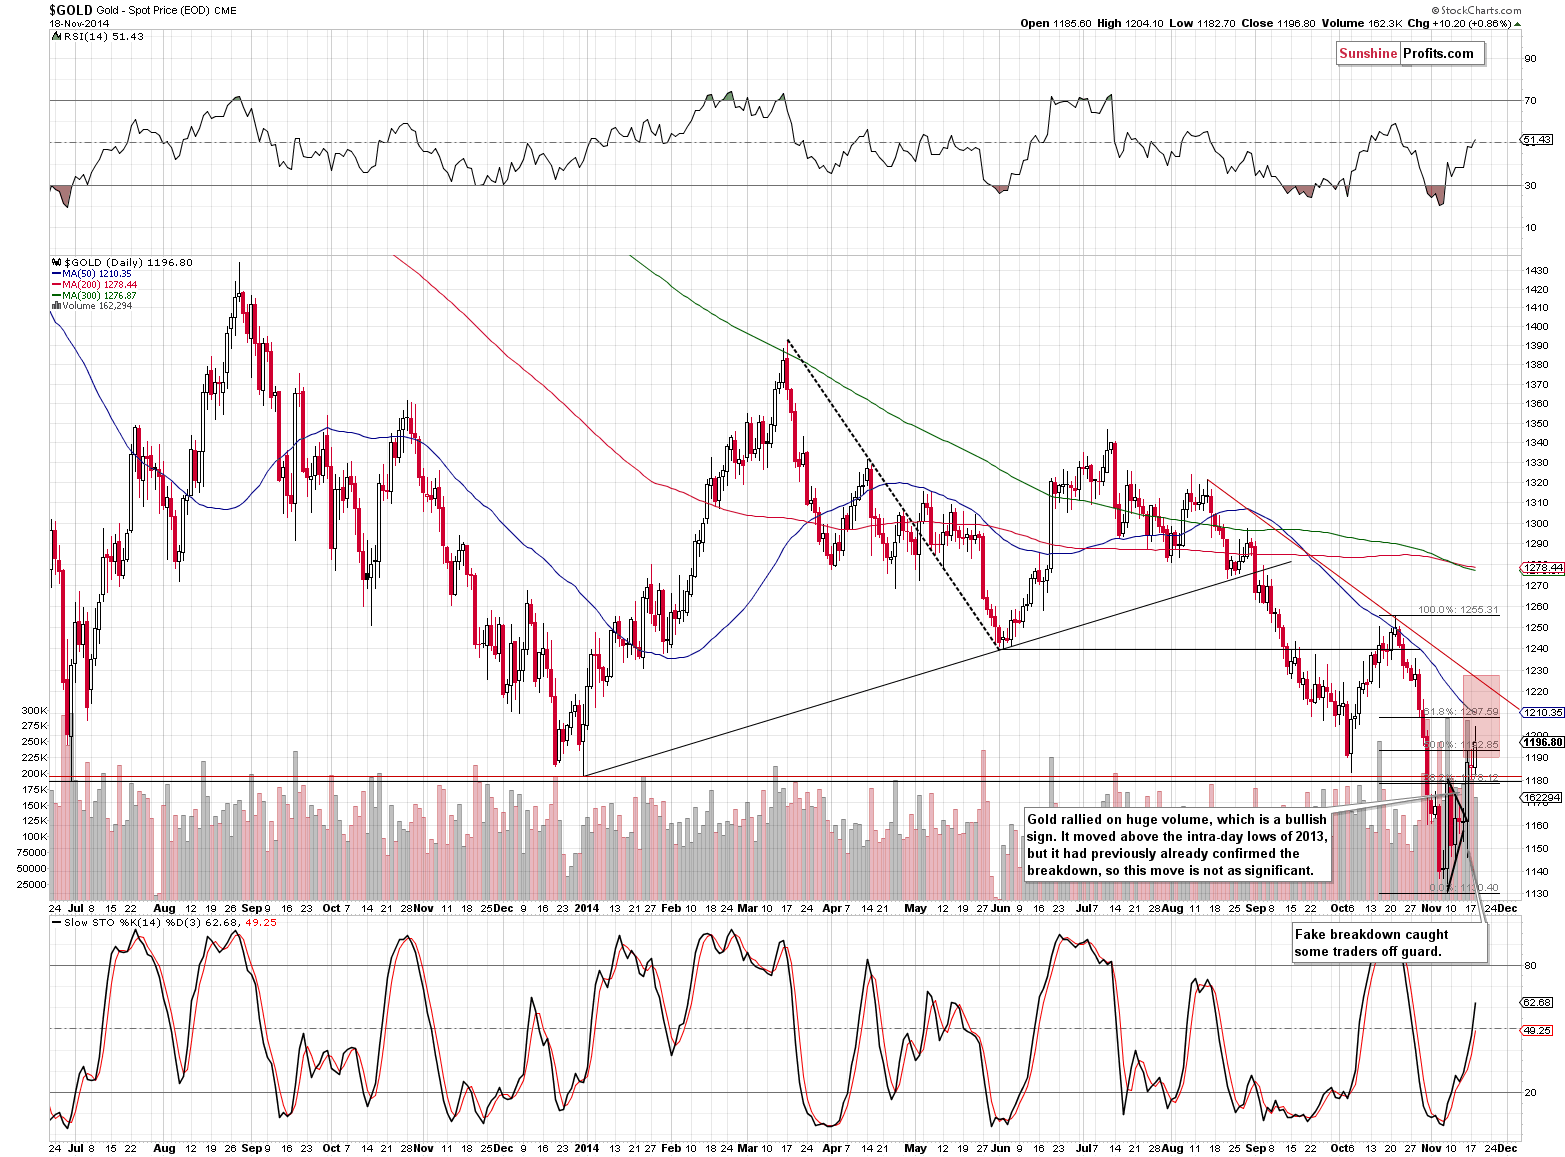
Gold has moved higher and it remains in our target area, but it hasn’t moved to any of the 2 resistance levels that we featured previously (61.8% Fibonacci retracement level and the declining red resistance line), so it seems that the rally is not over just yet.
Yesterday’s comments remain up-to-date:
(…) after such a sizable daily rally on strong volume, we can expect some more strength in the coming day(s). So, how high can gold go? To the following resistance levels, of course. The next one is the 61.8% Fibonacci retracement, and a bit higher we have the declining short-term resistance line. It seems likely to us that one of them will stop the rally, as they more or less correspond to the support levels in the USD Index. Which of them is more likely? It’s a touch call at this time – it seems that focusing on other markets / ratios and waiting for a confirmation is a good idea at this time.
The situation in the silver market remains unchanged as well.
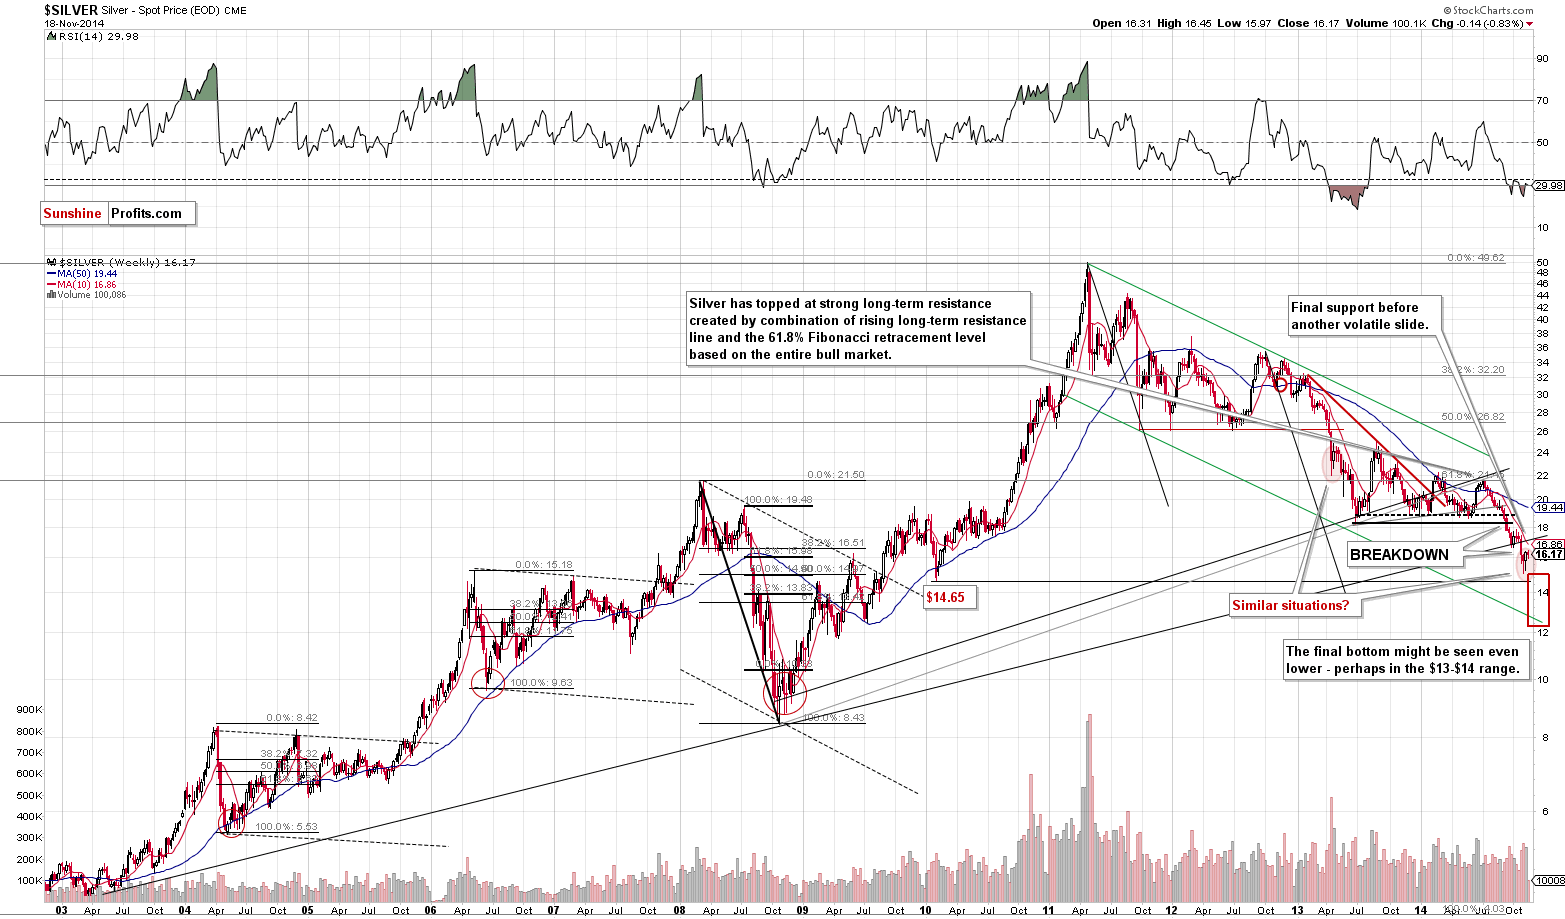
From the long-term perspective, the consolidation seems to continue, which is in tune with what we saw in April 2013. The analogy to this month has bearish implications as back then declines followed. Please note that silver spent a few weeks trading back and forth before its decline continued, so just because silver is not moving lower again is not concerning.
Having said that, let’s take a look at gold stocks.
In yesterday’s alert we wrote the following:
Gold miners have their resistance level relatively high, but since they are ones that have recently dropped particularly significantly, it’s no wonder that the correction is also big.
(…)
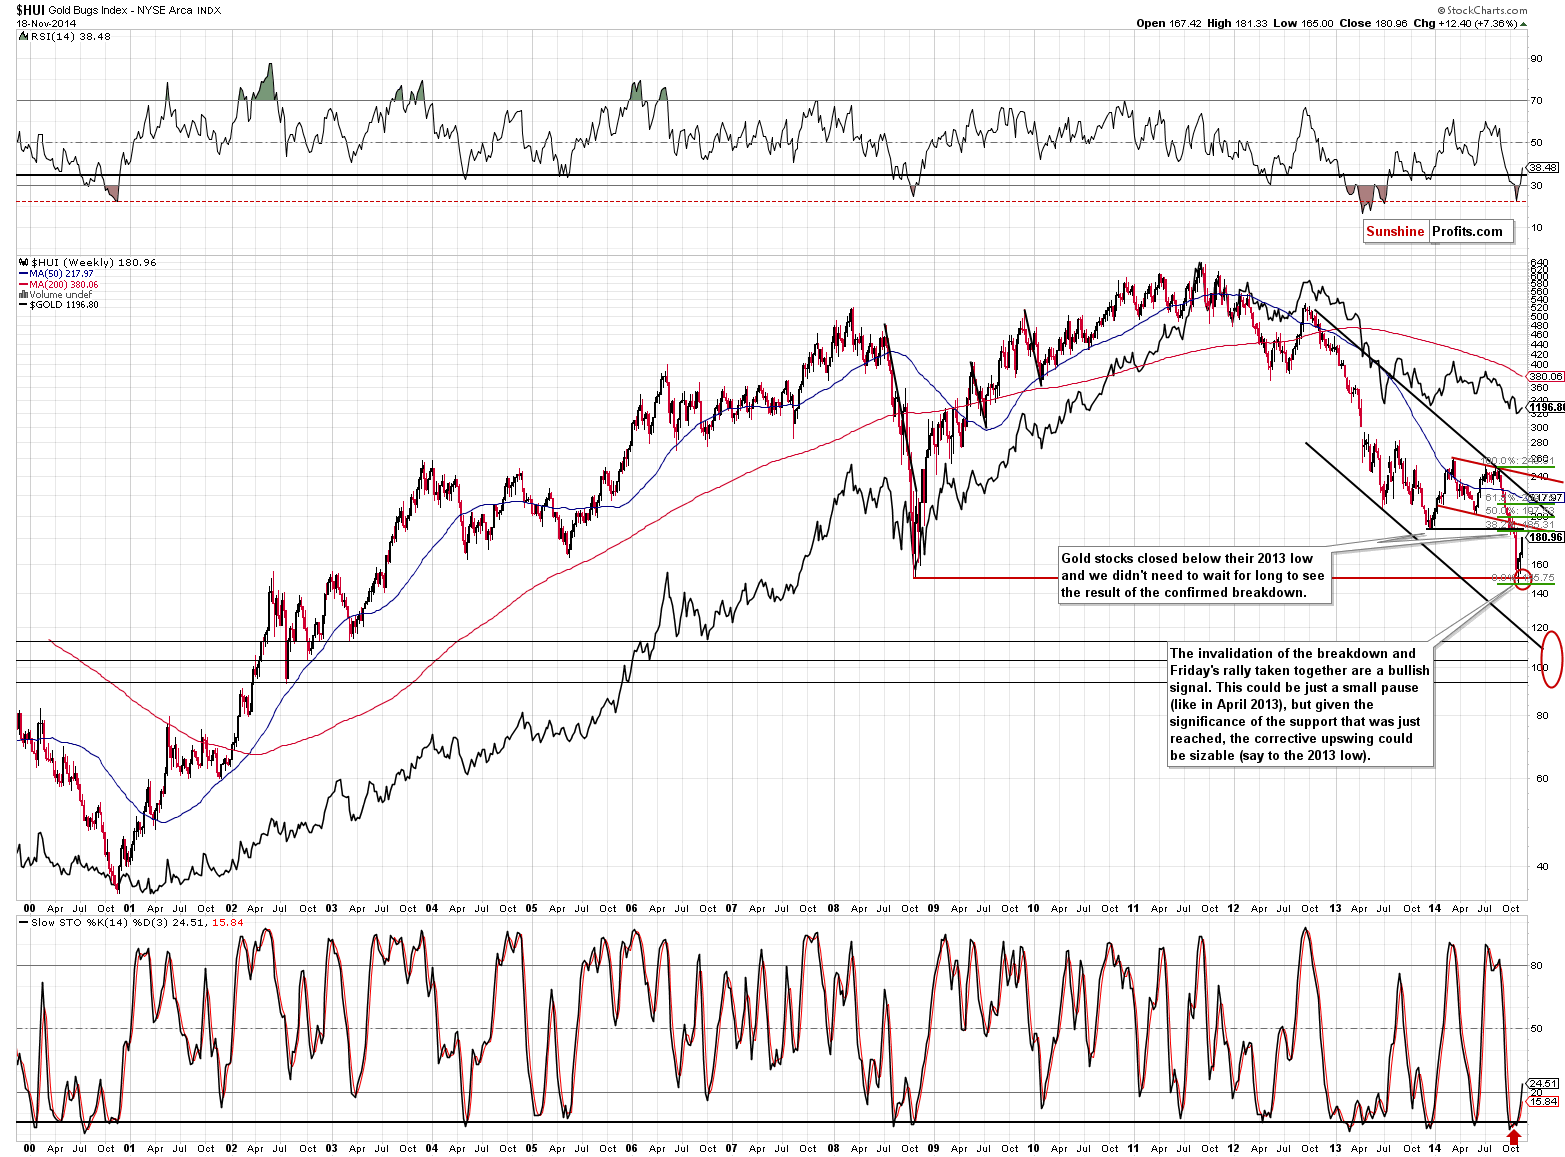
Gold stocks moved higher last week after reaching our initial target area but that’s no proof that the decline is completely over. During the 2008 decline there were sharp corrective upswings as well, but they didn’t mean that the decline was over. The current decline has been significant, so a corrective upswing (a pause within the decline) would be something normal.
How high could gold stocks go before the decline is resumed? It’s a tough call as the market has been very volatile lately, but at this time we wouldn’t rule out a move back to the previously broken support at the 2013 low. The 38.2% Fibonacci retracement based on the recent decline is very close to it, so it seems quite likely that the 185-190 level would stop a rally.
While the above remains up-to-date, the particularly interesting fact is that the GDX ETF is already at its 2013 low, but the XAU and HUI indices are not. The latter are more important than the ETF, so we don’t view the move to the 2013 low as being completed.
However, as you can see on the above chart, the resistance is very close – about 4-9 index points higher in the HUI Index. This means that we will probably consider opening short positions shortly. We want to see a confirmation in volume and perhaps an intra-day reversal before we jump back into the short positions, though.
Summing up, the precious metals sector continues to correct its recent downswing, while remaining in the medium-term downtrend, and it seems that it will move a little higher before turning south again. The move higher doesn’t have to be significant anymore – it seems that most of what was likely to happen is already behind us.
As always, we will continue to monitor the situation and report to you – our subscribers – accordingly. We will aim to multiply the recent profits and will quite likely open another trading position shortly – stay tuned.
To summarize:
Trading capital (our opinion): No positions
Long-term capital (our opinion): No positions
Insurance capital (our opinion): Full position
Please note that a full position doesn’t mean using all of the capital for a given trade. You will find details on our thoughts on gold portfolio structuring in the Key Insights section on our website.
As a reminder – “initial target price” means exactly that – an “initial” one, it’s not a price level at which we suggest closing positions. If this becomes the case (like it did in the previous trade) we will refer to these levels as levels of exit orders (exactly as we’ve done previously). Stop-loss levels, however, are naturally not “initial”, but something that, in our opinion, might be entered as an order.
Our preferred ways to invest in and to trade gold along with the reasoning can be found in the how to buy gold section. Additionally, our preferred ETFs and ETNs can be found in our Gold & Silver ETF Ranking.
As always, we'll keep you - our subscribers - updated should our views on the market change. We will continue to send out Gold & Silver Trading Alerts on each trading day and we will send additional Alerts whenever appropriate.
The trading position presented above is the netted version of positions based on subjective signals (opinion) from your Editor, and the automated tools (SP Indicators and the upcoming self-similarity-based tool).
As a reminder, Gold & Silver Trading Alerts are posted before or on each trading day (we usually post them before the opening bell, but we don't promise doing that each day). If there's anything urgent, we will send you an additional small alert before posting the main one.
=====
Latest Free Trading Alerts:
Yesterday, we saw Bitcoin fluctuate above and below $400 only to end the day more or less where it had started it. Today, the move has been to the downside. Is it time to go short?
Bitcoin Trading Alert: Did We Just See an Important Slump?
Yesterday, official data showed that annualized Japan’s gross domestic product dropped by 1.6% in the third quarter, missing economists‘ forecast of a 2.3% growth and following a 7.3% drop in the second quarter, which puts the country in a recession. In these circumstances USD/JPY extended gains and hit a fresh multi-year high of 117.04. How high could the exchange rate go?
Forex Trading Alert: How High Could USD/JPY Go?
=====
Hand-picked precious-metals-related links:
India readies draconian gold import rules
Silver Physical Demand Forecast to Drop 6.7% in ’14: GFMS
Ukraine Admits Its Gold Is Gone: "There Is Almost No Gold Left In The Central Bank Vault"
=====
In other news:
Fed minutes back on market's radar
Risk of triple-dip recession in euro zone: S&P
Bitcoin: One year on from peak price, what does the future hold?
=====
Thank you.
Sincerely,
Przemyslaw Radomski, CFA
Founder, Editor-in-chief
Gold & Silver Trading Alerts
Forex Trading Alerts
Oil Investment Updates
Oil Trading Alerts

