
Briefly: In our opinion no speculative positions are currently justified from the risk/reward perspective.
Gold started this week with a pause, but mining stocks moved higher. The last time we saw this kind of outperformance, it signaled higher precious metals prices in the following days. Will it be the case also this time?
In our opinion it seems likely. In short, the pause didn’t invalidate anything we wrote yesterday, and since yesterday’s alert was quite big and covered many points, we will quote some of them today.
Let’s start with the USD Index chart (charts courtesy of http://stockcharts.com) which features a small change.
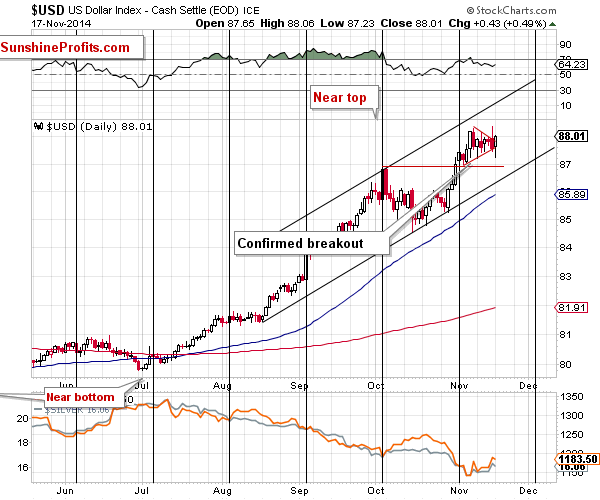
The USD Index moved below the lower border of the triangle pattern, but ultimately moved up and ended the session above the upper border. This means we have just seen a breakout, but it was a rather small one and is unconfirmed. Consequently, it doesn’t have meaningful implications just yet. The outlook is now more bullish than it was yesterday, though. This doesn’t make us open long positions in the precious metals sector yet, even though metals are more likely than not to move higher in the very short term.
The following remains up-to-date:
If the USD Index breaks down from the triangle patter, it’s not likely to fall much further – there are short-term support levels at the Oct. high and the rising black support line. We don’t expect the USD Index to move visibly below the 86.4 - 87 area. We would expect the rally to resume after this area is reached.
On the other hand, if the USD Index does indeed rally right away, then it could move much higher before it really tops (above 89).
Speaking of precious metals, let’s look at gold.
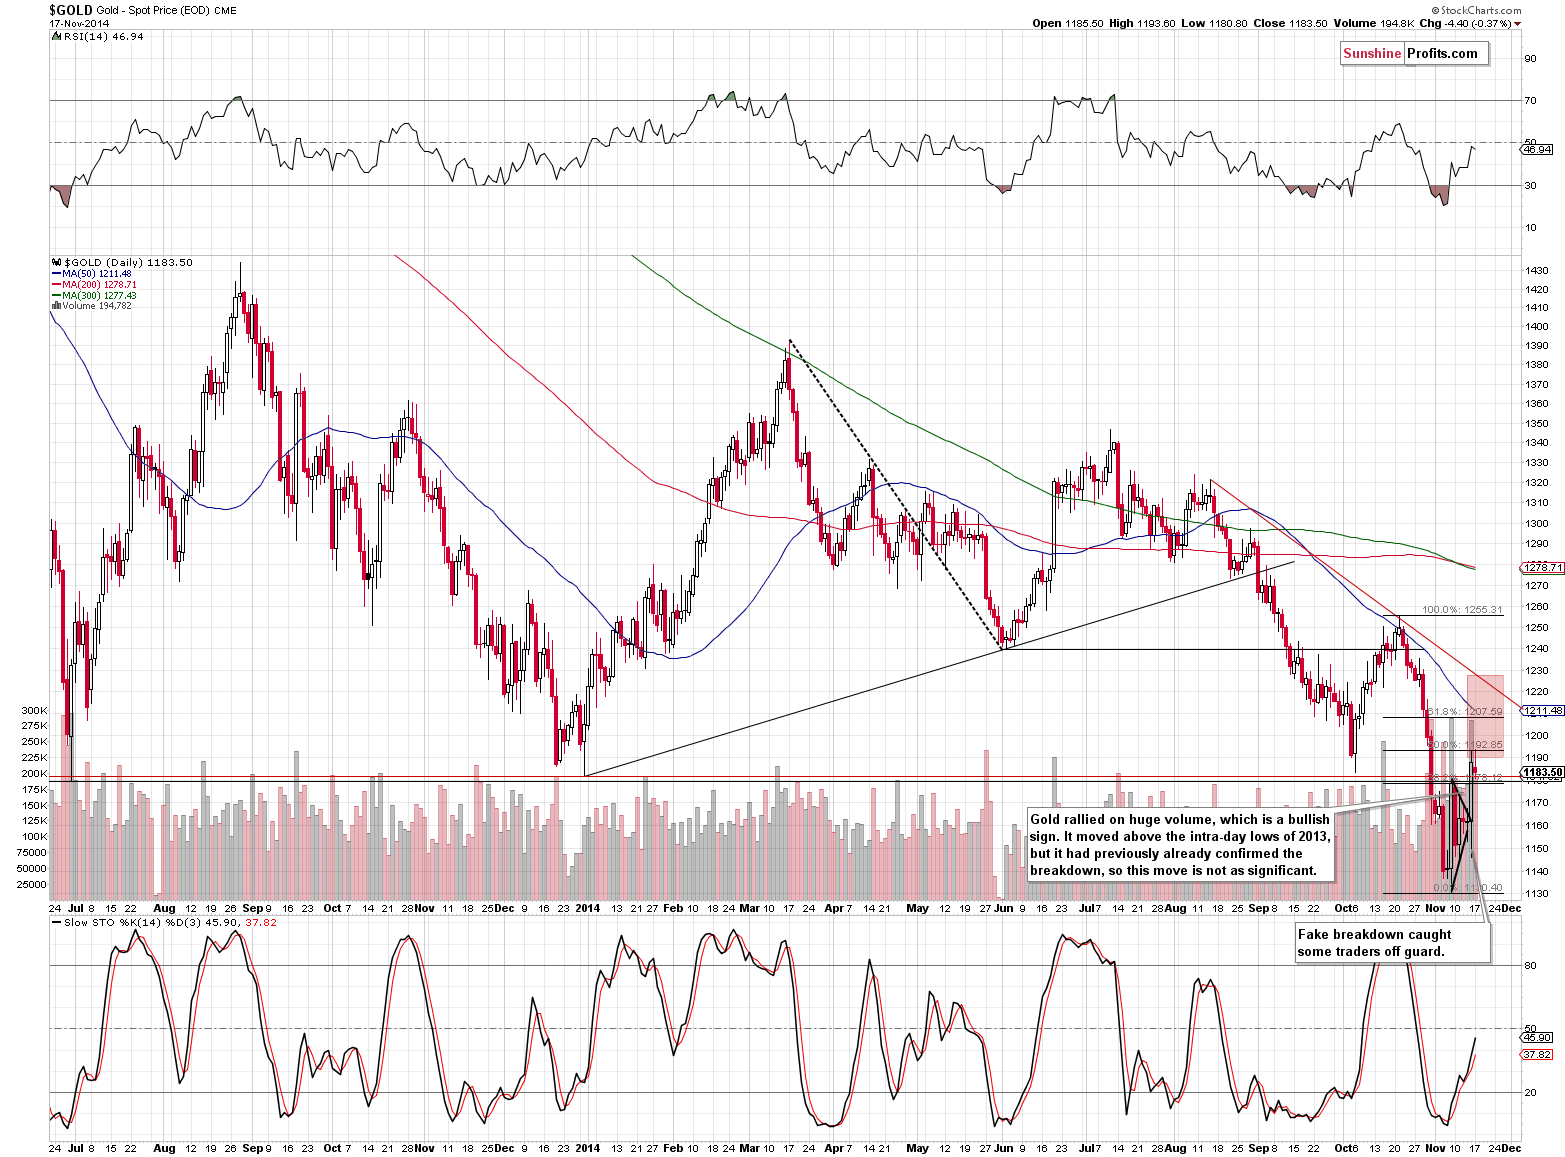
The yellow metal corrected some of its previous gains, which is something natural, especially given the dollar’s move higher.
Yesterday’s comments remain up-to-date:
On the short-term chart we see that gold corrected to another important retracement level – the 50% one. Is it enough to stop the rally? It’s certainly possible, but after such a sizable daily rally on strong volume, we can expect some more strength in the coming day(s). So, how high can gold go? To the following resistance levels, of course. The next one is the 61.8% Fibonacci retracement, and a bit higher we have the declining short-term resistance line. It seems likely to us that one of them will stop the rally, as they more or less correspond to the support levels in the USD Index. Which of them is more likely? It’s a touch call at this time – it seems that focusing on other markets / ratios and waiting for a confirmation is a good idea at this time.
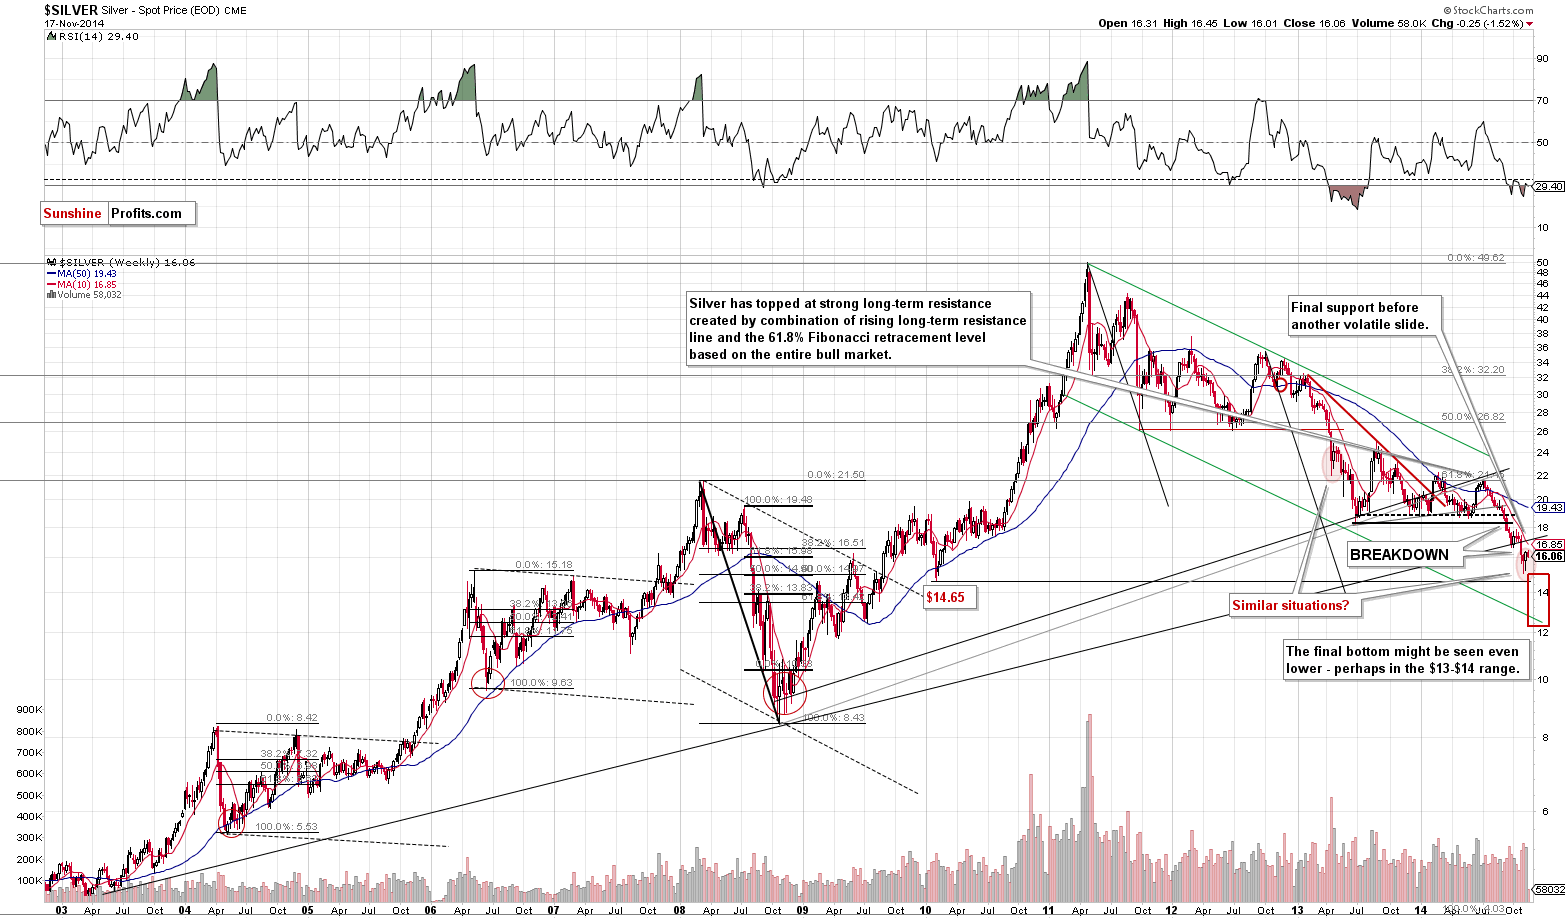
Let’s move to silver.
Unsurprisingly, the situation in silver hasn’t changed either, and what we wrote about it in yesterday’s alert remains up-to-date:
From the long-term perspective, the consolidation seems to continue, which is in tune with what we saw in April 2013. The analogy to this month has bearish implications as back then declines followed. Please note that silver spent a few weeks trading back and forth before its decline continued, so just because silver is not moving lower again is not concerning.
Having said that, let’s take a look at gold stocks.
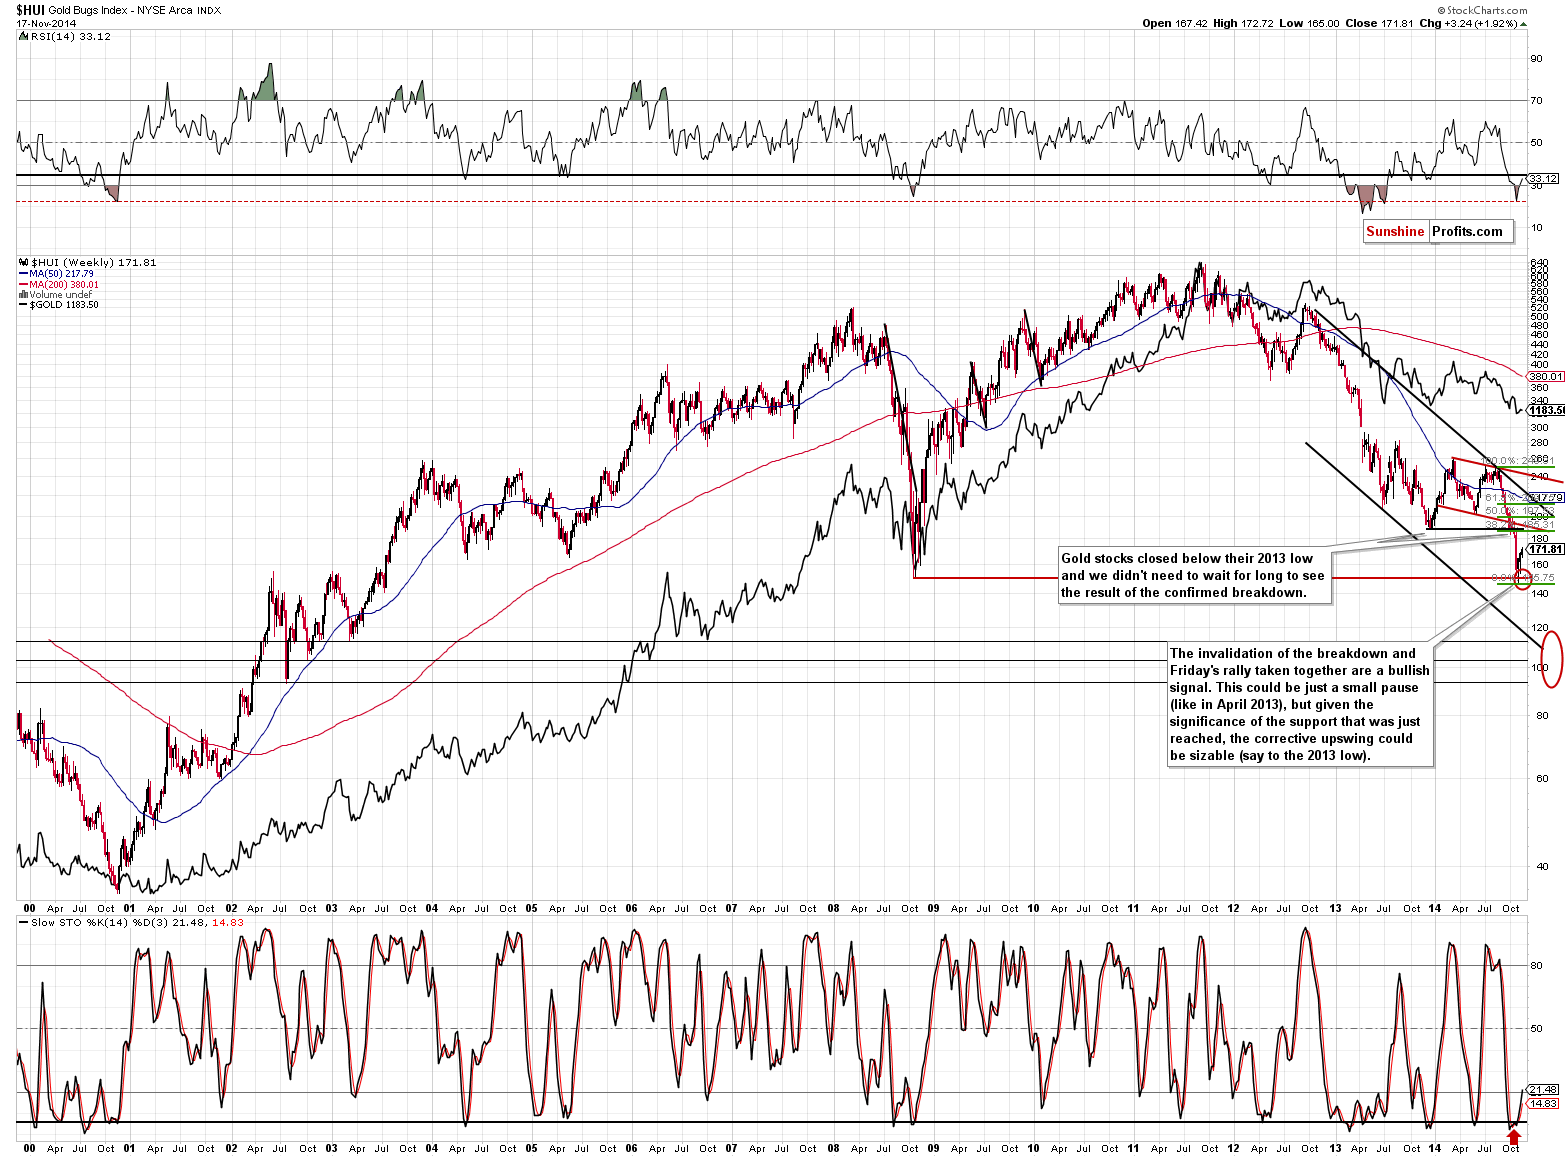
Gold stocks moved higher yesterday, which is another subtle sign that the entire sector is not done rallying, as it’s a sign of strength. Not only have miners managed not to decline along with falling gold and the rallying USD Index, but they actually closed higher than on Friday. The very short-term outlook remains positive and so our previous comments remain valid:
Gold miners have their resistance level relatively high, but since they are ones that have recently dropped particularly significantly, it’s no wonder that the correction is also big.
(…)
Gold stocks moved higher last week after reaching our initial target area but that’s no proof that the decline is completely over. During the 2008 decline there were sharp corrective upswings as well, but they didn’t mean that the decline was over. The current decline has been significant, so a corrective upswing (a pause within the decline) would be something normal.
How high could gold stocks go before the decline is resumed? It’s a tough call as the market has been very volatile lately, but at this time we wouldn’t rule out a move back to the previously broken support at the 2013 low. The 38.2% Fibonacci retracement based on the recent decline is very close to it, so it seems quite likely that the 185-190 level would stop a rally.
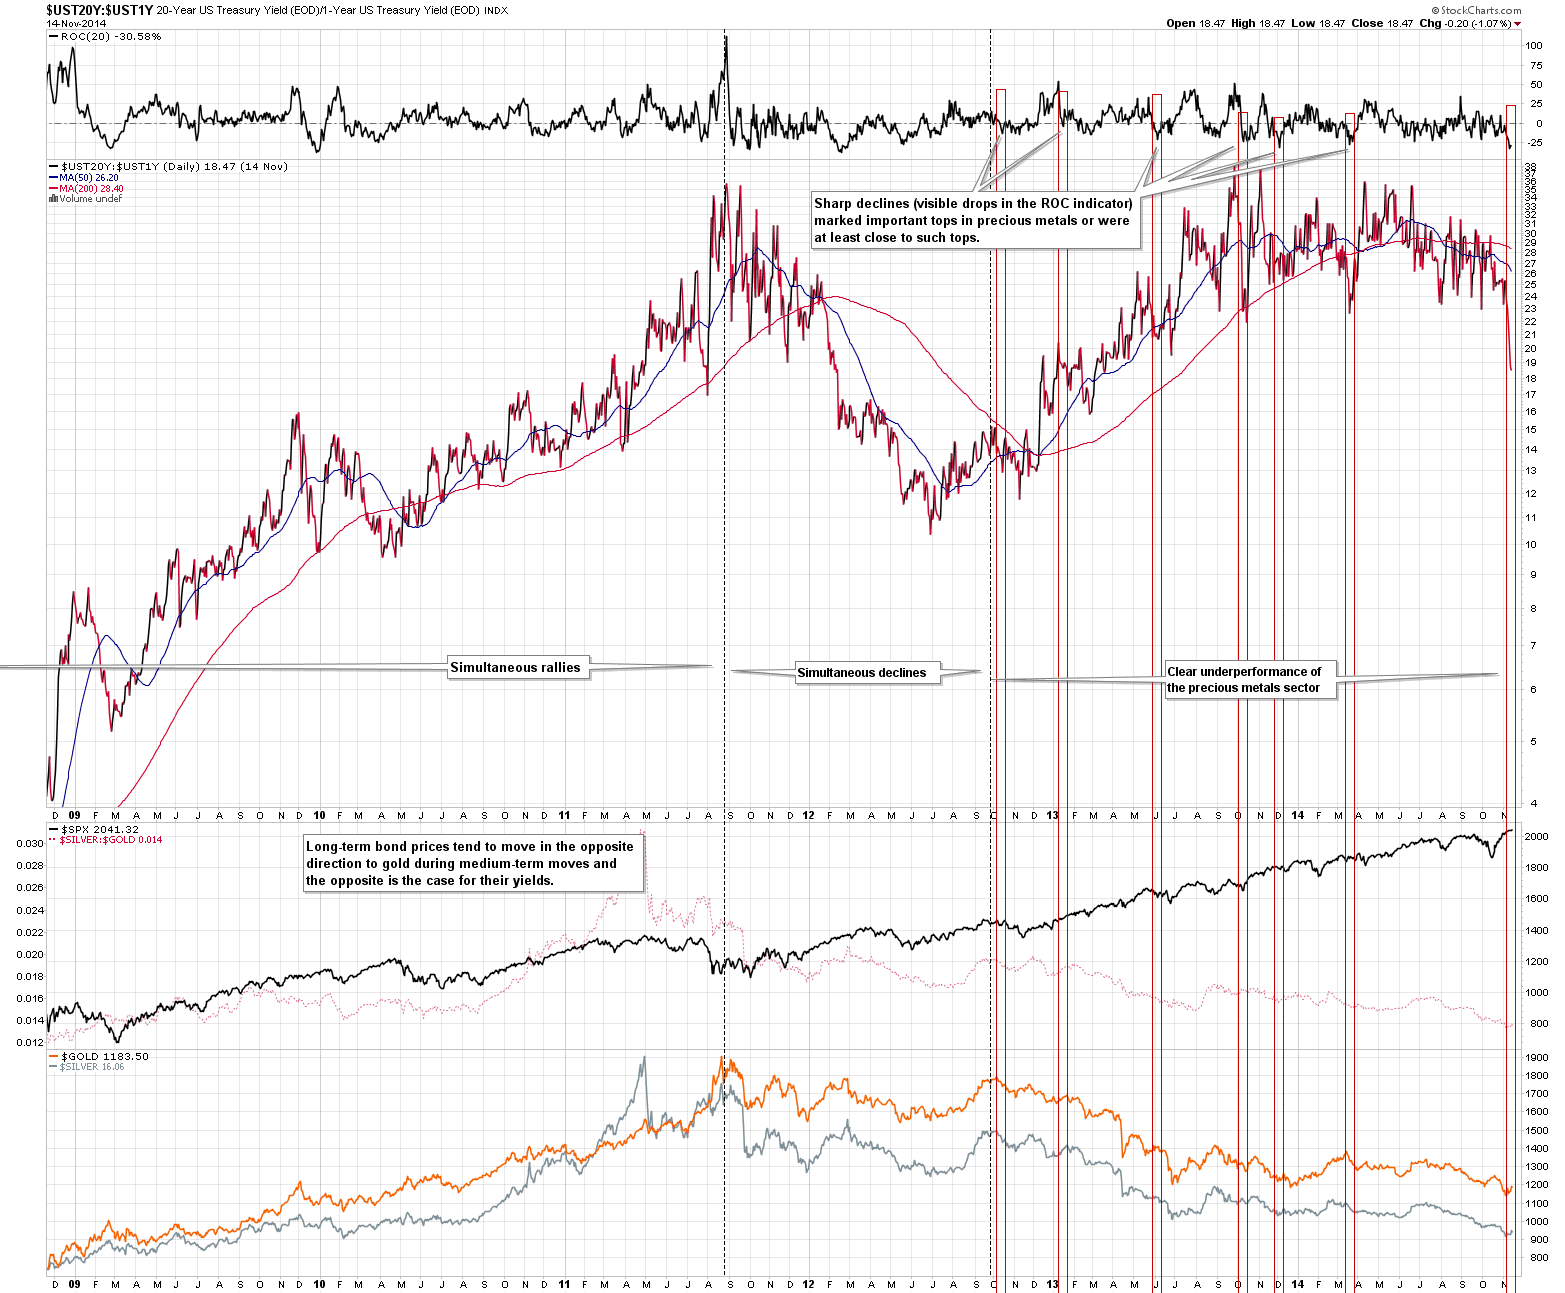
Yesterday’s alert featured a few ratios and we would like to feature one in today’s alert as well. This time we’ll focus on the bond market and more precisely on the ratio between yields of 20-year and 1-year treasuries. In today’s globalized economy and super-connected financial markets it’s tough to analyze one market in absolute separation from other ones. How is gold connected to the bond market? For instance both markets can be seen by investors as a “safe haven” when stocks plunge. Whether that is true is a different matter, but we can use this connection to draw some conclusions for the gold market.
First of all, the above chart shows that over the long run gold was positively correlated to the ratio – they both rallied until mid-2011 and then declined until mid-2012. The real difference started in late 2012, when the ratio recovered, but gold didn’t. In this way gold started to show weakness and it continues to do so until this day. The bad news is that the ratio seems to be starting another decline, which makes another bigger decline in gold more likely.
The second implication is more medium-term or short-term in nature. Please note that sudden declines in the value of ratio meant that gold was either at a local top or about to form one. We saw such a decline in the ratio recently, and this does not bode well for gold in the following weeks. It has little implications for gold for the next several days, though. Overall, the above chart confirms what we think about the gold market based on other charts.
All in all, we can summarize the situation in the precious metals market in the same way as we did yesterday:
Summing up, the precious metals sector continues to correct its recent downswing, while remaining in the medium-term downtrend, and it seems that it will move a bit higher before turning south again.
As always, we will continue to monitor the situation and report to you – our subscribers – accordingly. We will aim to multiply the recent profits and will quite likely open another trading position shortly – stay tuned.
To summarize:
Trading capital (our opinion): No positions
Long-term capital (our opinion): No positions
Insurance capital (our opinion): Full position
Please note that a full position doesn’t mean using all of the capital for a given trade. You will find details on our thoughts on gold portfolio structuring in the Key Insights section on our website.
As a reminder – “initial target price” means exactly that – an “initial” one, it’s not a price level at which we suggest closing positions. If this becomes the case (like it did in the previous trade) we will refer to these levels as levels of exit orders (exactly as we’ve done previously). Stop-loss levels, however, are naturally not “initial”, but something that, in our opinion, might be entered as an order.
Our preferred ways to invest in and to trade gold along with the reasoning can be found in the how to buy gold section. Additionally, our preferred ETFs and ETNs can be found in our Gold & Silver ETF Ranking.
As always, we'll keep you - our subscribers - updated should our views on the market change. We will continue to send out Gold & Silver Trading Alerts on each trading day and we will send additional Alerts whenever appropriate.
The trading position presented above is the netted version of positions based on subjective signals (opinion) from your Editor, and the automated tools (SP Indicators and the upcoming self-similarity-based tool).
As a reminder, Gold & Silver Trading Alerts are posted before or on each trading day (we usually post them before the opening bell, but we don't promise doing that each day). If there's anything urgent, we will send you an additional small alert before posting the main one.
=====
Latest Free Trading Alerts:
Although crude oil hit a fresh four-year low on Friday, the commodity rebounded sharply as upbeat U.S. data and speculations that OPEC countries may consider cutting output supported the price. As a result, light crude closed the day above $75 and invalidated the breakdown below important support lines. Is it enough to trigger a trend reversal?
Oil Trading Alert: Are Crude Oil’s Bears Over?
=====
Hand-picked precious-metals-related links:
CREDIT SUISSE: 'We Are Bearish Gold' (CS, GLD)
'Yes' vote in Swiss referendum not certain to lift gold prices-Deutsche Bank
Gold: In the shadow of macro factors
Electricity From Fuel Cells Sparking Demand for Platinum: Energy
=====
In other news:
Icahn expects major stocks correction in 3 to 5 years
ECB ‘very likely’ to buy sovereign bonds: Ex-Member
=====
Thank you.
Sincerely,
Przemyslaw Radomski, CFA
Founder, Editor-in-chief
Gold & Silver Trading Alerts
Forex Trading Alerts
Oil Investment Updates
Oil Trading Alerts

