
Briefly: In our opinion speculative long positions (full) in gold, silver and mining stocks are justified from the risk/reward perspective.
Yesterday’s trading can be described as a pause. The preceding price moves suggest that a good reason for a pause in the gold market was a pause in the USD Index. There are many factors that gold & silver investors and traders need to keep in mind, but the key one is the USD Index – and that’s what we’ll focus on in today’s alert.
Let’s take a look at the USD Index from a few perspectives and see if implications from them confirm each other (charts courtesy of http://stockcharts.com).
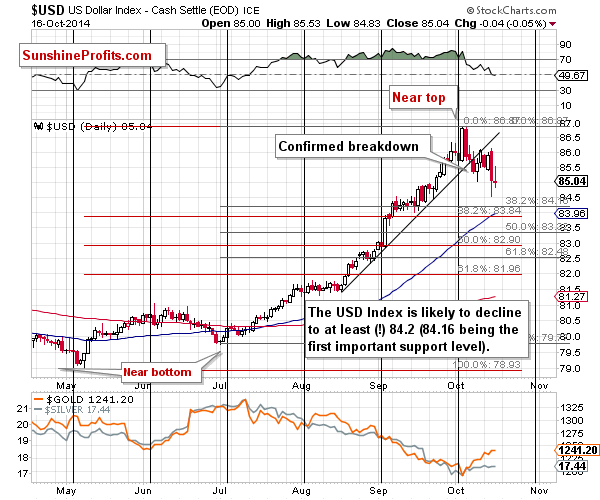
From the short-term perspective, nothing really changed. The USD Index is more or less where it closed on Wednesday, so what we wrote in yesterday’s alert remains up-to-date:
Firstly, the USD Index moved lower but not low enough. It would still need to move lower in order to reach even the highest of the short-term Fibonacci support levels. Consequently, it seems likely that it will decline further – at least to 84.2 or so.
As far as targets are concerned, our previous comments on the USD Index remain up-to-date:
How low can the USD Index move during the corrective downswing? It could decline to 82 (81.96 is the 61.8% Fibonacci retracement based on the May - October rally), but the decline could end as soon as the USD reaches 84.2 or so (84.16 is the 38.2% Fibonacci retracement based on the July – October rally). Either way, the USD Index is quite likely to decline at least by additional 1.4 index points, which is quite a lot. Even if the USD declines to 84.2 and bottoms, this decline would still be likely to trigger a bigger upswing in the precious metals sector.
Why? Because gold, silver, and mining stocks are negatively correlated with the dollar in the short term.
However, before moving on to the gold market, let’s check the big picture.
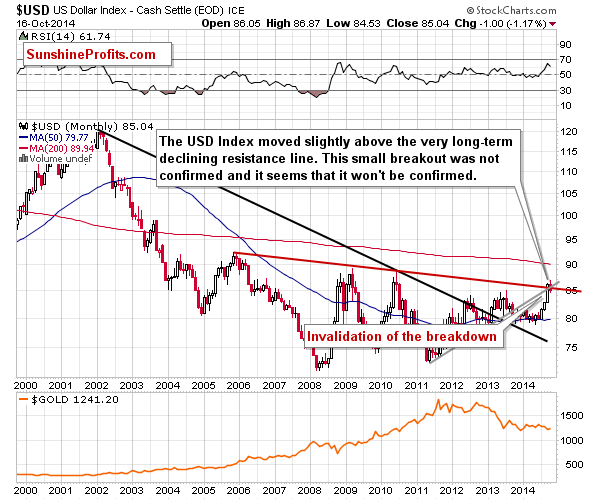
We have previously written about the move above the declining resistance line. We wrote that given the sharpness of the rally it was not likely that the breakout would be confirmed and we were expecting a corrective downswing.
The breakout has been invalidated and the implications are bearish.
We have the following 2 factors: even the highest of the Fibonacci retracement levels has not been reached yet, and the breakout above the long-term resistance line was invalidated. Is there a way to connect them?
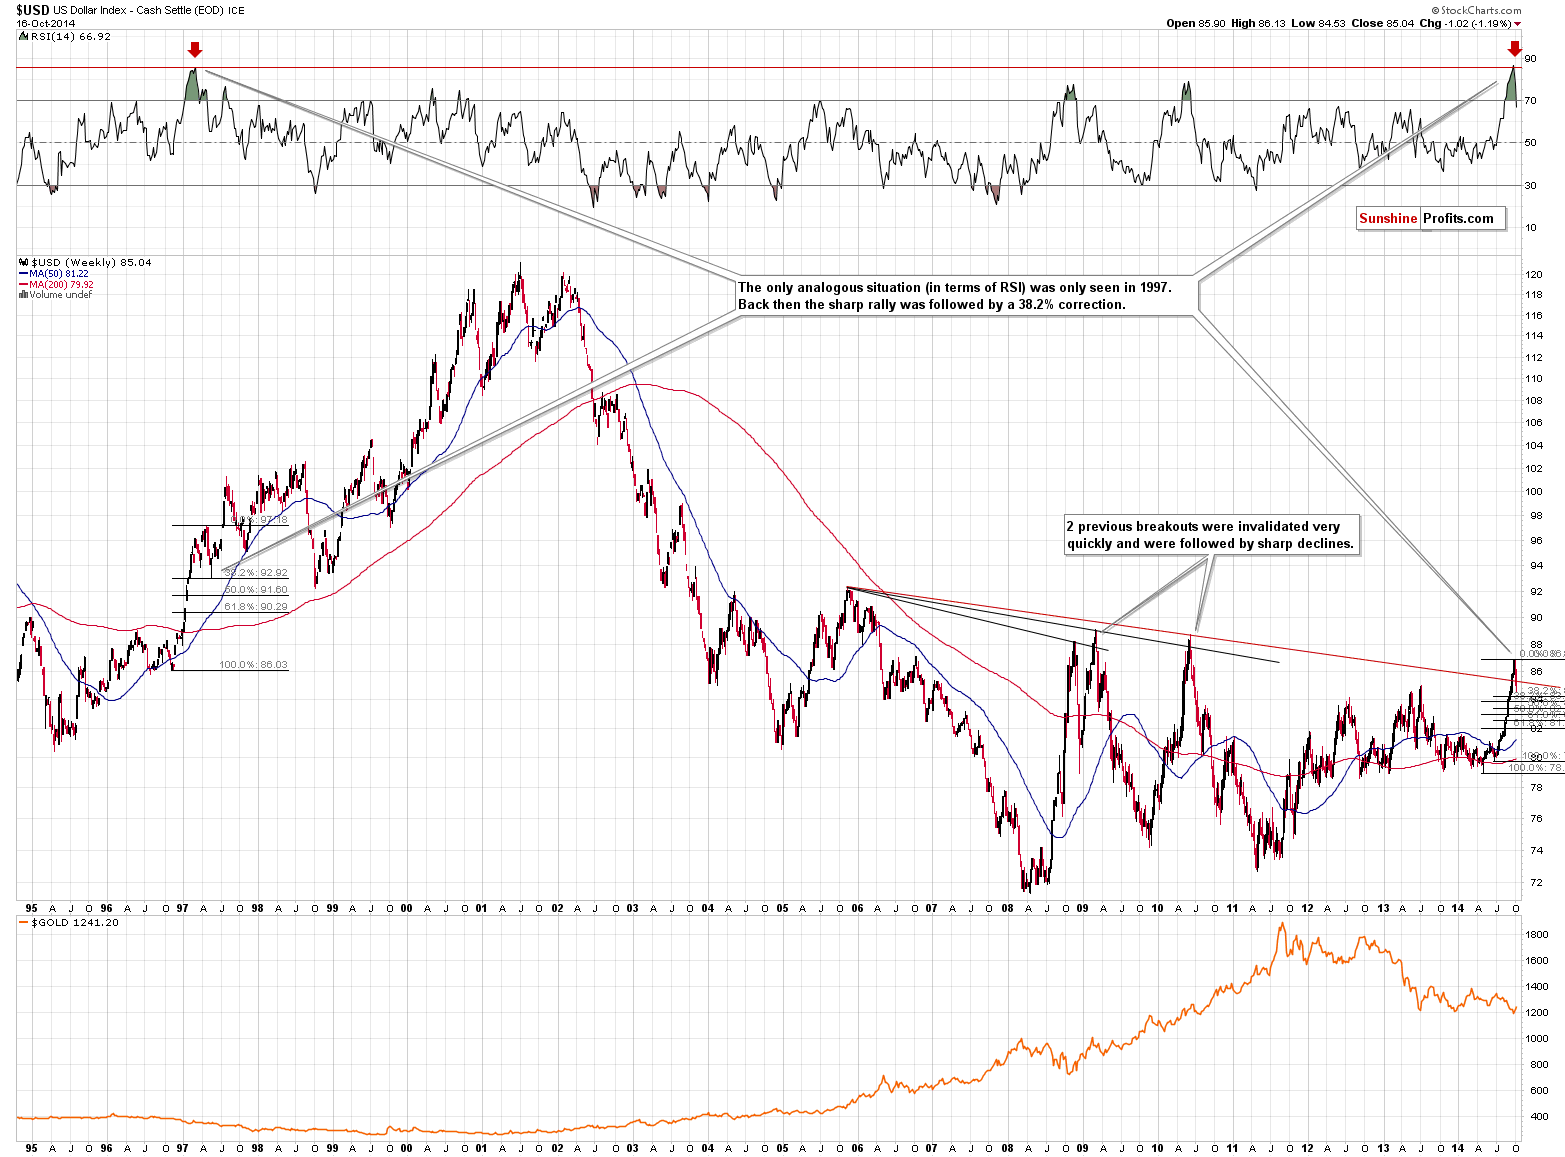
The above chart does just that. It turns out that when we take an even bigger perspective, we see that the previous analogous breakouts were invalidated rather quickly and declines followed. However, this time really is different because this time the rally was even sharper than it was in the previous cases when we saw breakouts.
The time that was similar to what happened recently – as described by the RSI indicator – was in 1997. Back then the USD Index corrected exactly to the 38.2% Fibonacci retracement, which is what we have been expecting to see also this time. The long-term chart provides another reason for this scenario to materialize – after all history rhymes.
What does it all mean? That the corrective downswing in the USD Index is likely not over yet, but it seems likely that it will be over relatively soon. Consequently, it seems to make sense to assume that metals and miners will not rally much further before turning south again.
The long-term gold charts perfectly fits in with the above outlook.
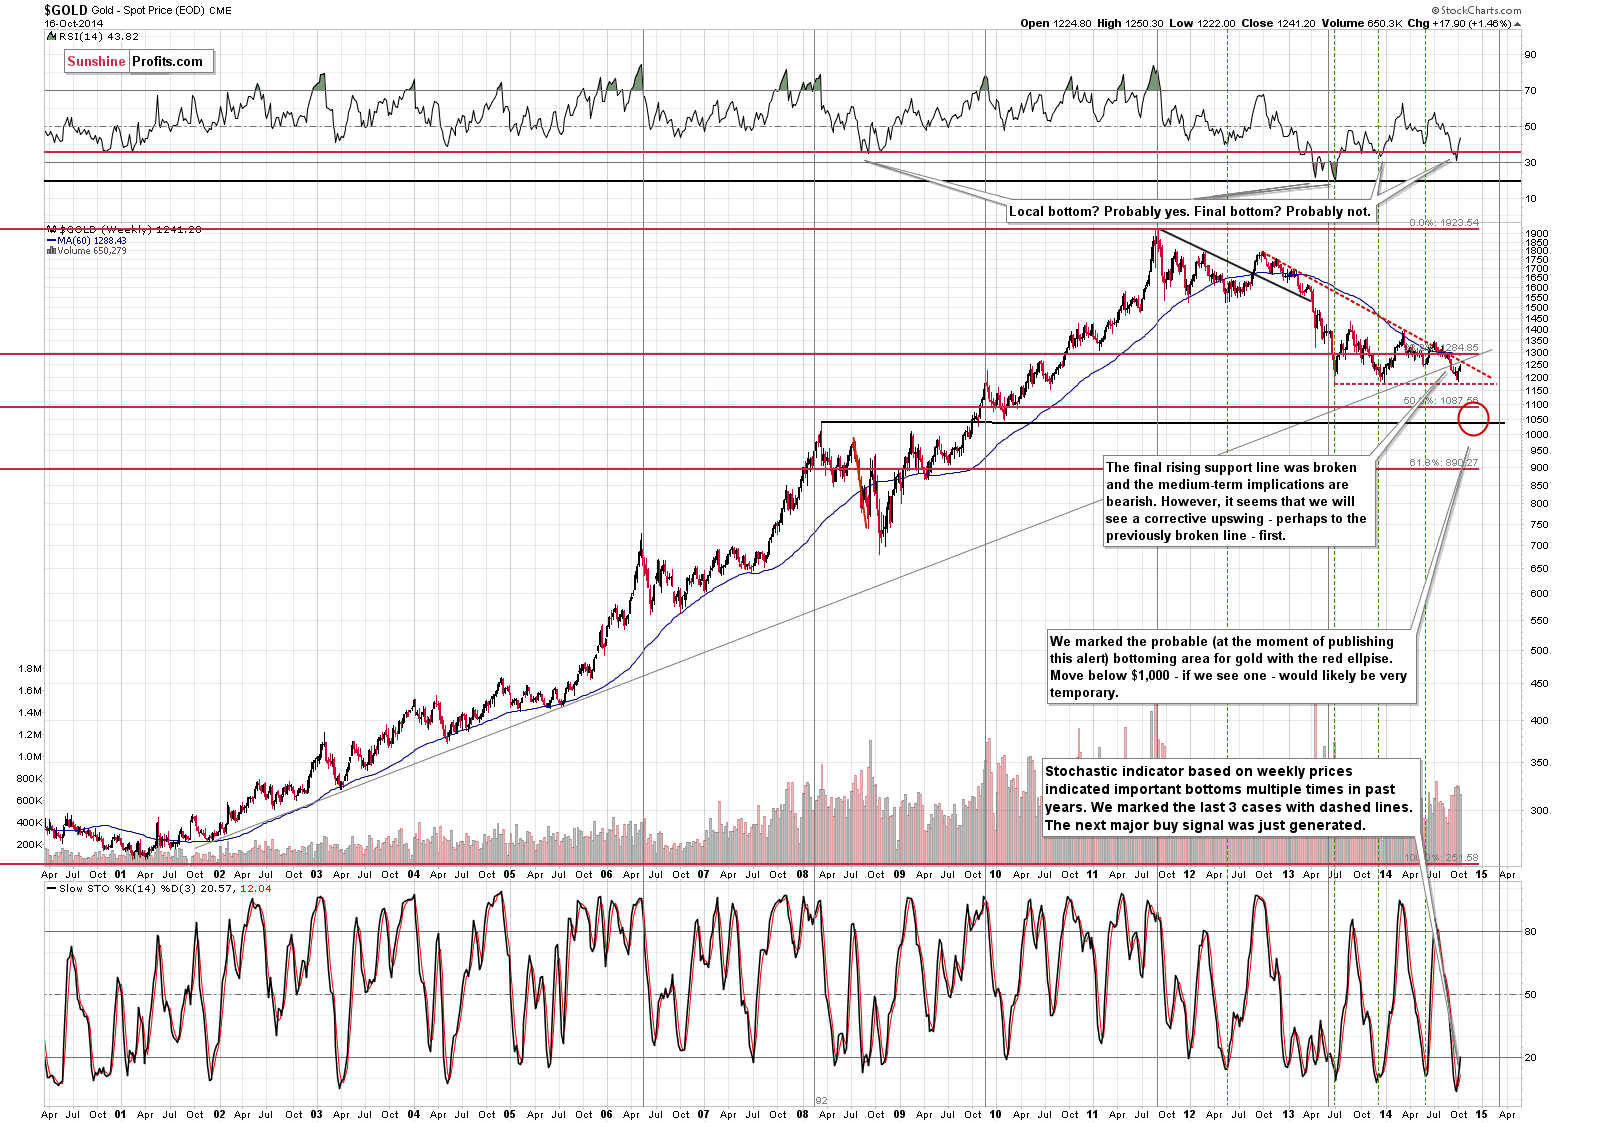
What we wrote yesterday is once again an appropriate description of what happened and why gold fits the outlook created by the USD Index:
(…) we can expect gold to move higher, at least until it reaches the combination of resistance lines. The lines intersect at approximately $1,260, and we can’t rule out a temporary move above this level (just like it was the case in the first week of July). At this time it seems likely that most of the rally is behind us but that it’s not completely over just yet.
In our opinion, it’s justified, from the risk/reward point of view, to place exit orders for the speculative long positions at the previously-mentioned initial target levels for silver and mining stocks, and place an exit order for gold at $1,257 (in other words, we aim to make the current profits from this trade even bigger).
Now, in the case gold moves to $1,257, it would seem a good idea to exit long positions in silver and mining stocks regardless of what levels they are at. The reason is that from that perspective betting on higher prices would simply seem too risky given the smaller upside potential (in the short term).
As always, we will keep you – our subscribers – updated and informed.
To summarize:
Trading capital (our opinion):
It seems that having speculative (full) long positions in gold, silver and mining stocks is a good idea:
- Gold: stop-loss: $1,172, exit order: $1,257, stop loss for the UGLD ETF $11.29, exit order for the UGLD ETF $13.75
- Silver: stop-loss: $16.47, exit order: $18.07, stop loss for USLV ETF $23.94, initial target price for the USLV ETF $31.73
- Mining stocks (price levels for the GDX ETF): stop-loss: $19.94, exit order: $23.37, stop loss for the NUGT ETF $18.25, initial target price for the NUGT ETF $28.99,
In case one wants to bet on higher junior mining stock ETFs, here are the stop-loss details and initial target prices:
- GDXJ stop-loss: $28.40, exit order: $37.14
- JNUG stop-loss: $6.19, exit order: $16.34
Long-term capital (our opinion): No positions
Insurance capital (our opinion): Full position
Please note that a full position doesn’t mean using all of the capital for a given trade. You will find details on our thoughts on gold portfolio structuring in the Key Insights section on our website.
Our preferred ways to invest in and to trade gold along with the reasoning can be found in the how to buy gold section. Additionally, our preferred ETFs and ETNs can be found in our Gold & Silver ETF Ranking.
As always, we'll keep you - our subscribers - updated should our views on the market change. We will continue to send out Gold & Silver Trading Alerts on each trading day and we will send additional Alerts whenever appropriate.
The trading position presented above is the netted version of positions based on subjective signals (opinion) from your Editor, and the automated tools (SP Indicators and the upcoming self-similarity-based tool).
As a reminder, Gold & Silver Trading Alerts are posted before or on each trading day (we usually post them before the opening bell, but we don't promise doing that each day). If there's anything urgent, we will send you an additional small alert before posting the main one.
Thank you.
Sincerely,
Przemyslaw Radomski, CFA
Founder, Editor-in-chief
Gold & Silver Trading Alerts
Forex Trading Alerts
Oil Investment Updates
Oil Trading Alerts

