
Briefly: In our opinion a small (half of the regular size) speculative short position in gold and silver is justified from the risk/reward perspective.
Gold rallied significantly before the US markets’ opening – more than $17 and broke above its declining resistance line. Is this move really that bullish? Is the breakdown in silver still meaningful? Should one re-open the short position in the mining stocks? Let’s take a look at the situation and discuss these important questions. The most visible move today is seen in gold, so let’s start by commenting on its chart (charts courtesy of http://stockcharts.com.)

The gold market (and the same goes for the mining stocks sector) is often characterized by surprising level of symmetry and self-similarity. The declines that we see within downtrend can and quite often are very similar to each other – especially if the decline looks like a zigzag. We see this kind of situation right now, as the current decline that started in July is similar (pace, size) to the decline that started in March. What does this similarity tell us? That the decline is almost (!) over. It would take just an additional move lower – to $1,200 or so in order for the decline to be completed and to remain very similar to the previous one.
Today, however, we saw a big increase in the price of gold – it rallied over $17 in pre-market trading and moved above the declining red resistance line (the analogous line for the USD Index was not broken today – it held, as you will see in the following part of the alert). Was there anything that could have caused the breakdown – something other than investors’ belief that the market will indeed move higher in the coming weeks or so? In other words – can this rally be accidental and not represent the true attitude of market participants? Yes, it can be attributed in a large extent to U.S. air strikes in Syria. Consequently, the breakout doesn’t have to mean that the decline is already over.
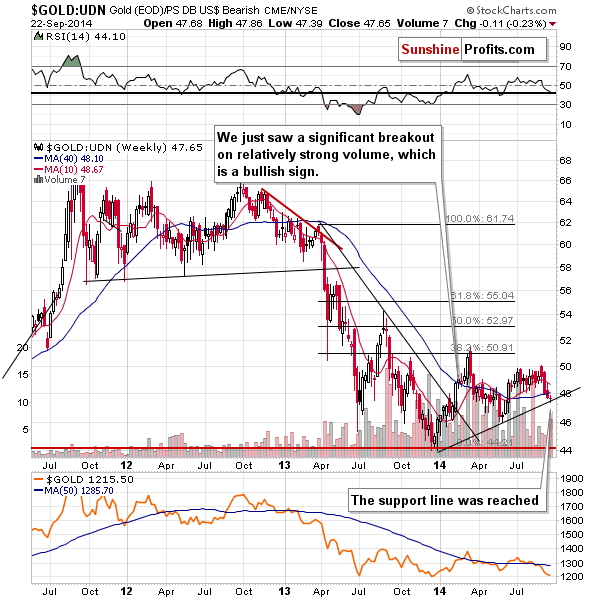
From the non-USD perspective gold has already moved to its support line yesterday, but that doesn’t necessarily mean that the bottom is in from the USD perspective. It does suggest, however, that gold might stop magnifying dollar’s declines (temporarily) and simply move lower by as much as dollar rallies. This still fits the scenario in which the USD Index rallies some more before declining and gold declines some more before really correcting.
The reaction of the silver market seems to confirm the above – it’s almost unchanged (5 cents higher at the moment of writing these words).
In fact, the situation on the silver market remains very tense and unchanged from yesterday. Our yesterday’s comments remain up-to-date:
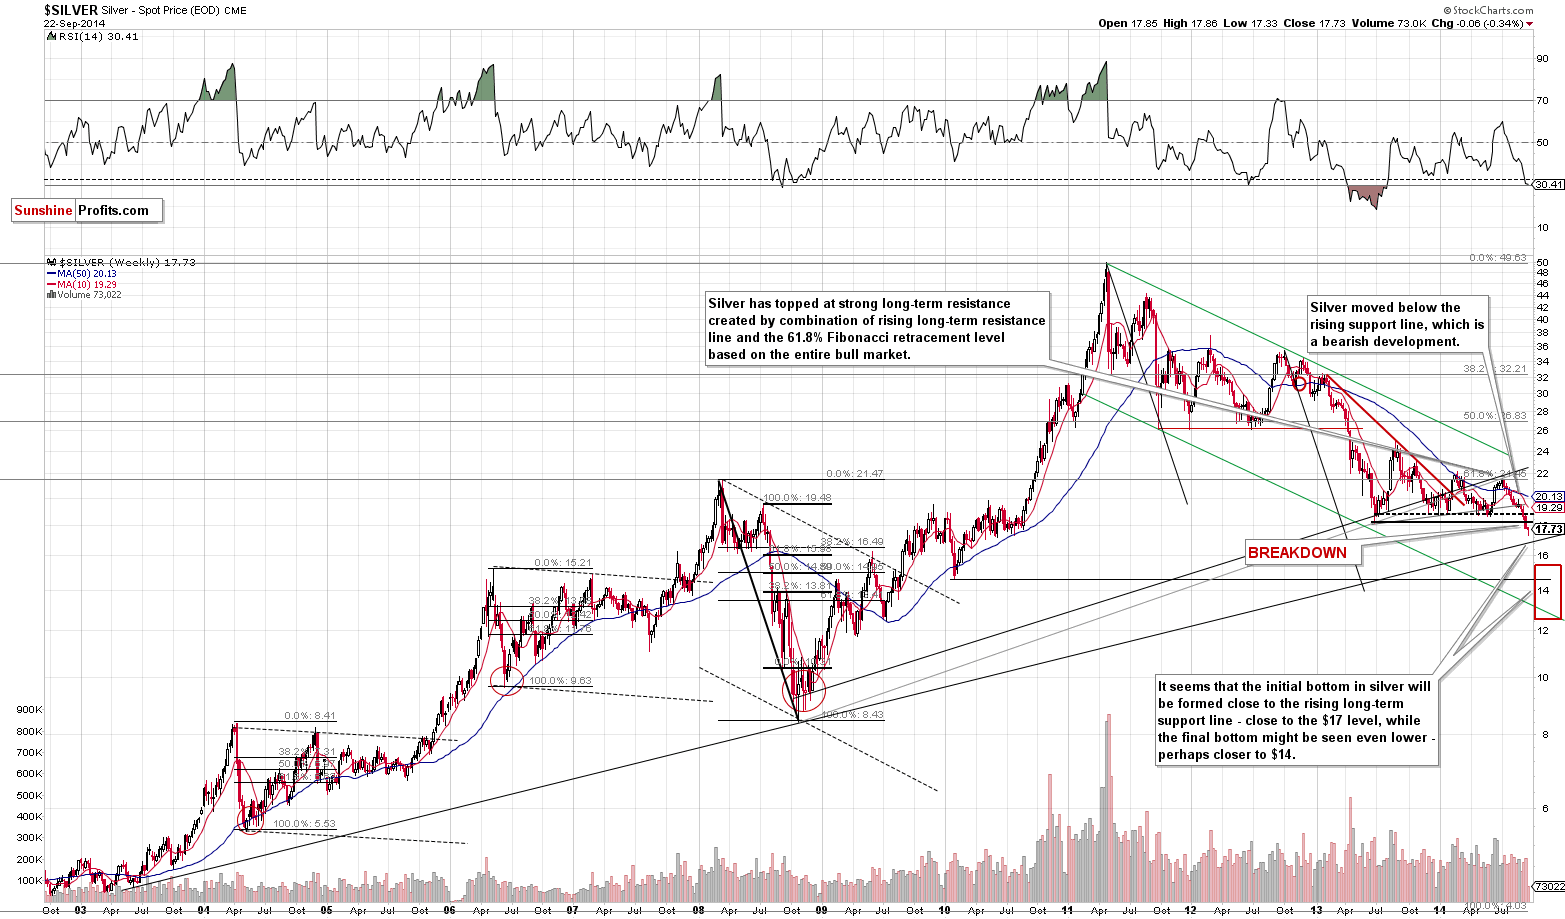
Silver’s breakdown is so significant not only because silver moved below the 2013 low. It’s so significant because we have not only seen a daily close below this important level, but also a weekly close. Silver didn’t end the week just a little below the 2013 low – it closed much lower. The move below the 2013 low was big enough to see it from the very long-term perspective.
With momentum this strong, will silver correct shortly? It certainly could, as its oversold on a short-term basis, but it now seems more likely that it will decline until it reaches support strong enough to stop the move, or – more likely – cause a corrective upswing within the decline. The closest support that could do it is in our opinion the rising long-term support line (based on 2000 and 2008 lows), which is currently slightly below the $17 level.
The RSI indicator is now slightly above the 30 level and with a move to the $17 level or slightly below it, it’s likely to reach the same level that triggered significant rallies in mid-2012 and mid-2008. Perhaps the corrective upswing would take silver back to the 2013 low and the decline would resume after this move.
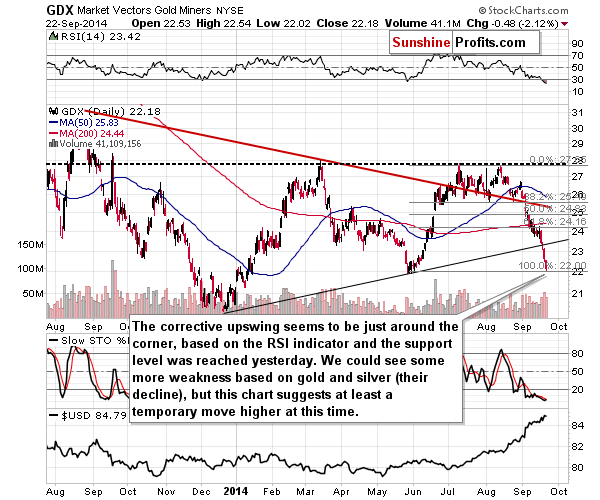
In yesterday’s alert we had mentioned keeping the short positions intact, but with exit prices set at $22.23. This level was reached (miners moved close to the $22 level, as expected) and the profits were secured. What’s next after this quick-profit trade? Miners could certainly move lower once again if we see weakness in gold and silver, but it doesn’t seem that they would confirm the breakdown below the May lows at this time before correcting. They are more oversold on a short-term basis than they’ve been in over a year, so re-entering short positions here seems too risky at this time. It seems that we will have another profitable (with favorable risk/reward ratio) opportunity shortly, but it’s not here just yet.
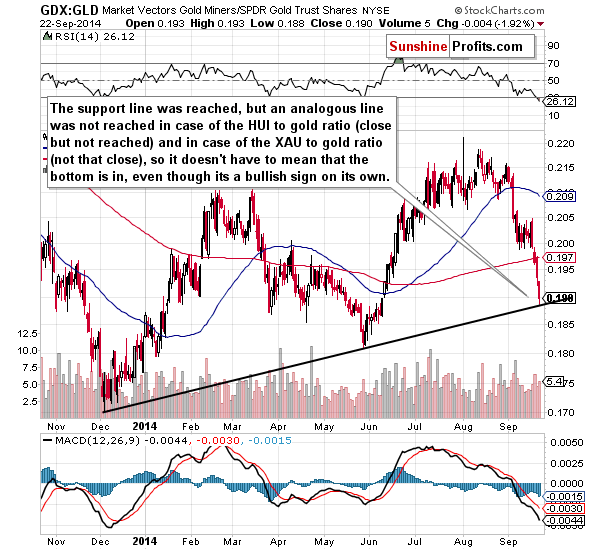
Yesterday we discussed the ratio between gold stocks and the general stock market and also the ratio between juniors and the general stock market and today we will focus on the ratio between mining stocks and gold. The above chart provides us with a bullish signal as the rising support line was just reached. This chart makes the situation rather unclear for the mining stocks, but not necessarily bullish. The reason is that analogous lines were not reached if we used other important proxies for the mining stock sector: the HUI Index and the XAU Index. In other words, it seems that staying out of the precious metals mining stocks at this time is a good idea (regarding both: short and long positions).
Before we summarize, let’s take a look at the USD Index.
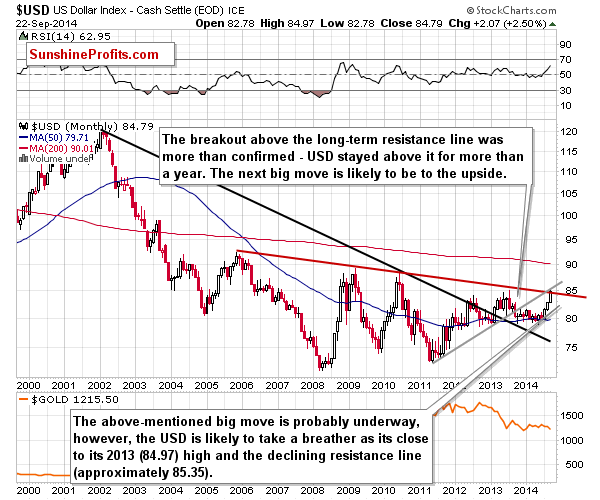
The USD Index moved temporarily higher yesterday and the 2013 high was reached, but – even though the USD Index is very overbought on a short-term basis – it might have not been the final top just yet. What we wrote in Friday’s alert remains up-to-date:
The USD Index rallied but it hasn’t moved above the resistance line based on 2005 and 2010 highs (the line is currently at approximately 85.35). (…)
At this time we can’t rule out some more strength, but it’s not likely to be significant before the USD Index finally corrects.
Please note that the space between the 2013 and the upcoming high is a huge U-shaped bottoming pattern, something that could be the base for the cup-and-handle pattern. After the USD corrects we could see some sideways movement (the handle would be formed), which could correspond to a sideways trading in the precious metals sector very close to its 2013 lows – perhaps verifying the breakdown below them.
(…) it doesn’t seem likely to us that this was the final top for this rally. Why not? Because individual currency pairs (most of them) (…) have not yet reached their support/resistance level yet. Consequently, the 85.35 target seems to be a more likely target than the 84.97. In other words, the rally in the USD Index and the decline in the precious metals sector (even the short-term one) are likely not over yet.
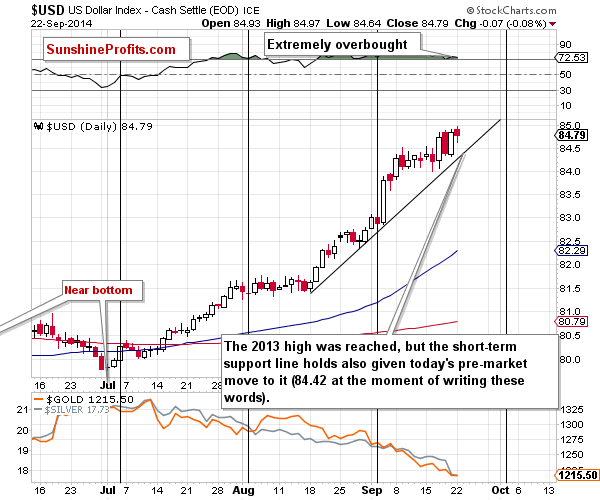
While today’s pre-market moves are not visible on the above chart, we can see that the nearest support is at approximately 84.40 and this is where the USD Index moved today. Since there was no breakdown – even below the short-term support line – it seems that the rally could continue for several days (before the declining long-term resistance line is reached).
Summing up, while the USD Index and the precious metals sector are still likely to correct their most recent moves, it now seems likely that they will move “just a little” before they do indeed correct. Silver’s breakdown was clearly visible and this kind of sign of momentum is likely to be followed by further weakness before we see a turnaround. The short positions in the mining stocks were already closed and profits were taken off the table and it seems to be a good idea to stay out of this sector at this time as the short-term situation seems rather unclear. It does seem to us, however, that gold and silver will move even lower before the current decline ends and a corrective upswing begins.
To summarize:
Trading capital (our opinion):
Short position (half of the regular size of the position) in gold with stop-loss at $1,246 and the target price at $1,204 (it seems that having an exit order at this time at this level is a good idea in most cases)
Short position (half of the regular size of the position) in silver with stop-loss at $18.33 and the target price at $17.06 (it seems that having an exit order at this time at this level is a good idea in most cases)
Long-term capital (our opinion): No positions
Insurance capital (our opinion): Full position
Please note that a full position doesn’t mean using all of the capital for a given trade. You will find details on our thoughts on gold portfolio structuring in the Key Insights section on our website.
Our preferred ways to invest in and to trade gold along with the reasoning can be found in the how to buy gold section. Additionally, our preferred ETFs and ETNs can be found in our Gold & Silver ETF Ranking.
As always, we'll keep you - our subscribers - updated should our views on the market change. We will continue to send out Gold & Silver Trading Alerts on each trading day and we will send additional Alerts whenever appropriate.
The trading position presented above is the netted version of positions based on subjective signals (opinion) from your Editor, and the automated tools (SP Indicators and the upcoming self-similarity-based tool).
As a reminder, Gold & Silver Trading Alerts are posted before or on each trading day (we usually post them before the opening bell, but we don't promise doing that each day). If there's anything urgent, we will send you an additional small alert before posting the main one.
Thank you.
Sincerely,
Przemyslaw Radomski, CFA
Founder, Editor-in-chief
Gold & Silver Trading Alerts
Forex Trading Alerts
Oil Investment Updates
Oil Trading Alerts

