
Briefly: In our opinion no speculative positions in gold, silver and mining stocks are now justified from the risk/reward perspective. However, day-traders might consider a small speculative long position in silver.
While the previous days and weeks hadn’t been really exciting, we definitely can’t say that about yesterday’s session. Gold and mining stocks declined, silver moved lower just a little, but that happened without the dollar’s help. In fact, the U.S. currency reversed in a very specific fashion, which tells us something about its next moves. The implications for the precious metals market are clearer than they used to be in the previous days and weeks. Let’s take a closer look (charts courtesy of http://stockcharts.com.)
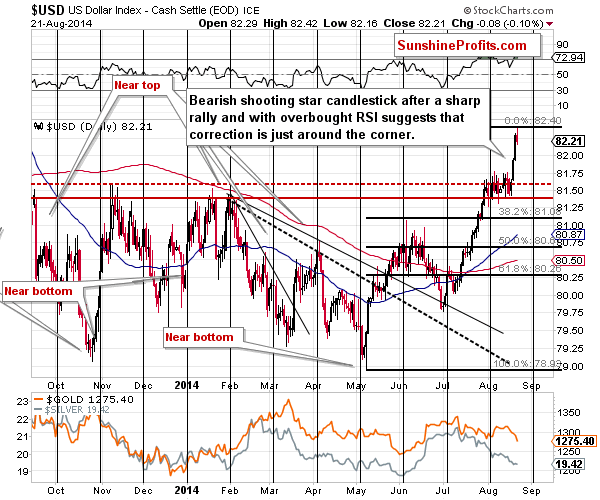
The USD index reversed and created a bearish shooting star candlestick. This, plus the significantly overbought status, as indicated by the RSI indicator, creates a very bearish combination for the short term. We are now very likely to see a corrective downswing.
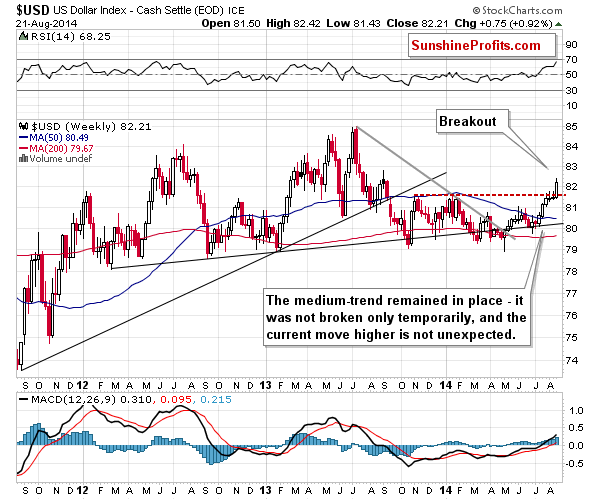
Why only a corrective downswing, and not a new big decline? Because this week’s breakout has been confirmed and it’s a move above important resistance levels. The rally that is likely to follow such a breakout is something that might be much bigger than what we’ve seen this week. In fact, this week’s price action looks just like a start of a bigger move when we look at it from the medium-term perspective.
How low can the USD Index go? There are no certainties in any market, but it seems to us that the USD could move back to the previously broken level. In other words, a move to 81.5 – 81.7 range would not surprise us.
Naturally, the very short-term implications for the precious metals market are bullish, but the medium-term ones are even more bearish than they had been before this week began.
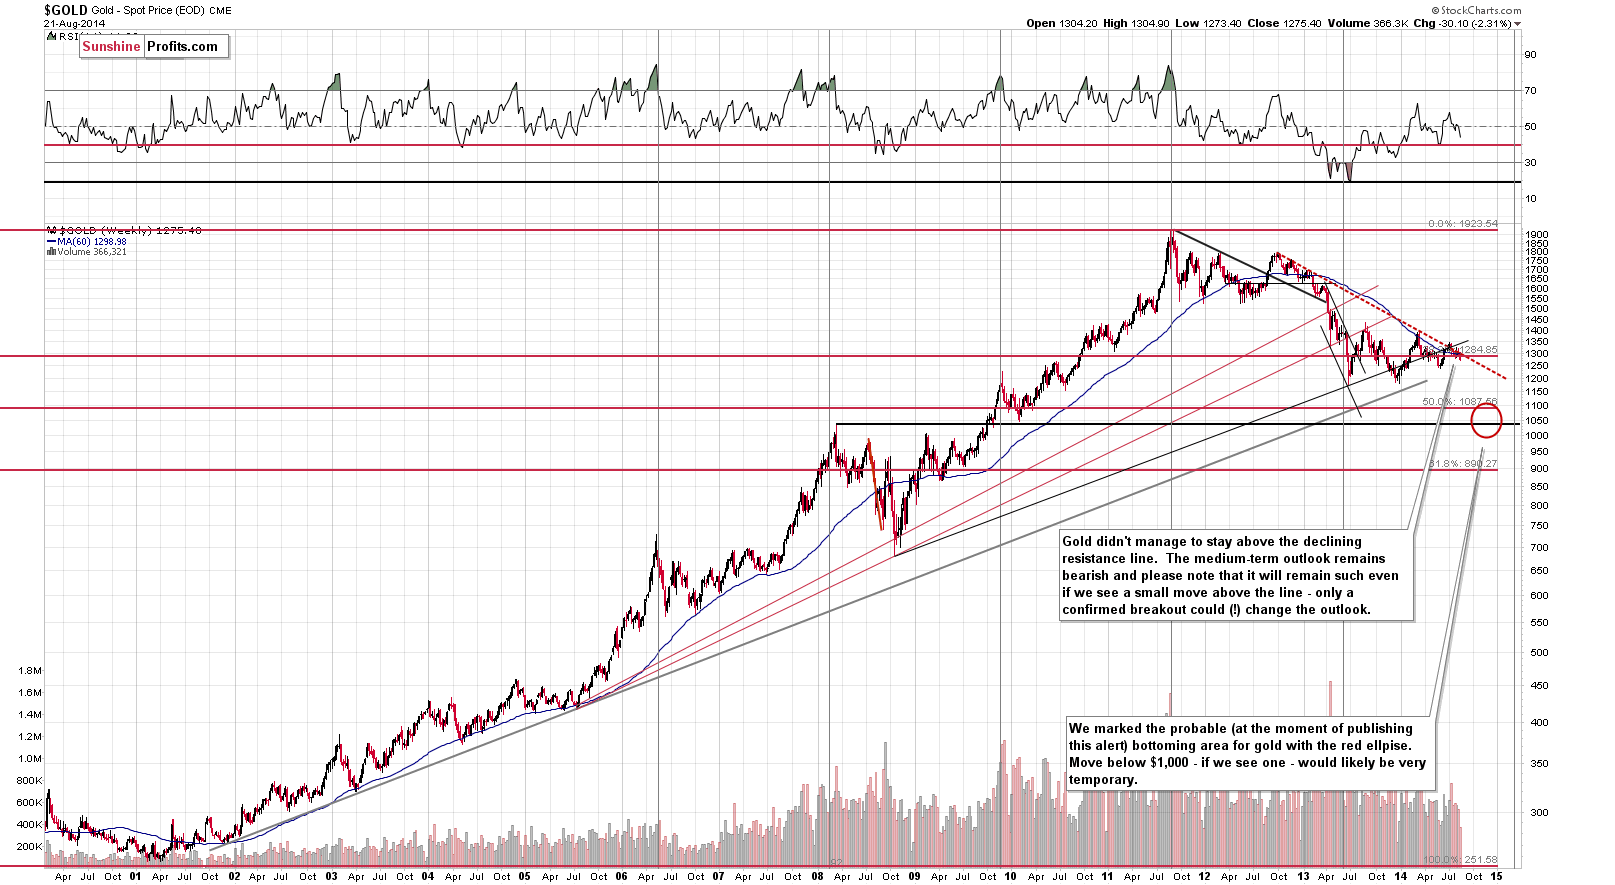
From the long-term perspective, we see that gold has invalidated the move above the declining resistance line, which is a bearish sign for the coming weeks. Gold is also below the 38.2% Fibonacci retracement level based on the entire bull market, which is another bearish sign for the medium term.
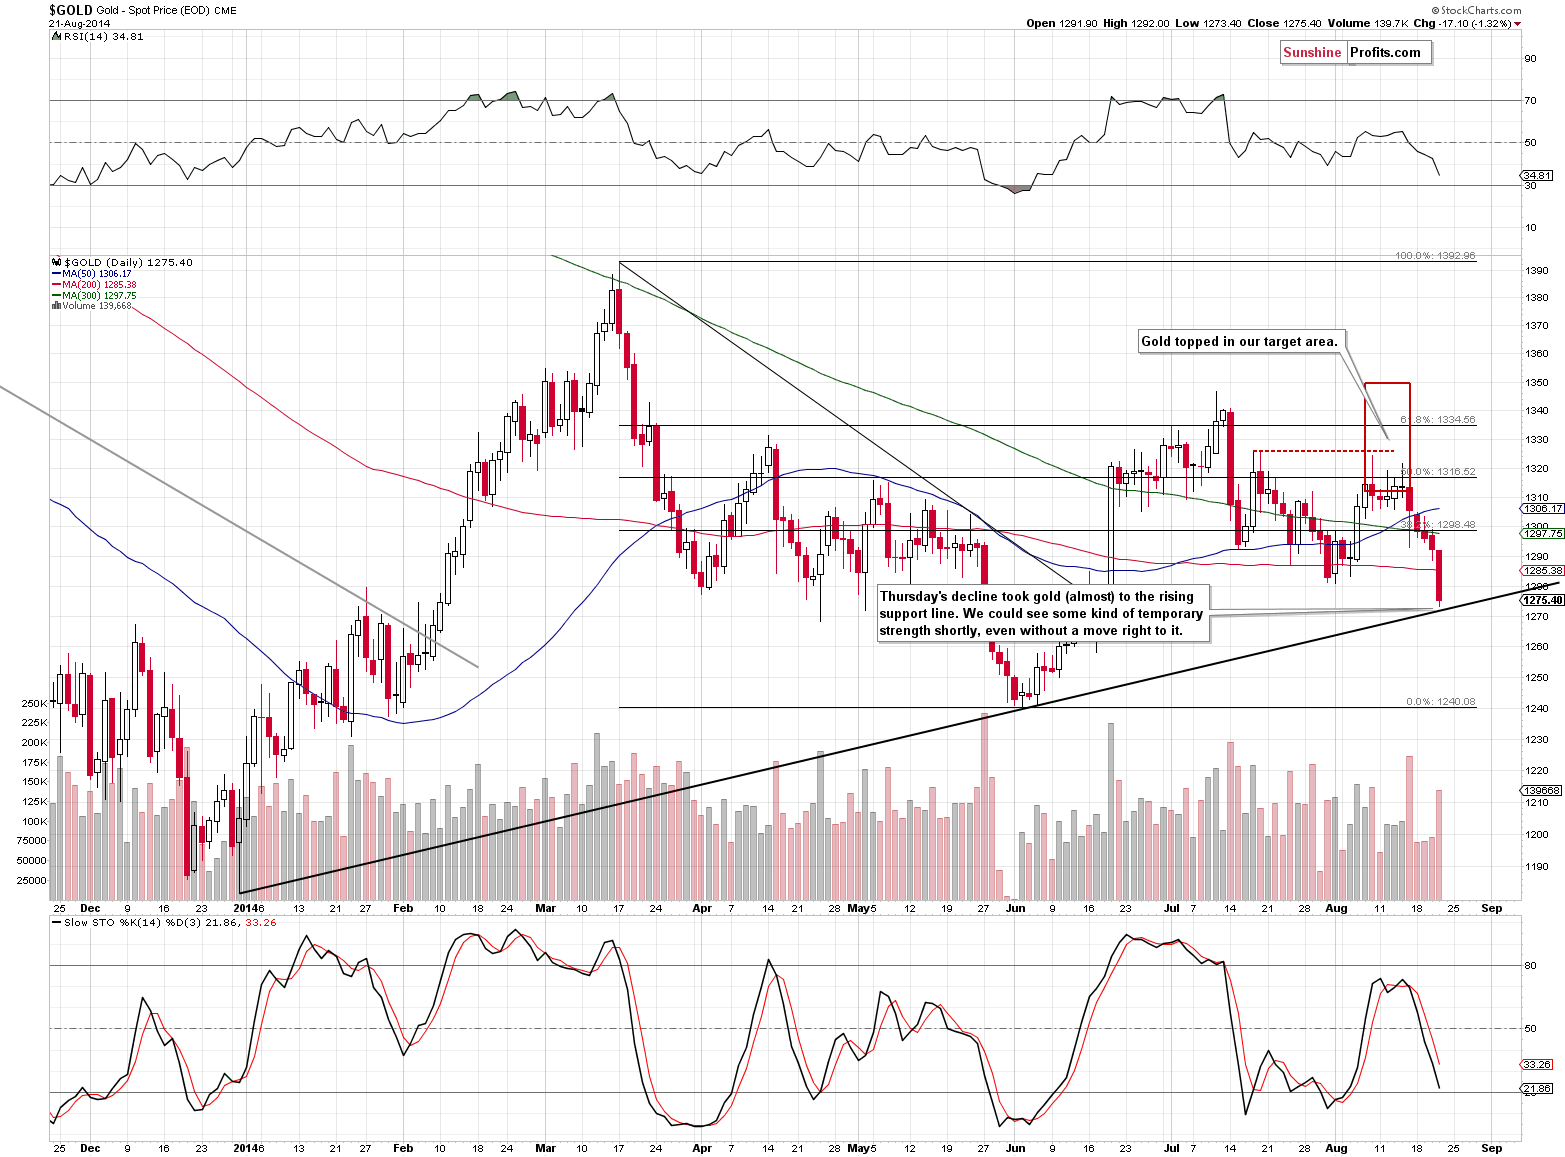
The short-term chart, however, provides us with different implications. The medium-term support line was almost reached. Gold moved so close to it that it seems to us that traders can already take it into account and start buying without waiting for the line to be touched. The volume was high, so we could have just seen a local bottom, or be very close to one. It seems quite likely based on what we saw in the currency market.
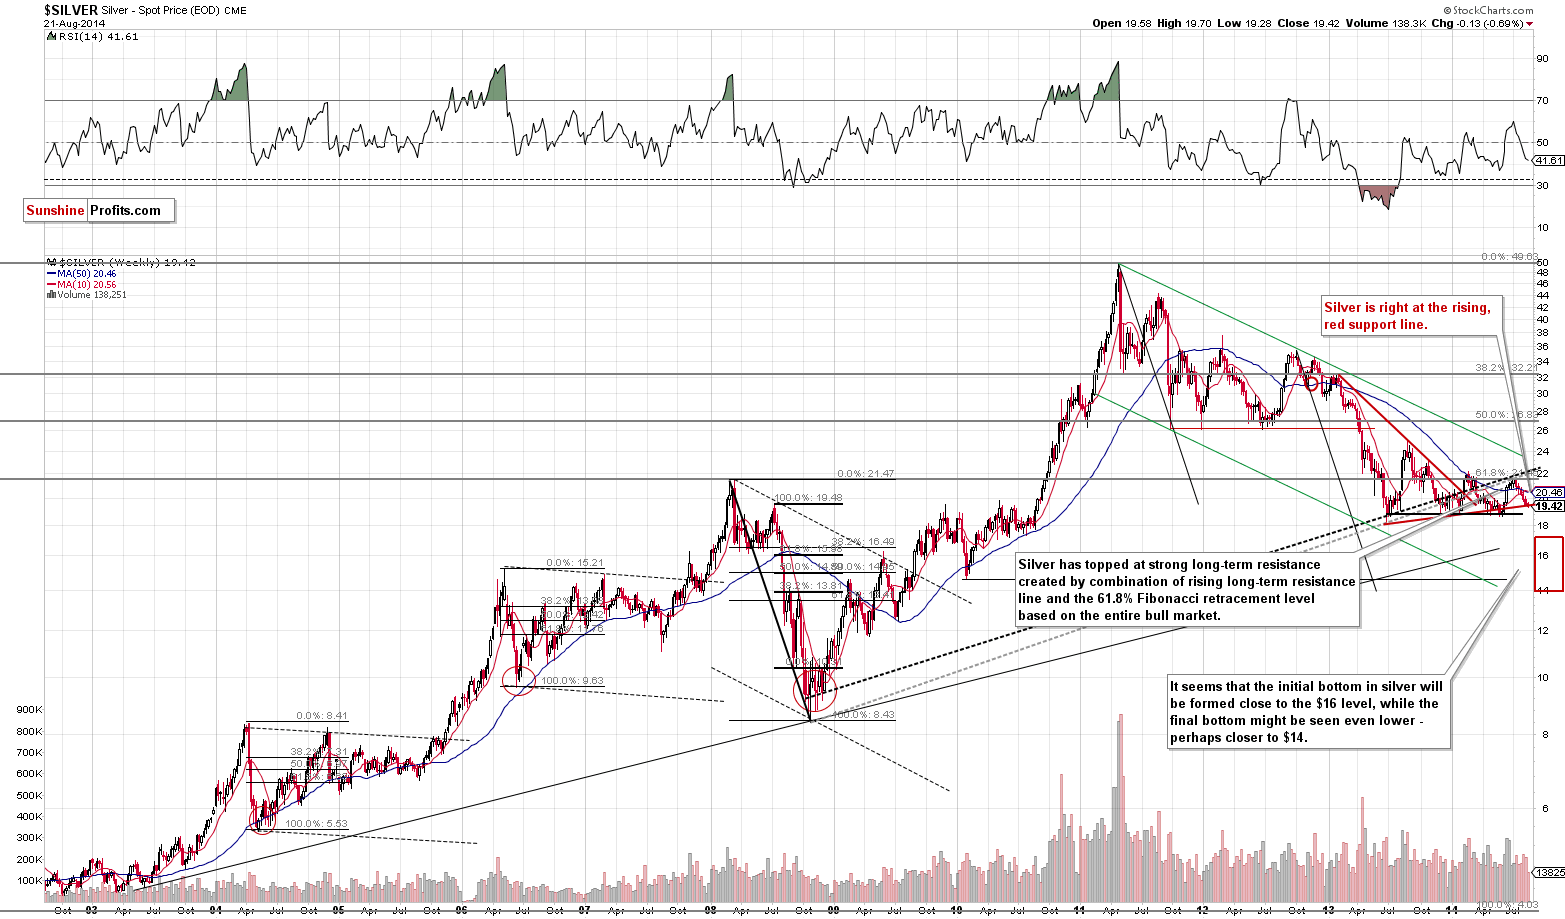
The long-term chart featuring silver doesn’t provide any new information. Our previous comments remain up-to-date:
Silver, on the other hand, provides the support line. The white metal is not (yet) at its previous lows, but it’s already at the support line that is created by connecting these lows. Once this support is broken, the decline is likely to accelerate. If silver breaks below the previous lows, we could see a very sharp move into our target area. Will this happen soon? There are no certainties, but it’s becoming more and more likely that we will see this type of action in the following weeks or months.
What’s the most likely outcome for the following days? In our opinion we could see a verification of the breakout in the USD Index in the form of a pullback, which would cause a temporary upswing in gold and – especially – silver. Then the rally in the USD would continue and so would the decline in the precious metals sector. Of course, there are no guarantees, but the above is our best guesstimate at the moment.
The above-mentioned corrective upswing in metals could provide a confirmation that the big decline is about to start – for instance if we see silver’s outperformance and/or miners move higher on tiny volume.
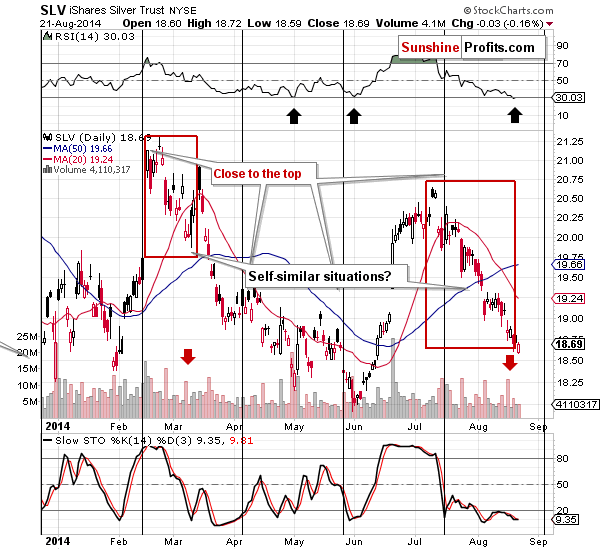
The short-term SLV ETF chart shows that silver demonstrated some strength yesterday. It is not the type of strength that would indicate that a local top is in or about to be in, but it does suggest that such rally is quite likely to emerge.
Taking yesterday’s session alone, it seems that silver is the strong part of the precious metals market. Those who have been following our analysis for some time know that this sign could be misleading – silver tends to outperform right before plunges in the entire sector. It seems quite likely that we will see this type of pattern once again. Furthermore, it seems likely that silver will outperform in the coming days, but taking this strength at face value might be premature. It will quite likely be nothing more than a counter-trend bounce. Naturally, anything is possible in the market, but we think the above is the most likely outcome at this time.
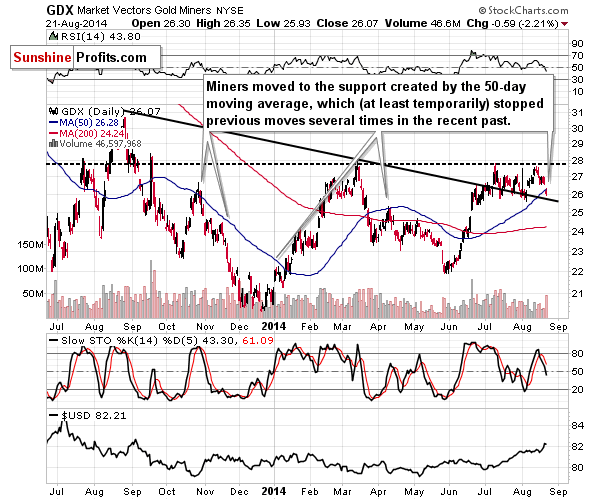
The mining stocks declined, just like gold did. Unlike gold, they didn’t reach a rising support line. They did, however, reach a different kind of support – the 50-day moving average. Will this average stop the decline? Perhaps “stop” is not the most appropriate word here, as we’re expecting a pause within the decline, but, generally, yes, this moving average could very well trigger the corrective upswing that is likely based on what happened in the gold market and in the USD Index.
All in all, what we wrote yesterday remains mostly up-to-date:
The above-mentioned corrective upswing in metals could provide a confirmation that the big decline is about to start – for instance if we see silver’s outperformance and/or miners move higher on tiny volume.
Summing up, the situation in the precious metals market still remains too unclear to open any positions in our view, but it seems that we won’t have to wait too long before things clarify and the risk/reward ratio becomes favorable enough to open a trading position. It seems that day-traders might want to take advantage of the specific way the silver market reacts during corrective upswings, but betting on silver’s bounce is not something that we can suggest to most traders.
To summarize:
Trading capital (our opinion): No positions
Long-term capital (our opinion): No positions
Insurance capital (our opinion): Full position
Please note that a full position doesn’t mean using all of the capital for a given trade. You will find details on our thoughts on gold portfolio structuring in the Key Insights section on our website.
Our preferred ways to invest in and to trade gold along with the reasoning can be found in the how to buy gold section. Additionally, our preferred ETFs and ETNs can be found in our Gold & Silver ETF Ranking.
As always, we'll keep you - our subscribers - updated should our views on the market change. We will continue to send out Gold & Silver Trading Alerts on each trading day and we will send additional Alerts whenever appropriate.
The trading position presented above is the netted version of positions based on subjective signals (opinion) from your Editor, and the automated tools (SP Indicators and the upcoming self-similarity-based tool).
As a reminder, Gold & Silver Trading Alerts are posted before or on each trading day (we usually post them before the opening bell, but we don't promise doing that each day). If there's anything urgent, we will send you an additional small alert before posting the main one.
Thank you.
Sincerely,
Przemyslaw Radomski, CFA
Founder, Editor-in-chief
Gold & Silver Trading Alerts
Forex Trading Alerts
Oil Investment Updates
Oil Trading Alerts

