Briefly: In our opinion (full) speculative short positions in gold, silver and mining stocks are now justified from the risk/reward perspective.
In the previous alert we commented on the changes that we saw on Thursday and in Friday’s pre-market trading. In short, we viewed Thursday’s rally as an event-driven one-time jump that would likely be followed by the continuation of the previous trend, which is down. Let’s see what happened (charts courtesy of http://stockcharts.com.)
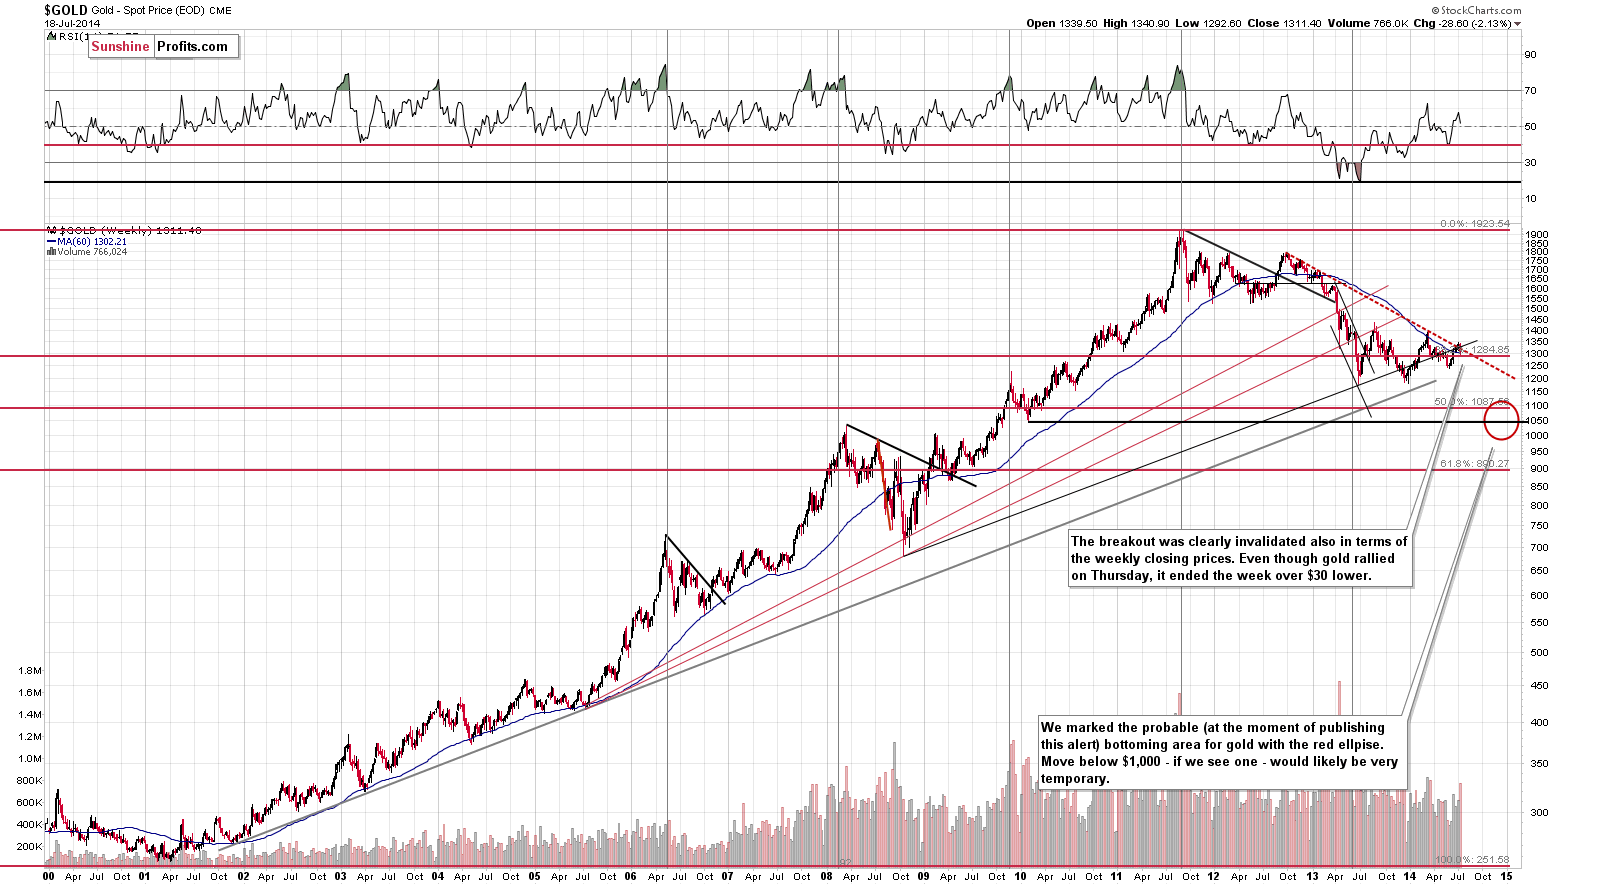
From the long-term perspective, we continue to see what we saw previously. At this time, however, it’s even more meaningful as it’s confirmed by a weekly close. The thing that we now "see even more" is the invalidation of the move above the declining resistance line. Consequently, the medium-term trend remains down and the bearish implications remain in place.
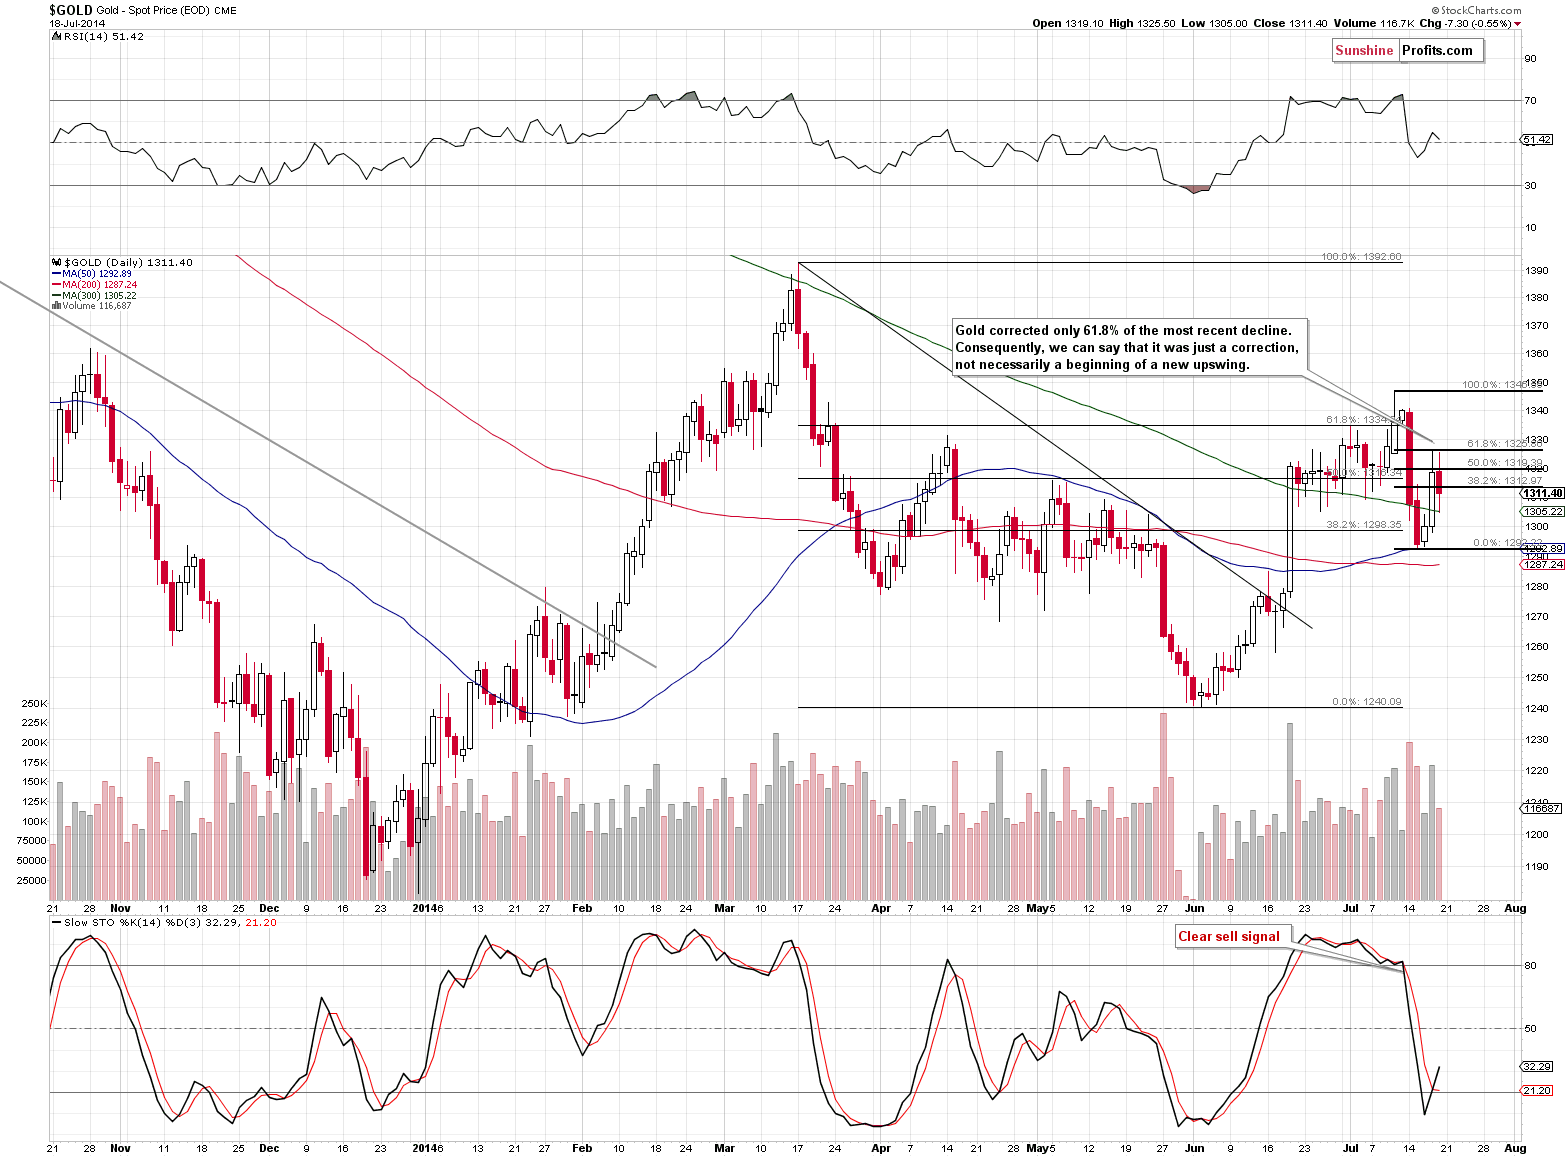
On the short-term chart we see that even though Thursday’s rally was significant, it hasn’t taken gold above the short-term 61.8% Fibonacci retracement level. Consequently, the move higher should be viewed as a correction. The move below the 300-day moving average has been technically invalidated, but since it happened on Thursday - meaning during the session that was not really representative - we don’t view it as really meaningful.
The situation in silver didn’t change a lot when one takes Thursday’s and Friday’s session together and analyzes them at the same time.
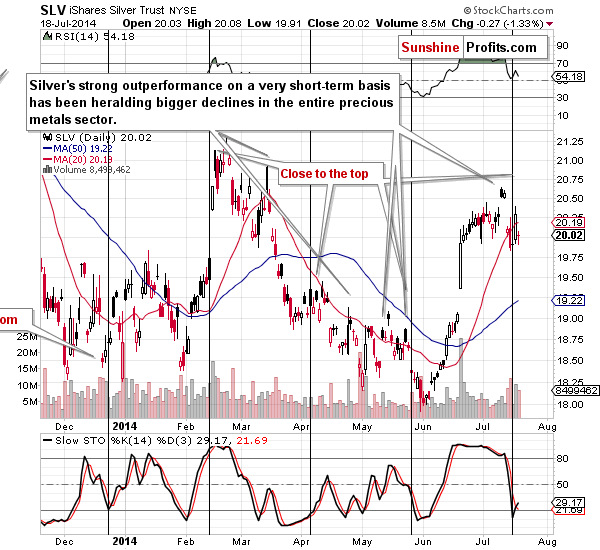
Basically, silver declined on Friday by more or less as much as it had rallied on Thursday. Overall, there were very little changes in case of the white metal. Please note that it had recently outperformed gold on a very short-term basis, which - once again - served as an indication that a decline was about to start.
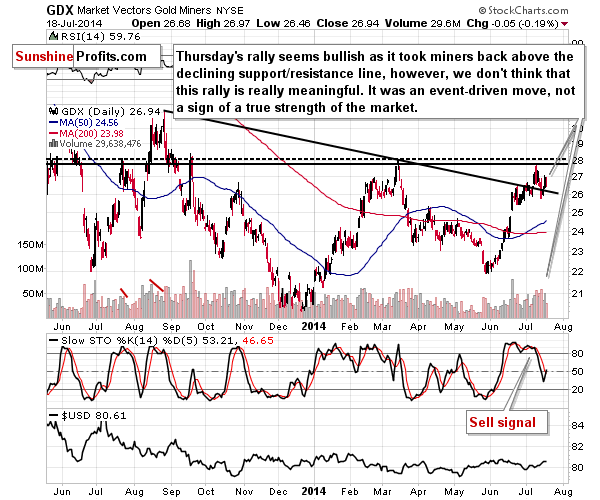
In general, what we wrote regarding the gold chart applies also to the situation on the GDX ETF chart. In the case of gold, we were discussing a move above the 300-day moving average, and in this case we are discussing a move above the declining support/resistance line. Again, it seems too early to say that anything has really changed, even though we saw a weekly close above it.
Before summarizing, let’s take a look at the forex market, specifically at the Euro and USD Indices.
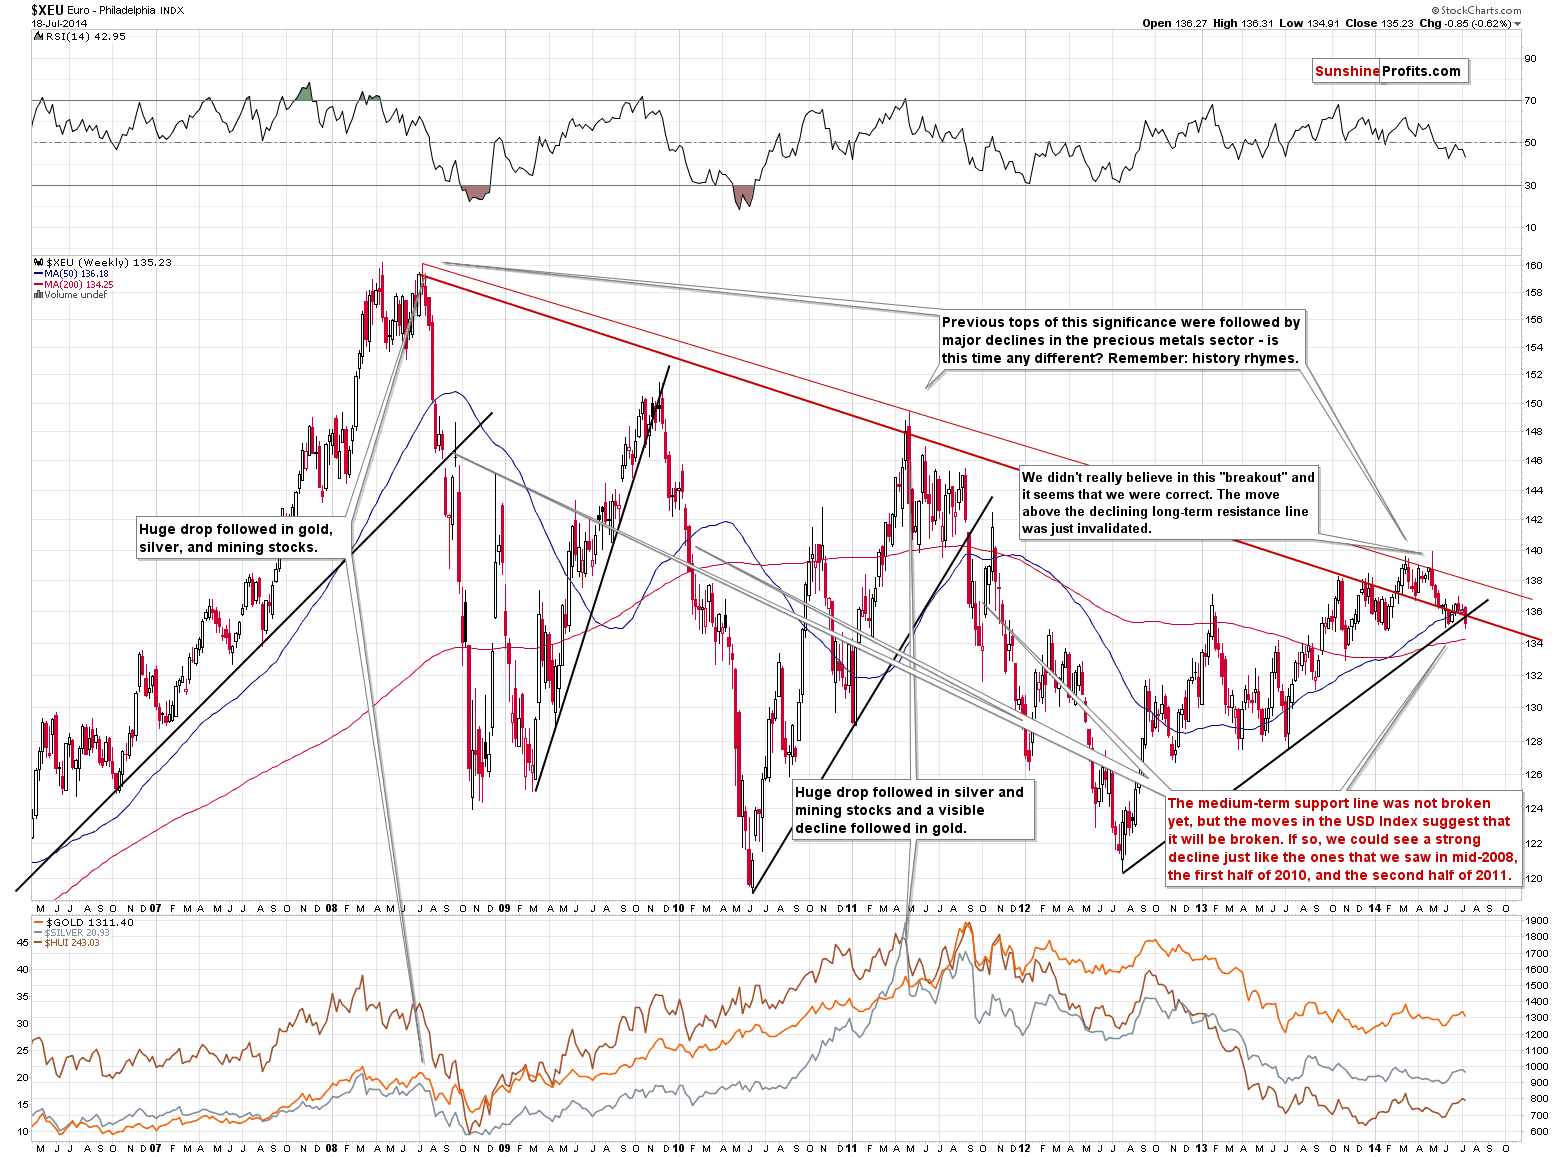
Our most recent comments on the above chart remain up-to-date (which is another way to say that Thursday’s session didn’t change anything from this perspective and the implications remain in place):
There are 2 things on the above chart that are significant for precious metals investors. Firstly, it seems that the Euro Index is on a verge of breaking below a combination of strong support lines (having invalidated the breakout above the very long-term resistance line earlier this year). Such a breakdown – if it materializes - will like be followed by a substantial move lower. Secondly, the previous big downswings in the Euro Index were seen along with big declines in gold, silver and mining stocks. Naturally, the combination of the above points is bearish for the precious metals sector.
The situation in the USD Index remains unchanged as well.
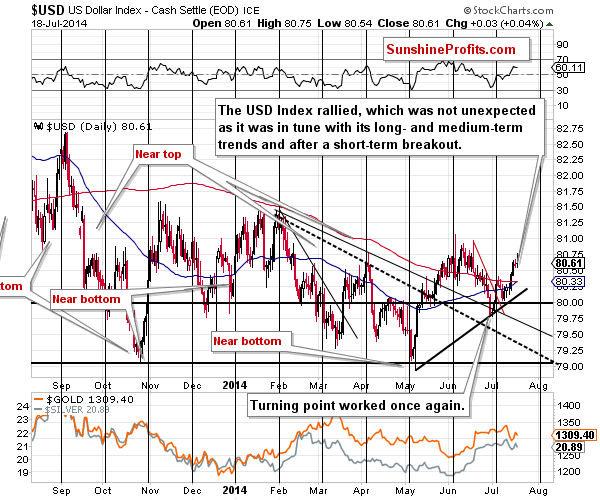
The U.S. currency index moved higher recently after reversing its direction at the cyclical turning point. It seems that we could see a pause here, but it doesn’t seem that the rally is over. The USD Index is after long-, medium-, and short-term breakouts, so the outlook is bullish.
Generally, we can summarize the situation exactly as we did based on Thursday’s closing prices.
Summing up, we had expected to see a pause within the decline and we did. The move higher was higher than expected, because of the unforeseen crash of a civilian airplane, allegedly shot down near the border between Ukraine and Russia. The move – even though it was greater than it had been likely to be – hasn’t changed the overall trend, and it seems that the precious metals market will soon move in tune with its medium-term trend – which at this time is still down. Our best bet is that we will see a major bottom in the precious metals sector later this year –we don’t think we have reached this point yet. The short position that we mentioned on July 14 (we wrote about it more or less before half of the daily decline) still seems to be justified from the risk/reward perspective.
To summarize:
Trading capital (our opinion): Short (full) position in gold, silver and mining stocks with the following stop-loss levels:
- Gold: $1,353
- Silver: $21.73
- GDX ETF: $28.30
Long-term capital: No positions
Insurance capital: Full position
Please note that a full position doesn’t mean using all of the capital for a given trade. You will find details on our thoughts on gold portfolio structuring in the Key Insights section on our website.
As always, we'll keep you - our subscribers - updated should our views on the market change. We will continue to send out Gold & Silver Trading Alerts on each trading day and we will send additional Alerts whenever appropriate.
The trading position presented above is the netted version of positions based on subjective signals (opinion) from your Editor, and the automated tools (SP Indicators and the upcoming self-similarity-based tool).
As a reminder, Gold & Silver Trading Alerts are posted before or on each trading day (we usually post them before the opening bell, but we don't promise doing that each day). If there's anything urgent, we will send you an additional small alert before posting the main one.
Thank you.
Sincerely,
Przemyslaw Radomski, CFA
Founder, Editor-in-chief
Gold & Silver Trading Alerts
Forex Trading Alerts
Oil Investment Updates
Oil Trading Alerts


