
Briefly: In our opinion small (half) speculative short positions in gold, silver and mining stocks are now justified from the risk/reward perspective.
Yesterday’s session in the precious metals market was very specific and important. The first part of the decline materialized even before markets opened in the U.S. and later on the bearish price moves were also confirmed by U.S. investors. The decline materialized on significant volume and without the dollar’s help. Sounds very bearish. But is it? Let’s take a closer look (charts courtesy of http://stockcharts.com).
In yesterday’s alert we wrote the following about the first part of yesterday’s decline:
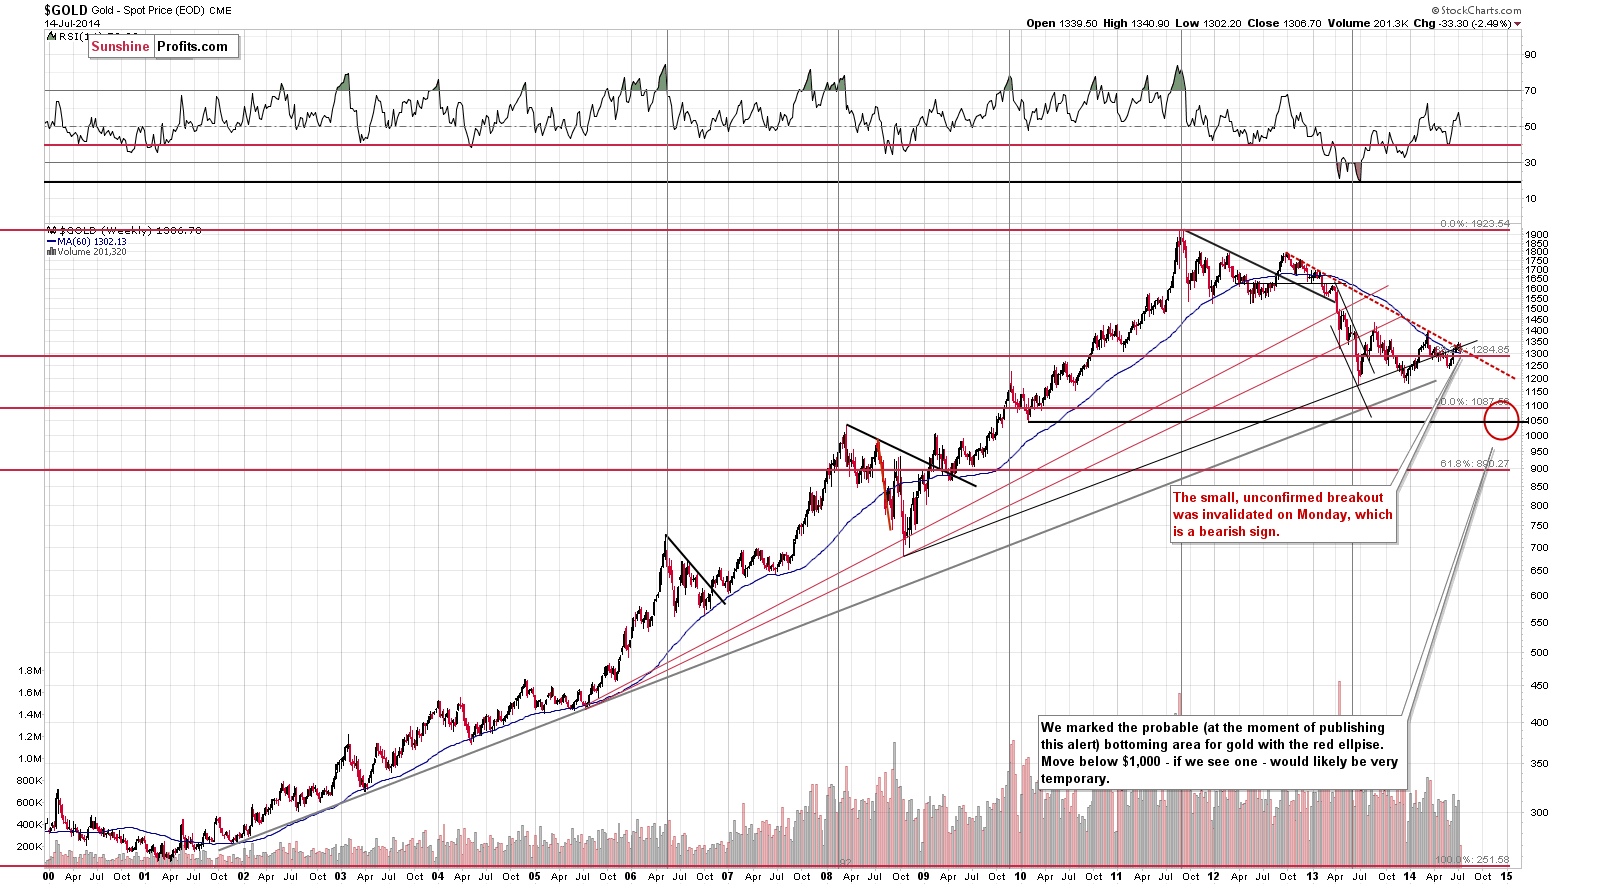
What actually changed was that the small breakout was invalidated earlier today when gold moved back below the long-term resistance line. We didn’t believe the breakout would hold, and it didn’t.
The above is even truer in light of the fact that gold closed the day even lower. The breakout was clearly invalidated and that is a bearish sign on its own.
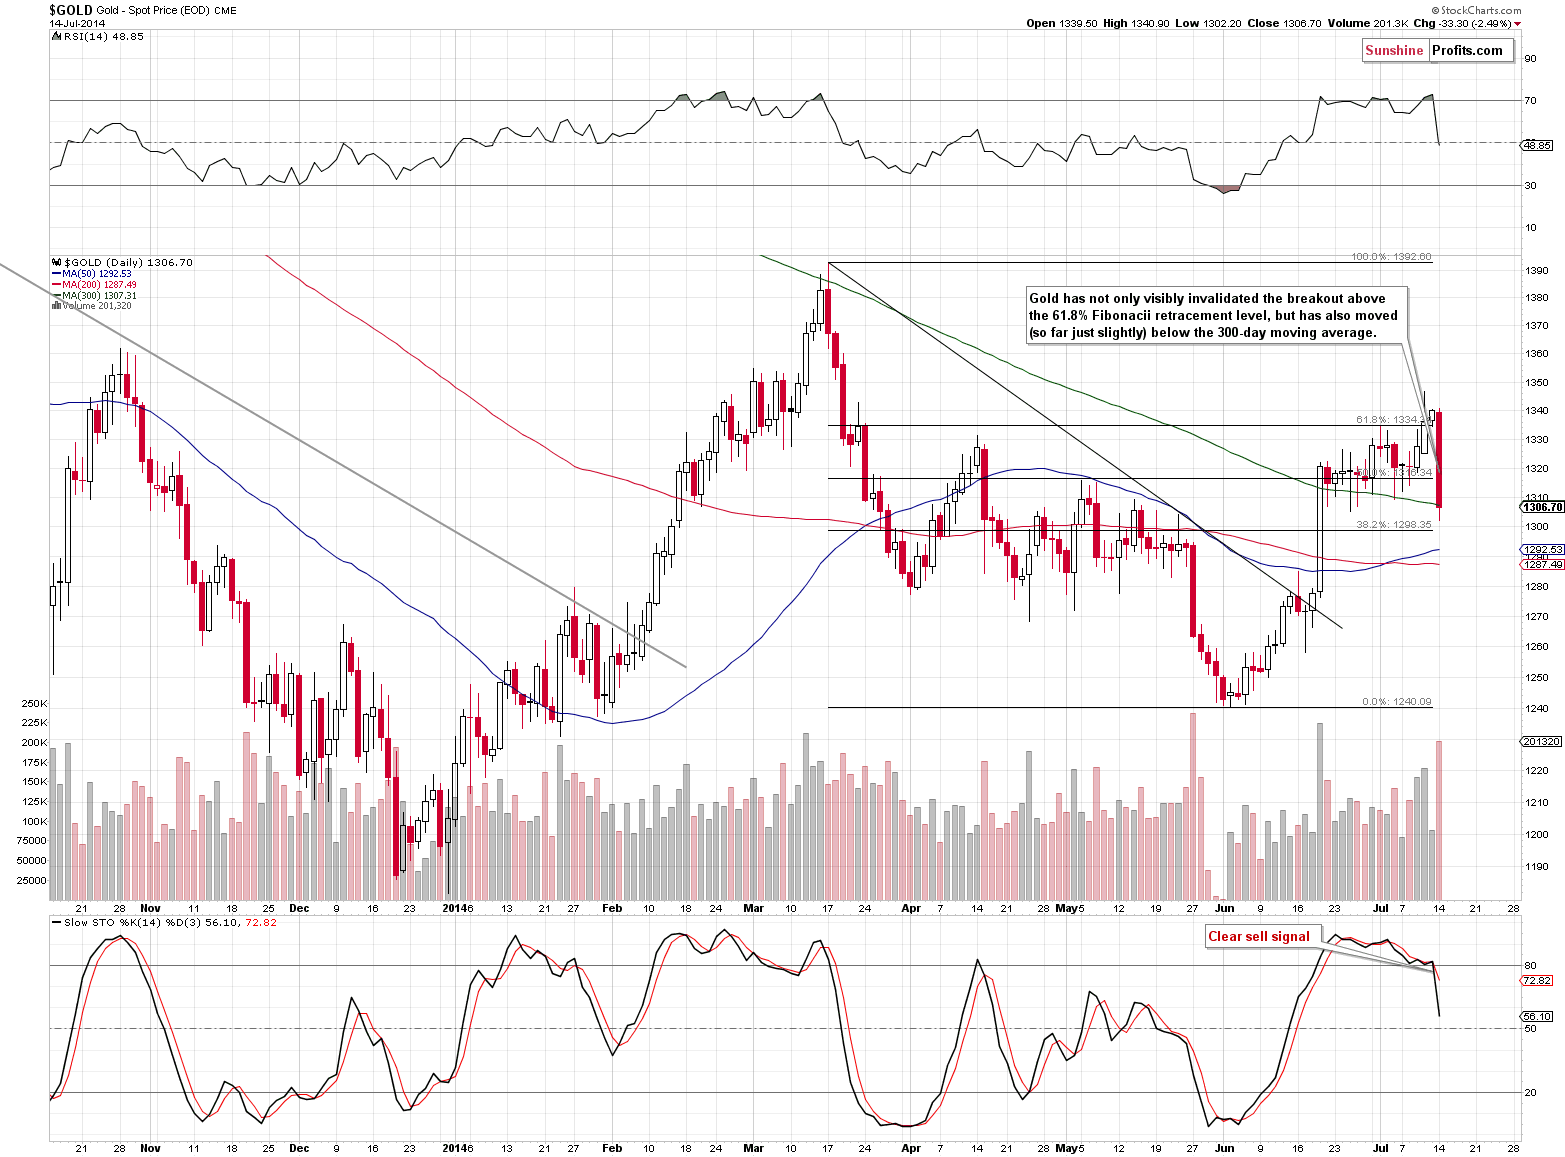
What makes the invalidation even more bearish is that it was not only the rising resistance line that was “unbroken.” The move above the 61.8% Fibonacci retracement and – most importantly – the move above the 300-day moving average were also invalidated. The latter was invalidated insignificantly, so as soon as gold declines some more, we will get a much more bearish signal.
The volume that accompanied Monday’s big downswing was significant, which confirms the direction of the move.
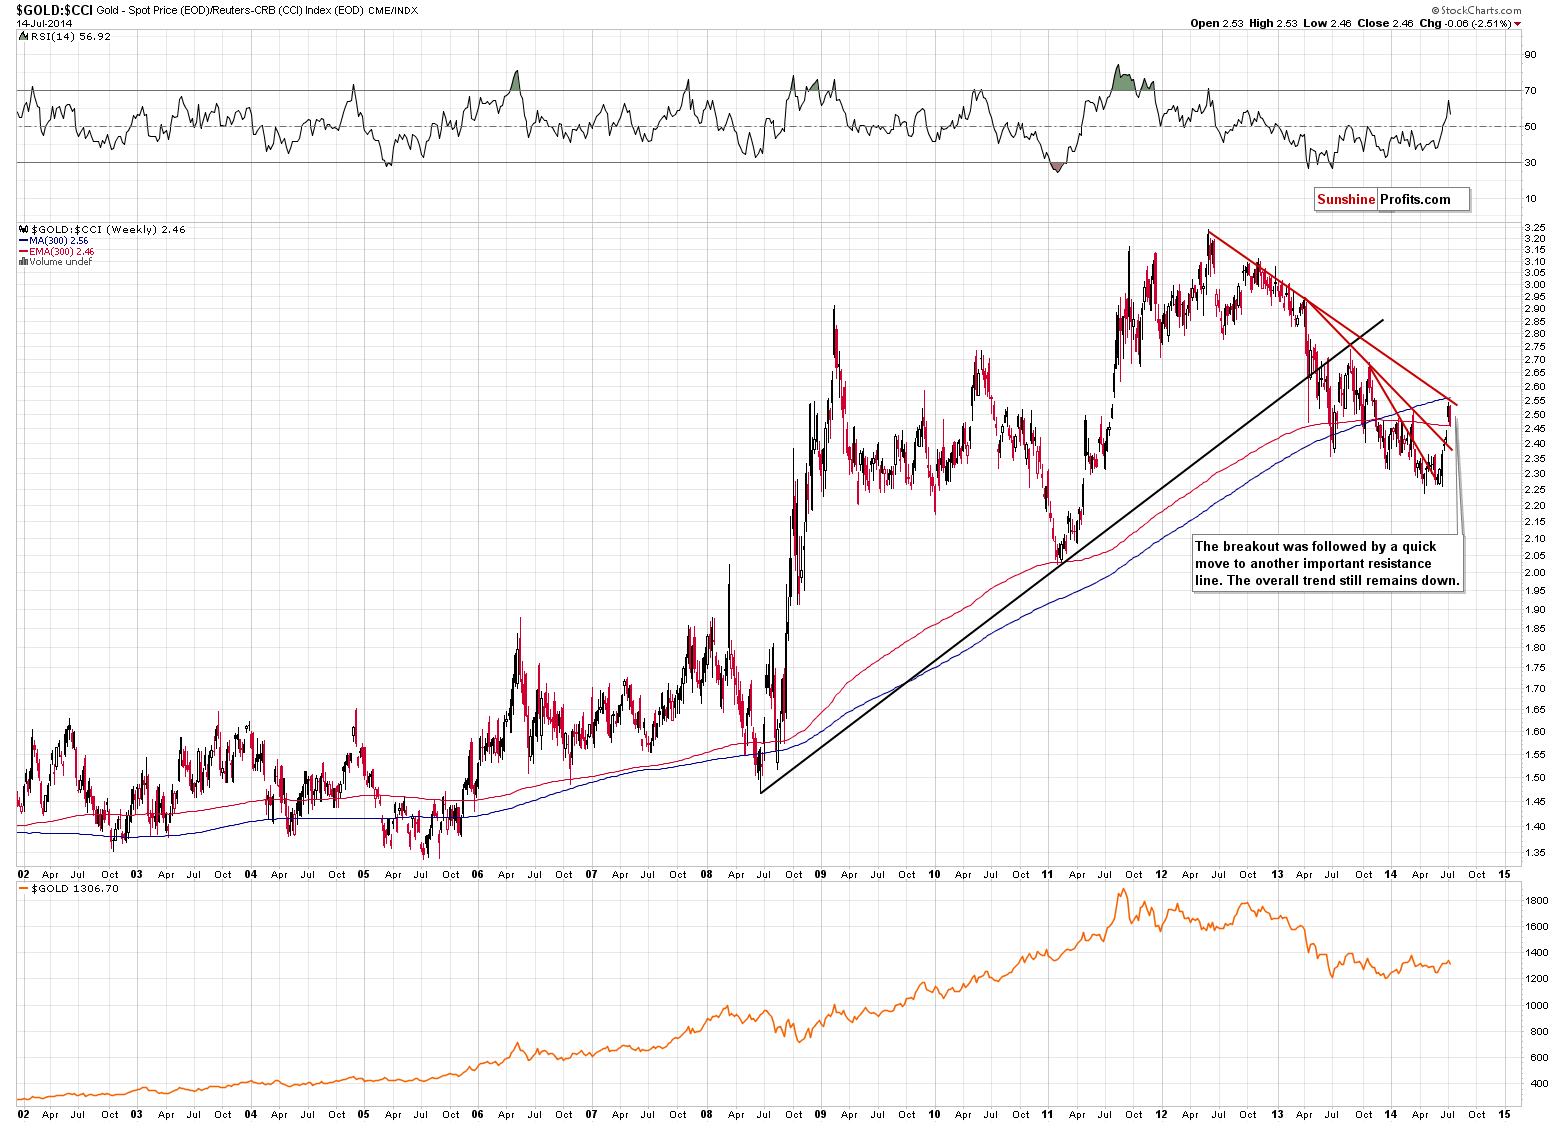
Comparing gold’s performance to the one of the commodity sector shows that gold enjoyed quite a sharp run up, but declined as soon as the medium-term resistance line was reached. Without a breakout above it, the trend remains down, even though there was a breakout above a less important resistance line several days ago. Overall, not much changed from this perspective – the trend simply remains down.
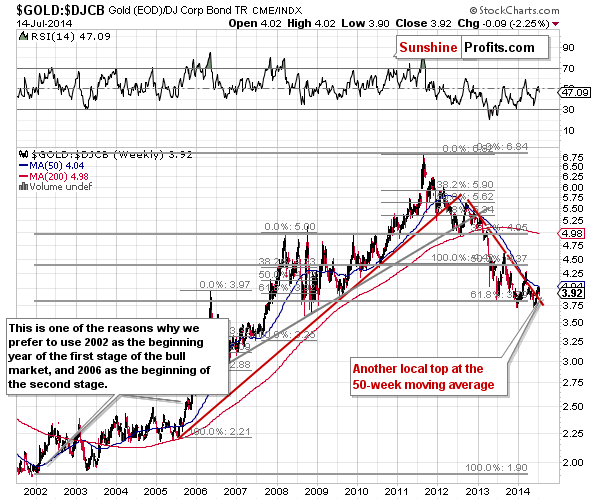
We can say a similar thing about gold compared with the performance of corporate bonds. It seems that we saw another local top at the 50-week moving average. The small breakout above the declining red resistance line doesn’t have meaningful bullish implications, as a previous such move was invalidated and followed by a significant decline soon after the “breakout.” Again – the trend simply remains down.
The situation in mining stocks deteriorated, but not in a major way.
What we wrote previously remains up-to-date: the rally might already be over. The lower of the resistance level was just reached and we might have just seen a local top.
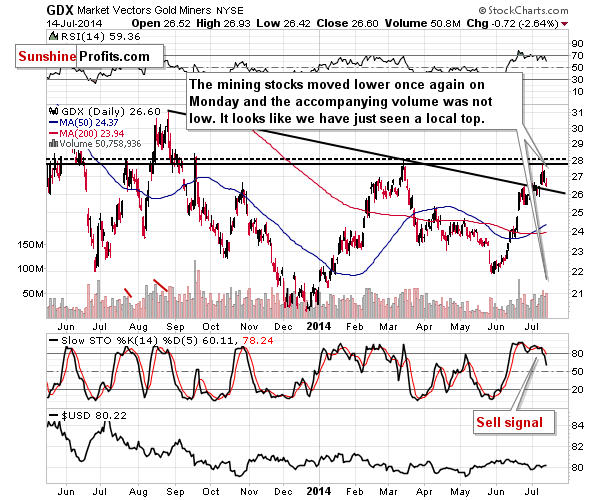
We also wrote: if miners manage to close back below the declining support/resistance line – more or less below $26 – we will have a strong bearish sign.
Even though the GDX ETF declined significantly, it didn’t move below the above-mentioned declining support/resistance line, so we have yet to see this bearish confirmation.
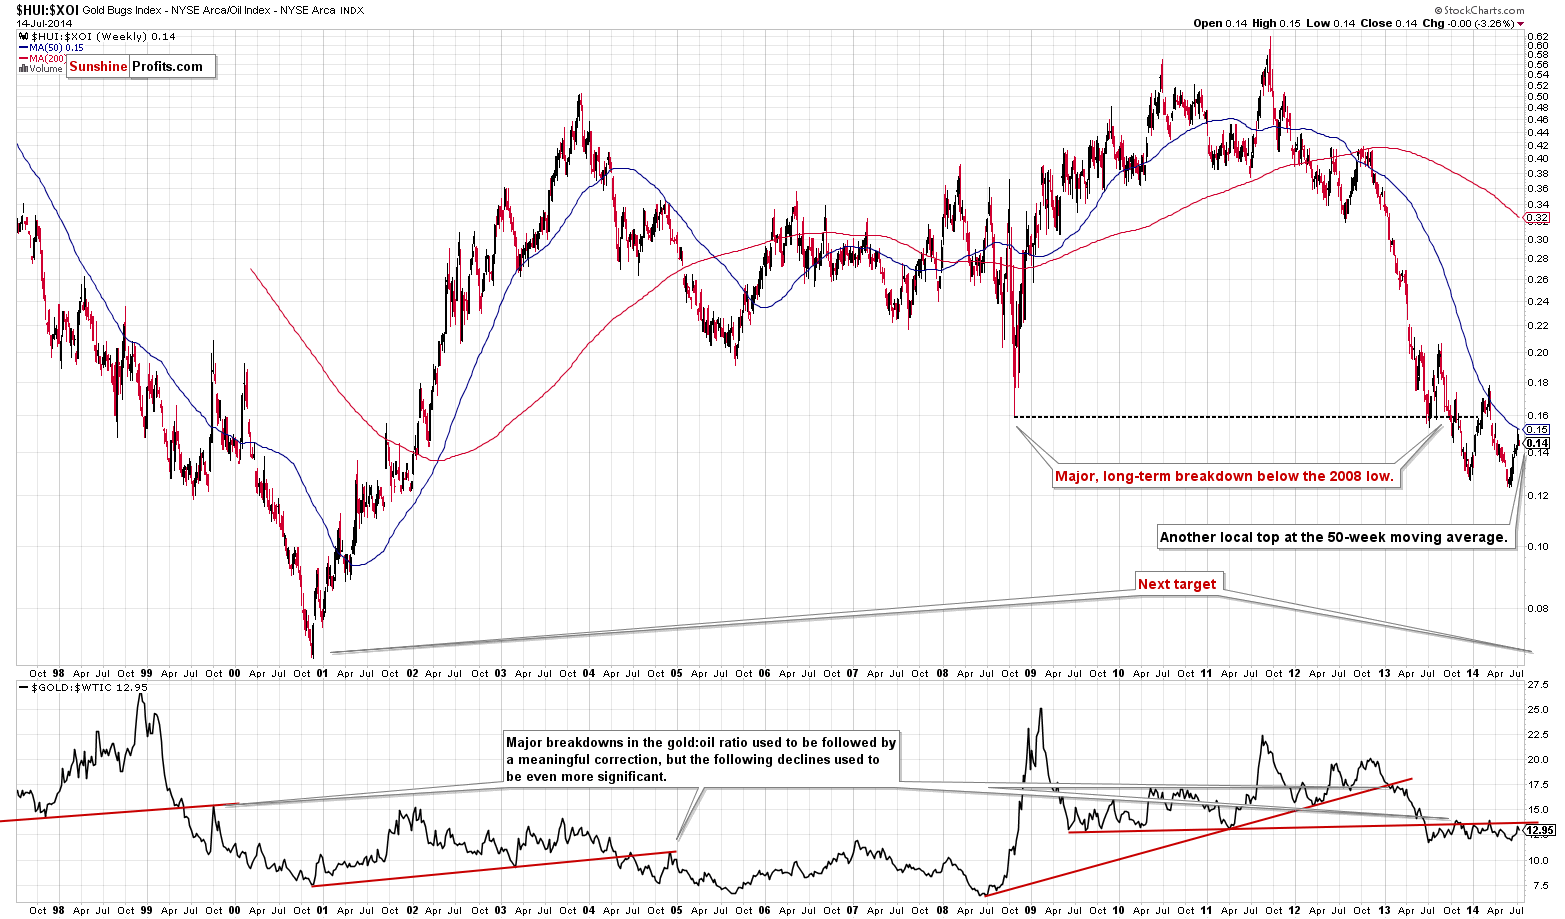
Today we would like to draw your attention to a little-followed ratio that can at times clarify quite a lot. The above HUI to XOI chart shows how well gold mining stocks have performed relative to oil stocks. At this time it tells us 3 things:
- Gold stocks have more than confirmed their breakdown below their 2008 low (from this perspective)
- Gold stocks remain in a huge downtrend
- Gold stocks seem to have topped once again at the 50-week moving average.
All of the above points are bearish for gold stocks and for the rest of the precious metals sector.
The situation in the USD Index and the juniors sector continues to support the bearish outlook for the precious metals sector (what we wrote on Thursday about it remains up-to-date). The same goes for silver.
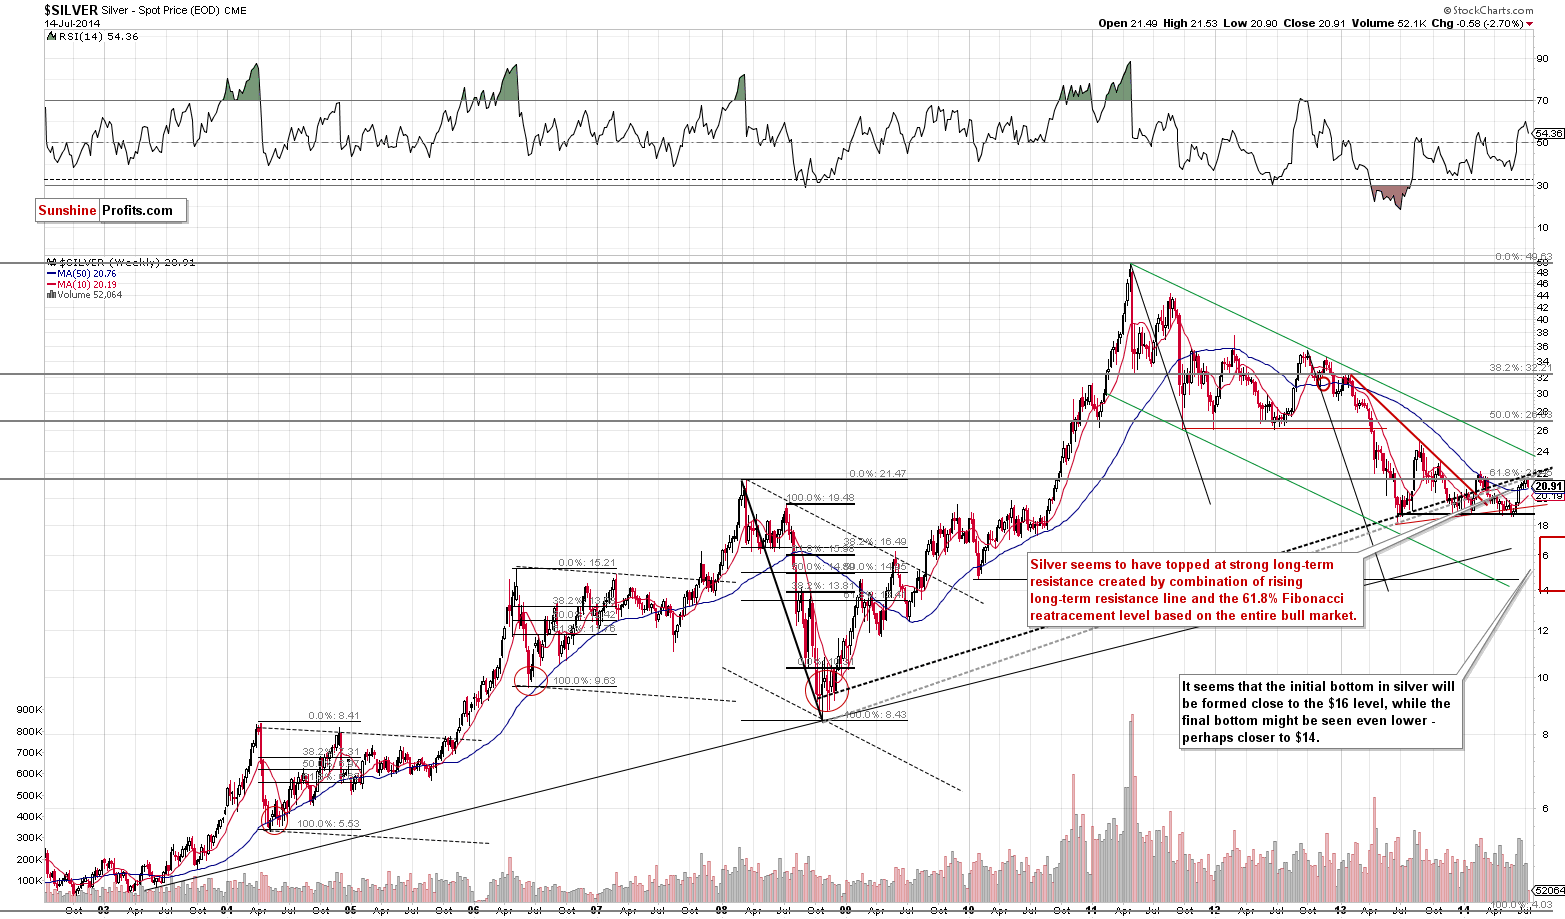
We have previously written the following about silver:
The strong, long-term resistance levels were just reached. We saw a small breakout but it was invalidated earlier today. Since the medium-term trend remains down (lower highs), we can expect the next move lower to begin shortly. The short-term picture supports this outlook as well.
It seems that the next move lower has already begun.
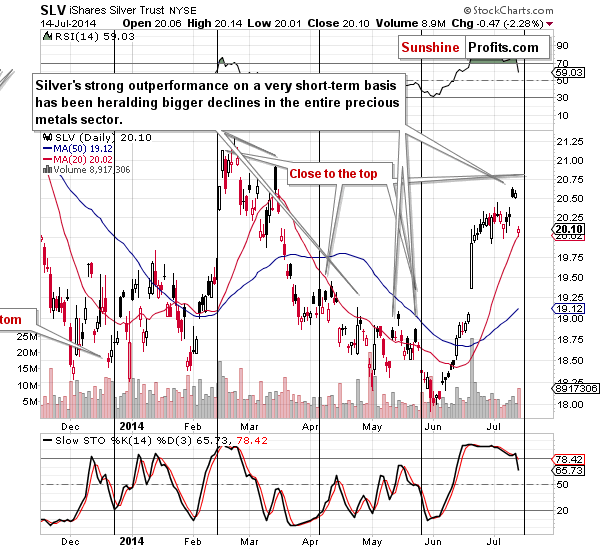
Again, our previous comments remain up-to-date:
Not only has silver outperformed gold and miners on a very short-term basis, but it is now very close to the next turning point. The previous move was definitely up, so the turning point has bearish implications.
It seems that the turning point has already worked. Let’s keep in mind that these points work on a near-to basis, so it’s important to pay extra attention to the silver market close to them. We have emphasized their importance quite recently and we have just seen them in practice once again.
The medium-term outlook for the USD Index remains bullish and so does the short-term picture.
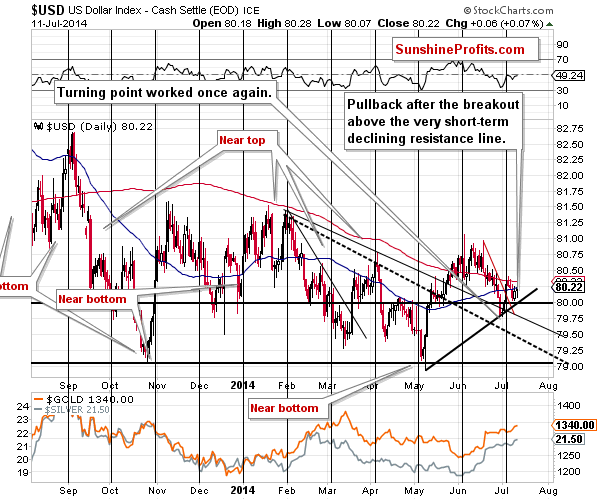
Basically, everything that we wrote about the USD Index yesterday remains up-to-date, as the index moved higher by only 0.07% yesterday:
The support lines and the psychologically important 80 level remain unbroken. The USD Index hasn’t rallied today (and hasn’t moved below the support lines either), which means that gold’s and silver’s decline materialized without the dollar’s help, which is a bearish sign, especially that they are likely to receive the dollar’s help (to decline more) sooner rather than later.
Summing up, on Friday we planned to wait for a bearish confirmation before entering short positions, and we got what we had waited for today. The situation is not clearly bearish in the short term, but, in our opinion, it’s bearish enough in order to justify a small short position in the sector. In fact the short positions that were entered shortly after yesterday’s alert was posted are already profitable. Once gold proves that it can stay below the 300-day moving average for 2 more consecutive trading days and then mining stocks move below their declining short-term support line (currently close to $26 in the case of the GDX ETF), we will consider doubling the short position. For now, it seems that only small positions are justified from the risk/reward perspective.
To summarize:
Trading capital (our opinion): Short (half) position in gold, silver and mining stocks with the following stop-loss levels:
- Gold: $1,353
- Silver: $21.73
- GDX ETF: $28.30
Long-term capital (our opinion): No positions
Insurance capital (our opinion): Full position
Please note that a full position doesn’t mean using all of the capital for a given trade. You will find details on our thoughts on gold portfolio structuring in the Key Insights section on our website.
As always, we'll keep you - our subscribers - updated should our views on the market change. We will continue to send out Gold & Silver Trading Alerts on each trading day and we will send additional Alerts whenever appropriate.
The trading position presented above is the netted version of positions based on subjective signals (opinion) from your Editor, and the automated tools (SP Indicators and the upcoming self-similarity-based tool).
As a reminder, Gold & Silver Trading Alerts are posted before or on each trading day (we usually post them before the opening bell, but we don't promise doing that each day). If there's anything urgent, we will send you an additional small alert before posting the main one.
Thank you.
Sincerely,
Przemyslaw Radomski, CFA
Founder, Editor-in-chief
Gold & Silver Trading Alerts
Forex Trading Alerts
Oil Investment Updates
Oil Trading Alerts

