

Trading position (short-term; our opinion): Short positions (with a stop-loss order at $56.45 and an initial downside target at $45.81) are justified from the risk/reward perspective.
On Tuesday, the black gold lost 1.58% ahead of weekly data from the U.S. on crude oil inventories and refined products. As a result, light crude dropped below the previously-broken resistance line, invalidating the earlier breakout. What does it mean for crude oil? Will we see a test of the barrier of $50 in the coming days?
Let’s examine the charts below to find out (charts courtesy of http://stockcharts.com).
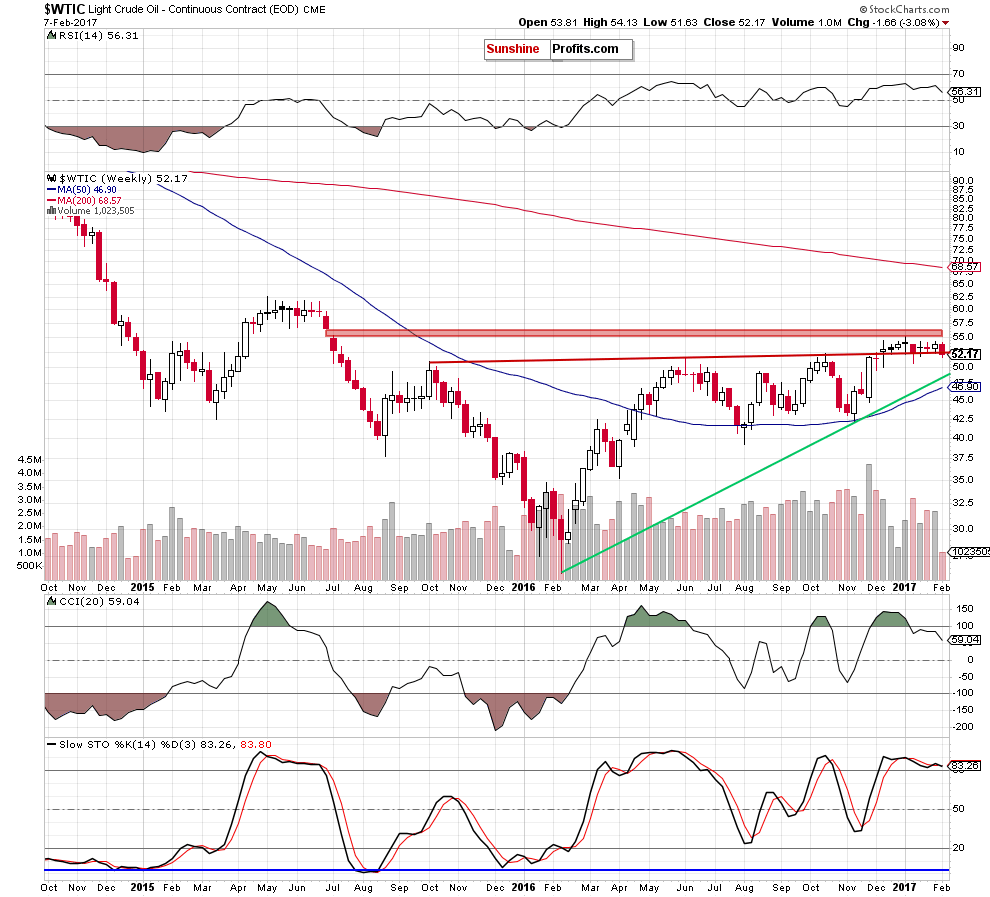
Looking at the weekly chart, we see that the situation in the medium term has deteriorated slightly as crude oil dropped under the long-term red line. Additionally, the Stochastic Oscillator re-generated the sell signal, suggesting another attempt to move lower. Nevertheless, in our opinion, such price action will be more likely and reliable if the commodity closes this week below it.
Will oil bears manage to push crude oil lower? Let’s examine the very short-term chart and look for more clues about future moves.
Quoting our last commentary:
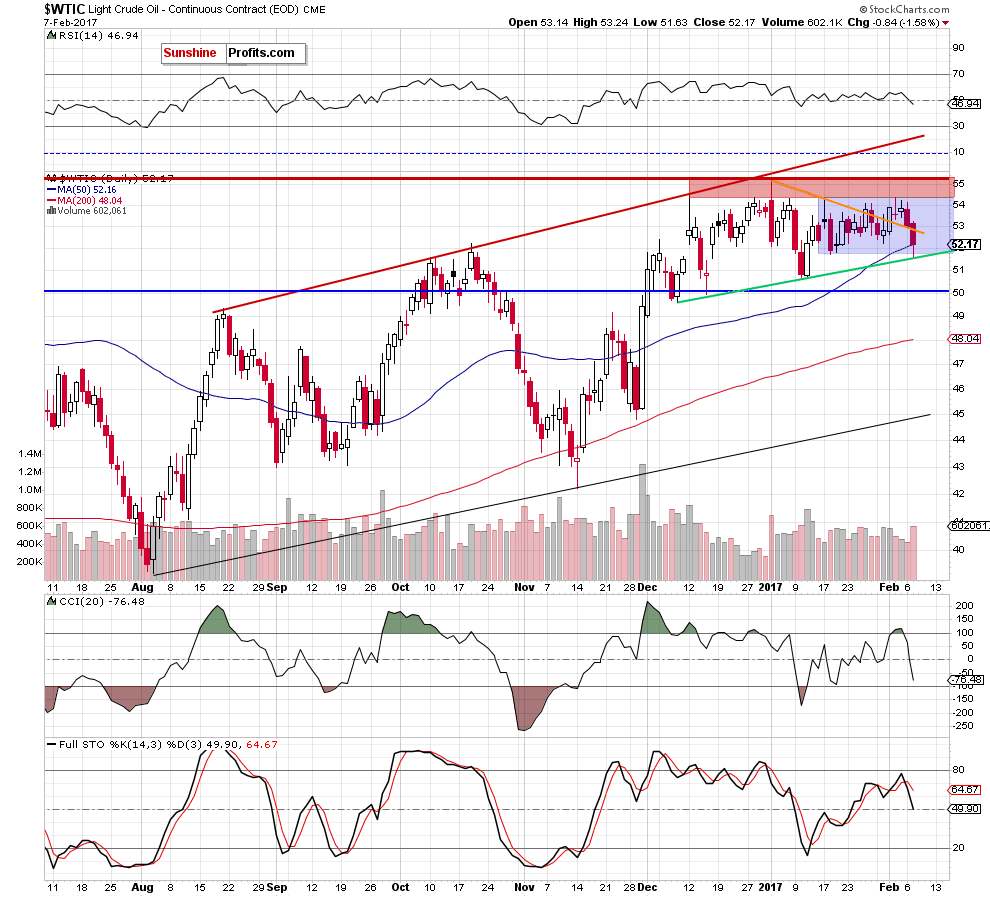
(…) crude oil dropped the previously-broken orange declining line, which serves now as the nearest support.
What’s next? Although this short-term line could trigger a rebound, we should keep in mind that the daily CCI and the Stochastic Oscillator re-generated the sell signals, increasing the probability of further deterioration. If this is the case and light crude closes today’s session under the orange line, we’ll see an invalidation of the earlier breakout, which will give oil bears another important reason to act.
In this case, the next downside target will be around $51.70-$52.08, where the green support line based on the previous lows, the lower border of the blue consolidation and the 50-day moving average are.
From today’s point of view, we see that the situation developed in line with our yesterday’s assumptions and crude oil dropped to our downside target. Although the green support line based on the previous lows triggered a rebound, the size of volume that accompanied yesterday’s decline was significant, which suggests that oil bears are getting stronger. Taking this fact, the sell signals and the medium-term picture into account, we believe that further deterioration is just around the corner.
At this point, it is worth noting that after yesterday’s market closure the American Petroleum Institute reported that crude oil inventories jumped 14.23 million barrels at the end of last week. Additionally, gasoline inventories rose 2.9 million barrels, while distillate stocks gained by 1.37 million barrels, which is a strong bearish development. As a result, crude oil futures extended losses and are trading around $51.60 at the moment of writing these words. Therefore, in our opinion, if today’s government data also shows a significant increase in crude oil and fuel inventories, we’ll likely see an acceleration of declines.
In this case, the initial downside target will be around $50.71-$50.75, where the January lows are. If this support is broken, the next target for oil bears will be the barrier of $50.
Finishing today’s commentary, please keep in mind what we wrote about the long-term relationship between gold and crude oil:
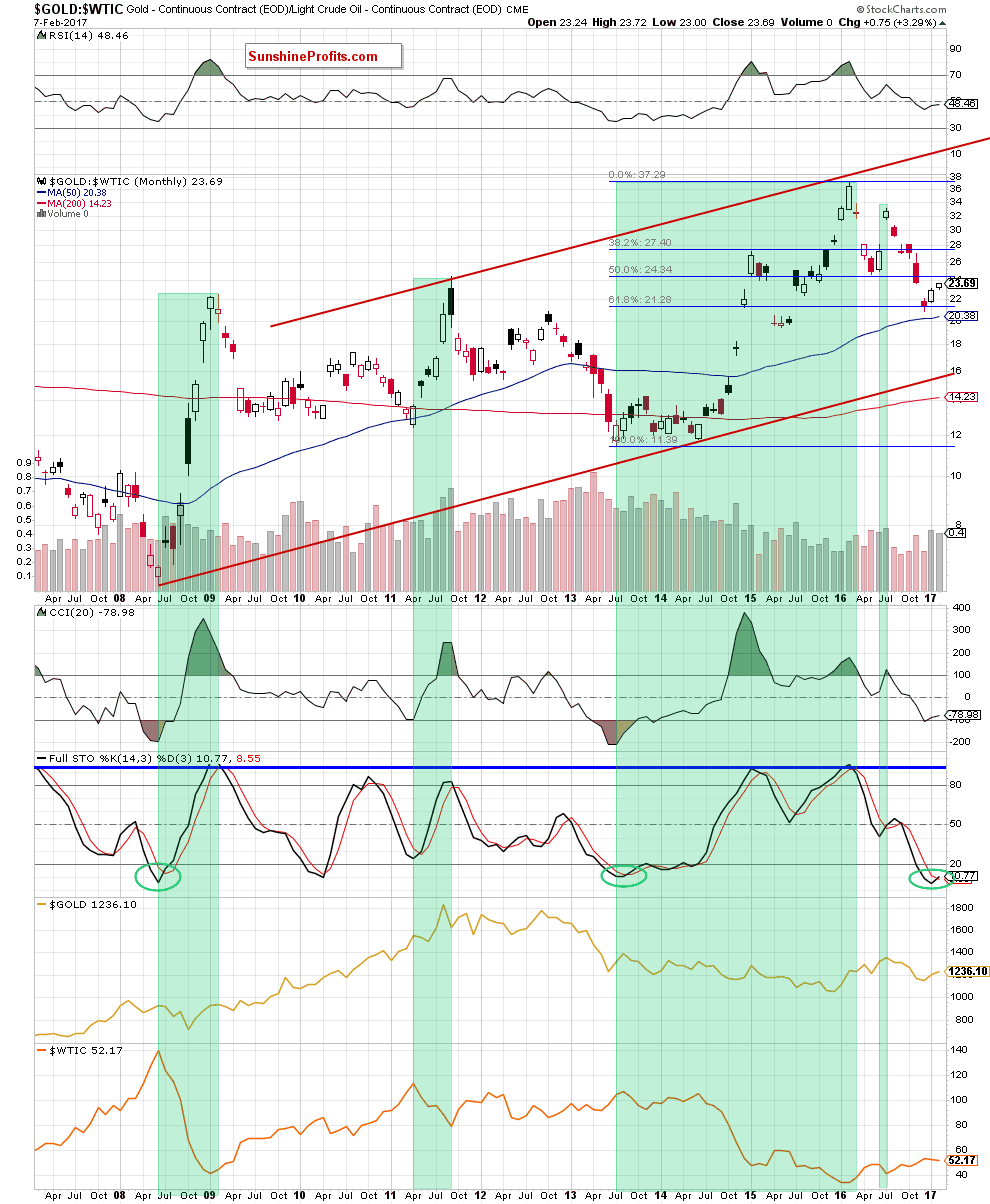
(...) the gold-to-oil ratio slipped slightly below the 61.8% Fibonacci retracement (based on the entire July 2013-February 2016 upward move), but then reversed and rebounded. Thanks to this move the ratio invalidated the earlier small breakdown under this support level, which is a positive signal that suggests further improvement – especially when we factor in the current position of the indicators. As you see, the CCI and the Stochastic Oscillator generated the buy signals, which suggest that another attempt to move higher is just around the corner.
What does it mean for crude oil? As you see on the above charts, may times in the past higher values of the ratio have corresponded to lower prices of light crude. We have seen this strong negative correlation in the second half of June 2008, between April and September 2011, between July 2013 and February 2016 and also between June and July 2016 (we marked all these periods with green), which suggests that another (smaller or bigger) rebound of the ratio will translate into lower values of crude oil in the coming days or even weeks. Therefore, in our opinion, it’s worth to keep an eye on the above chart to receive confirmation of the reversal.
Summing up, short positions continue to be justified as crude oil declined below the previously-broken orange support line, invalidating the earlier breakout. This bearish development together with the sell signals (generated by the weekly and daily indicators) and the current situation in the gold-to-oil ratio (if you want to know more about this and other interesting ratios, we encourage to sign up to our monthly Oil Investment Updates) suggest further deterioration and a test of the barrier of $50 in the coming days.
Very short-term outlook: bearish
Short-term outlook: mixed with bearish bias
MT outlook: mixed
LT outlook: mixed
Trading position (short-term; our opinion): Short positions (with a stop-loss order at $56.45 and an initial downside target at $45.81) are justified from the risk/reward perspective. We will keep you informed should anything change, or should we see a confirmation/invalidation of the above.
As a reminder – “initial target price” means exactly that – an “initial” one, it’s not a price level at which we suggest closing positions. If this becomes the case (like it did in the previous trade) we will refer to these levels as levels of exit orders (exactly as we’ve done previously). Stop-loss levels, however, are naturally not “initial”, but something that, in our opinion, might be entered as an order.
Thank you.
Nadia Simmons
Forex & Oil Trading Strategist
Przemyslaw Radomski, CFA
Founder, Editor-in-chief, Gold & Silver Fund Manager
Gold & Silver Trading Alerts
Forex Trading Alerts
Oil Investment Updates
Oil Trading Alerts

