

Trading position (short-term; our opinion): Long positions (with a stop-loss order at $41.39 and initial upside target at $49.53) are currently justified from the risk/reward perspective.
On Thursday, crude oil climbed above $47 supported by rising optimism over an OPEC deal to limit production. However, a rallying greenback capped gains, which triggered a small pullback. As a result, light crude gained 0.90% and closed the day above the last week’s high. Will this verification of earlier breakout encourage oil bulls to push the commodity higher in the coming days?
Let’s examine the charts below and try to find out (charts courtesy of http://stockcharts.com).
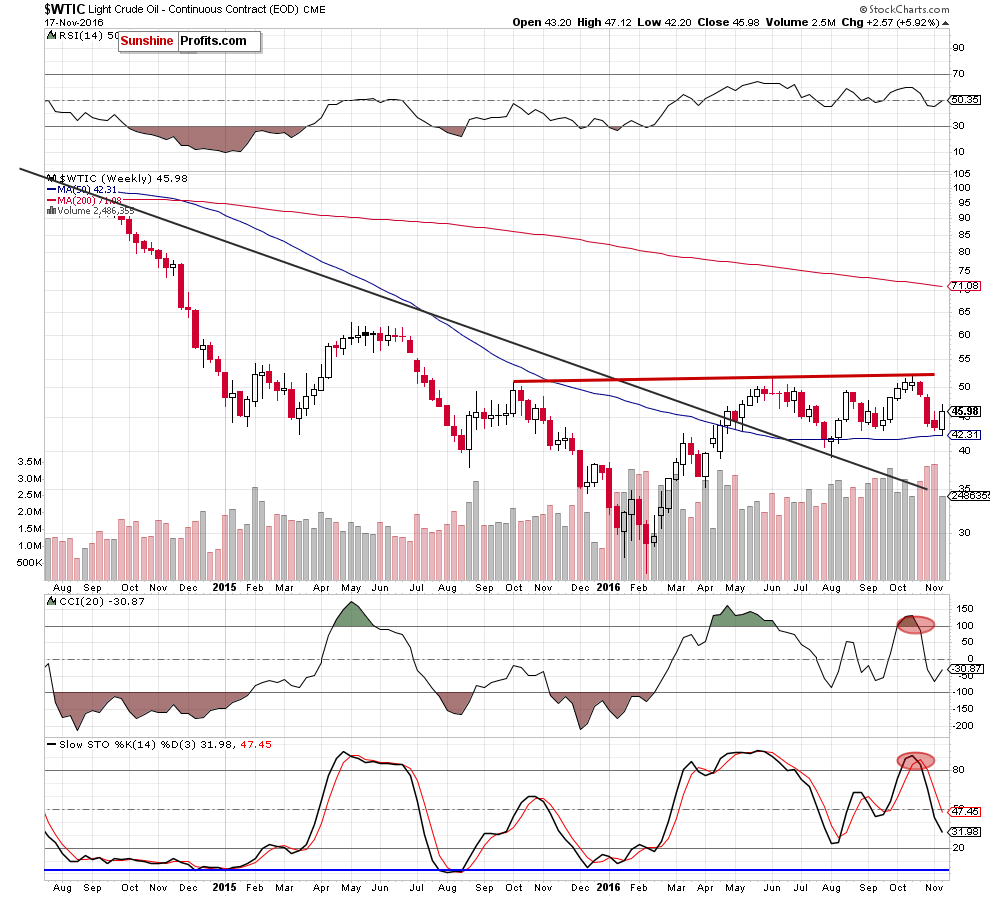
Looking at the weekly chart, we see that although crude oil moved little lower earlier this week, the 50-week moving average stopped further deterioration triggering a rebound.
How did this increase affect the very short-term chart? Let’s examine the day and find out.
Yesterday, we wrote the following:
(…) although crude oil moved little lower and invalidated the breakout above the last week’s high yesterday, oil bulls pushed the commodity higher earlier today. With this move, the black gold came back to around yesterday’s high, which suggests further improvement – especially when we factor in buy signals generated by the indicators, which continue to support higher prices.
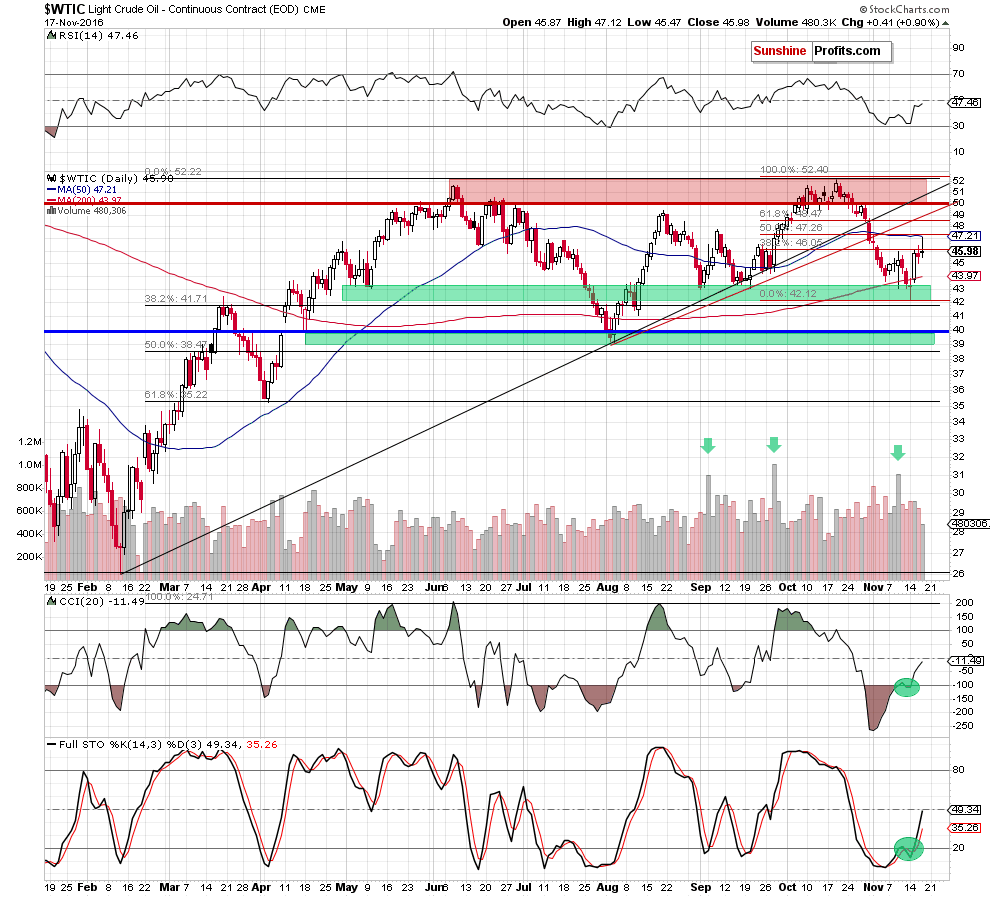
From the daily perspective, we see that oil bulls pushed the commodity higher as we had expected. With this increase light crude reached the previously-broken 50-day moving average, which in combination with the 50% Fibonacci retracement triggered a pullback. Despite this drop, crude oil closed the day above the last week’s high, which looks like a verification of earlier breakout.
If this is the case, light crude will extend gains and we’ll see (at least) a re-test of yesterday’s high. Nevertheless, taking into account the fact that buy signals generated by the indicators remain in place, we think that higher prices of crude oil (even an increase to the previously-broken red and black resistance lines) are very likely – especially if the black gold closes this week above the last week’s high (in this case we’ll see a bullish engulfing pattern on the weekly chart).
Are there any other technical factors that could encourage oil bulls to act in the coming days? Let’s examine the charts below and find out.
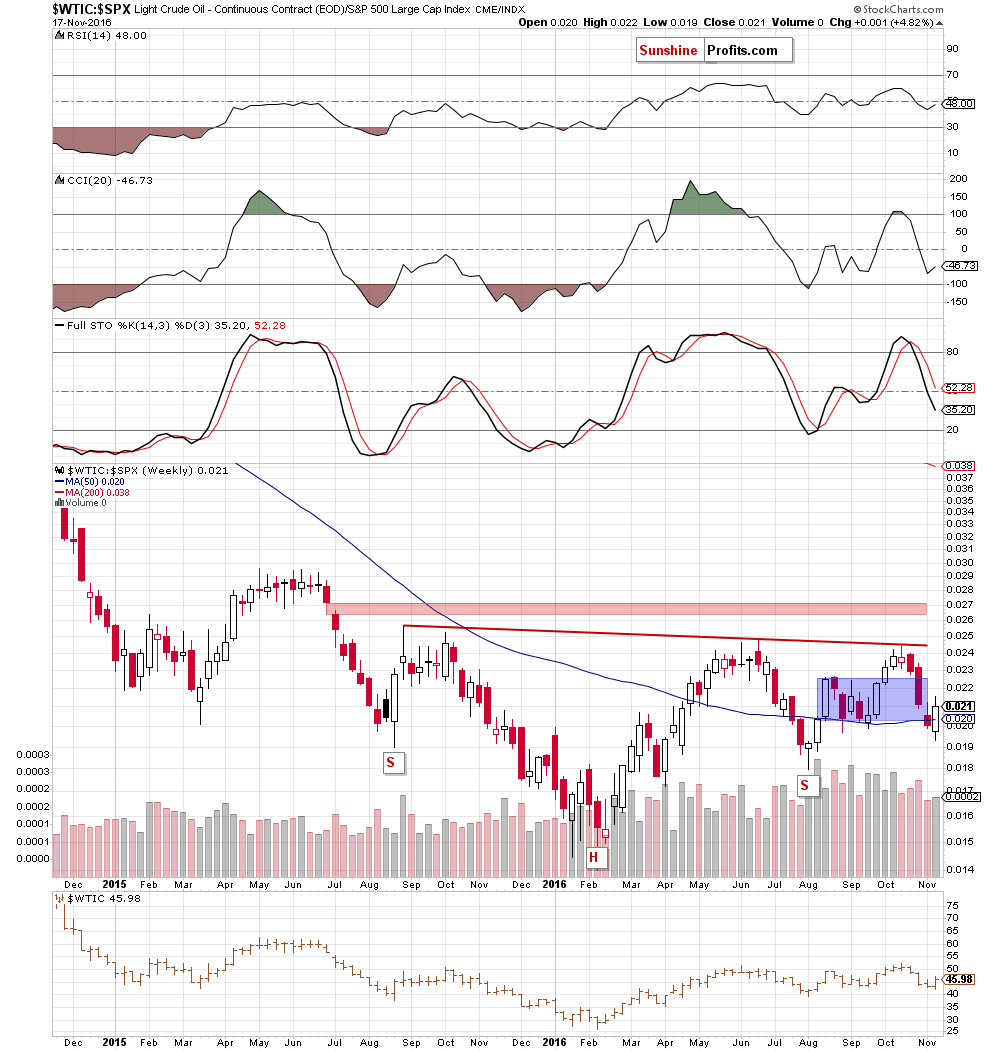
The first thing that catches the eye on the weekly chart of the oil-to-stocks ratio is invalidation of a breakdown under the 50-week moving average, which resulted in a rebound and a comeback to the blue consolidation.
What impact did this move have on the daily chart?
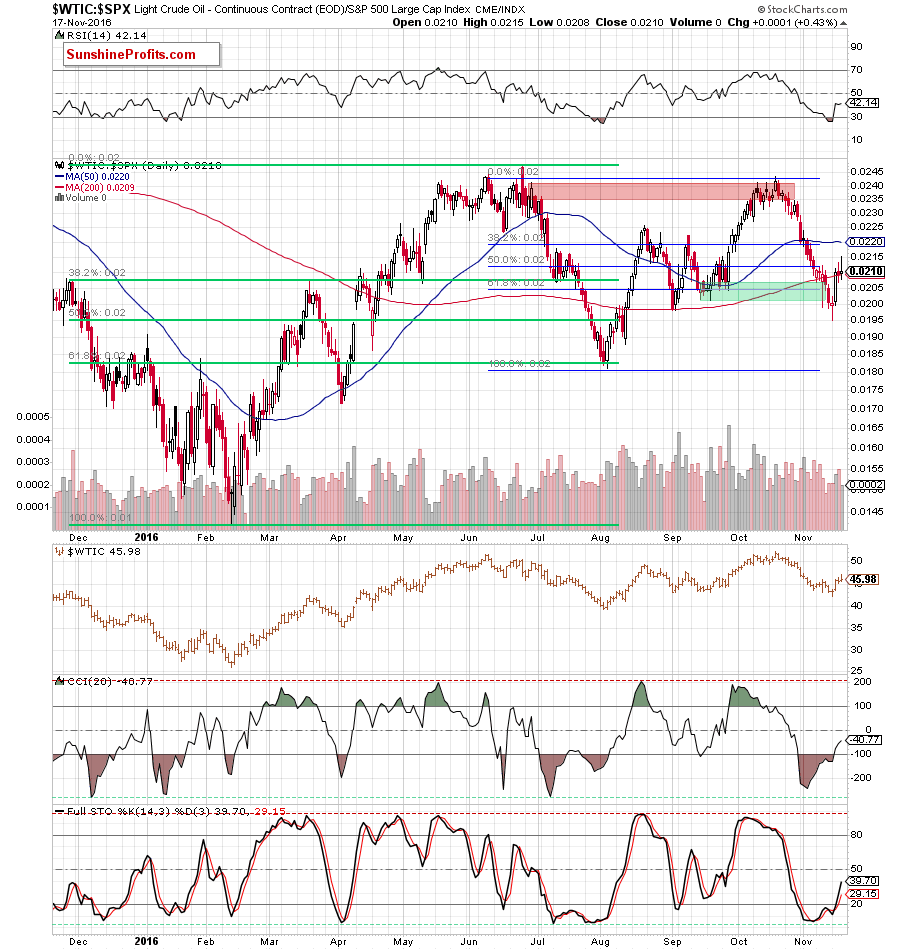
As you see the ratio came back above the 200-day moving average and the green support zone (invalidating earlier breakdowns), which in combination with buy signals generated by the indicators continues to support further improvement in the ratio and also in crude oil (as strong positive correlation remains in place). Additionally (similarly to what we wrote in the case of crude oil) if the ratio closes the week above he last week’s high we’ll receive one more pro-growth factor – a bullish engulfing pattern.
Summing up, crude oil moved higher once again and verified earlier breakout above the last week’s high, which in combination with the current situation in the oil-to-stocks ratio and buy signals generated by the indicators (in the case of crude oil and also in the ratio) suggests that higher prices of the black gold are just around the corner.
Very short-term outlook: bullish
Short-term outlook: bullish
MT outlook: mixed with bullish bias
LT outlook: mixed
Trading position (short-term; our opinion): Long positions (with a stop-loss order at $41.39 and initial upside target at $49.53) are currently justified from the risk/reward perspective. We will keep you informed should anything change, or should we see a confirmation/invalidation of the above.
As a reminder – “initial target price” means exactly that – an “initial” one, it’s not a price level at which we suggest closing positions. If this becomes the case (like it did in the previous trade) we will refer to these levels as levels of exit orders (exactly as we’ve done previously). Stop-loss levels, however, are naturally not “initial”, but something that, in our opinion, might be entered as an order.
Thank you.
Nadia Simmons
Forex & Oil Trading Strategist
Przemyslaw Radomski, CFA
Founder, Editor-in-chief, Gold & Silver Fund Manager
Gold & Silver Trading Alerts
Forex Trading Alerts
Oil Investment Updates
Oil Trading Alerts

