

Trading position (short-term; our opinion): No positions are justified from the risk/reward perspective.
On Wednesday, crude oil extended gains after the Energy Information Administration showed another decline in crude oil inventories. In this environment, light crude hit an intraday high of $49.97, but will we see further rally in the coming week?
Although yesterday’s EIA report showed that gasoline inventories rose by 222,000 barrels, this increase was much smaller-than-expected. The report also showed that crude oil stockpiles dropped by 3 million barrels last week, confounding expectations for an increase. Thanks to these positive circumstances, light crude hit an intraday high of $49.97, but will we see further rally in the coming week?
Let’s examine the charts below and try to find out what can we expect in the coming days (charts courtesy of http://stockcharts.com).
On Monday, we wrote the following:
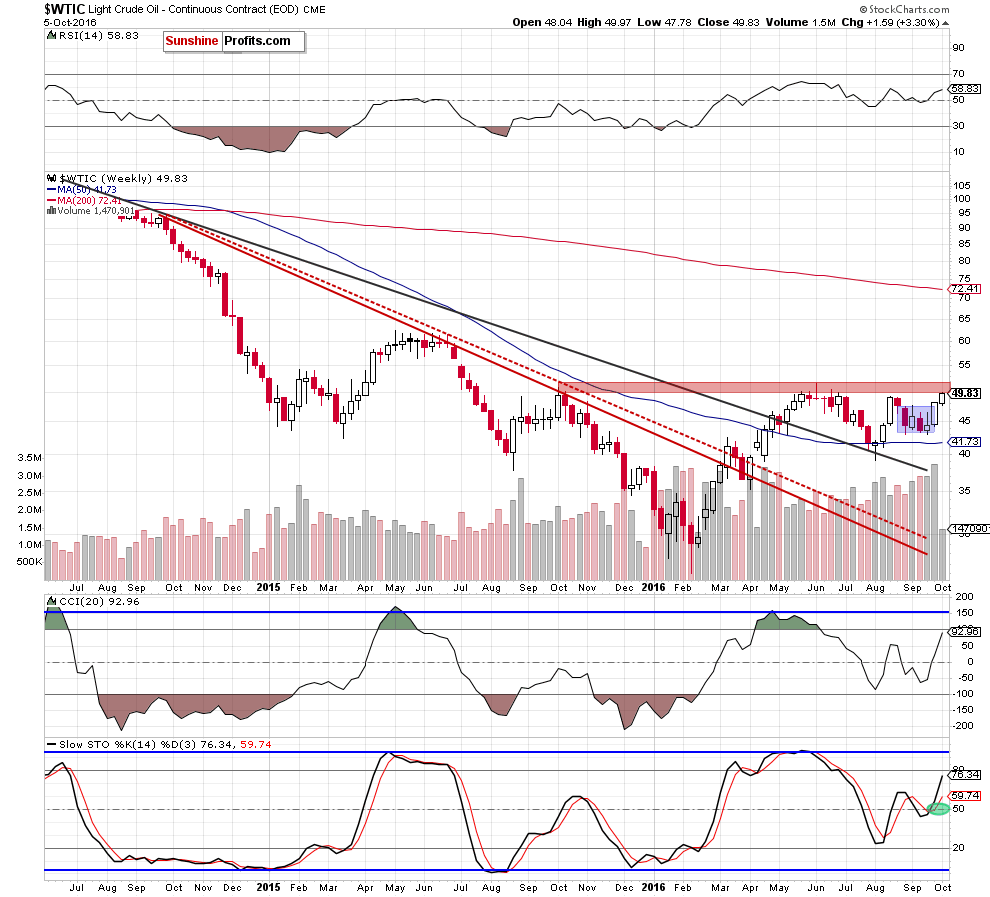
(…) the size of the volume that accompanied last week’s upward move was huge (the biggest in more than two years), which confirms oil bulls’ strength and supports higher prices of the commodity (in our opinion, light crude will test the red resistance zone marked on the weekly chart) in near future.
Yesterday, we added:
(…) Taking into account the fact that light crude rebounded from session’s low and closed the day above the first red zone, we think that yesterday’s move was just a verification of earlier breakout above this area. If this is the case, we should see further improvement and a climb to our next upside target in the coming day.
Looking at the above charts, we see that the situation developed in line with the above scenario and crude oil almost touched our upside target yesterday. What’s next? We think that the best answer to this question will be quotes from our previous alert:
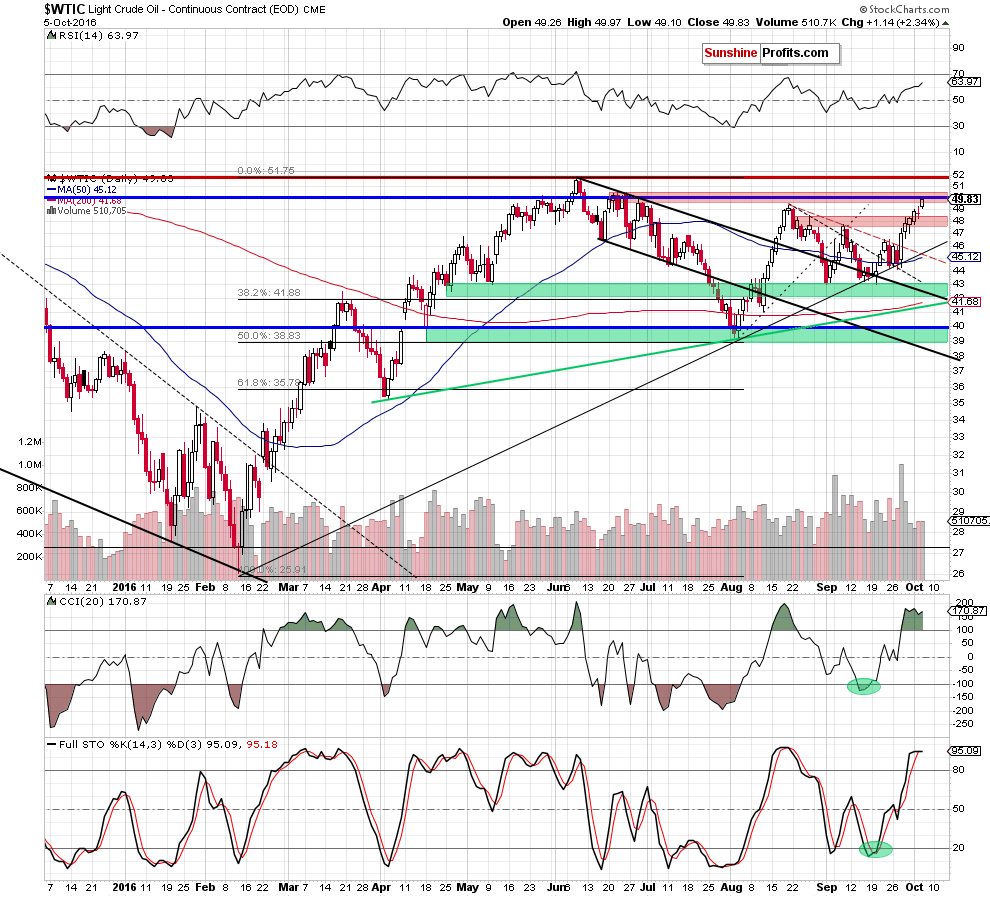
(…) we would like to draw your attention to several disturbing factors. Firstly, when we take a closer look at the daily chart, we notice that the size of volume that accompanied recent increases was decreasing in each passing day (since Sep 28). Additionally, yesterday’s small drop materialized on bigger volume than Friday’s or Monday’s upswing. This suggests that oil bulls may begin to lose their strength, which could translate into correction in the following days.
Secondly, the CCI and Stochastic Oscillator are overbought and remain at the highest levels since Sep high, which can encourage oil bears to act – similarly to what we saw several weeks ago.
Thirdly, we should keep in mind that crude oil approached a very solid resistance zone created by the Jun highs, the barrier of $50, the Oct 2015 peaks and the 2016 high (around $49-$51.67). As you see this area was strong enough to stop the rally in Aug, which in combination with all the above-mentioned factors can cause that history will repeat itself and we’ll see a correction (even if light crude moves little higher from current levels and test the strength of the next red zone first) in very near future.
On top of that when we examine the current situation in the oil-to-gold, oil-to-stocks and oil-to-oil stocks ratios (more about these and other interesting ratios you can know from our monthly Oil Investment Updates), we can add more negative factors.
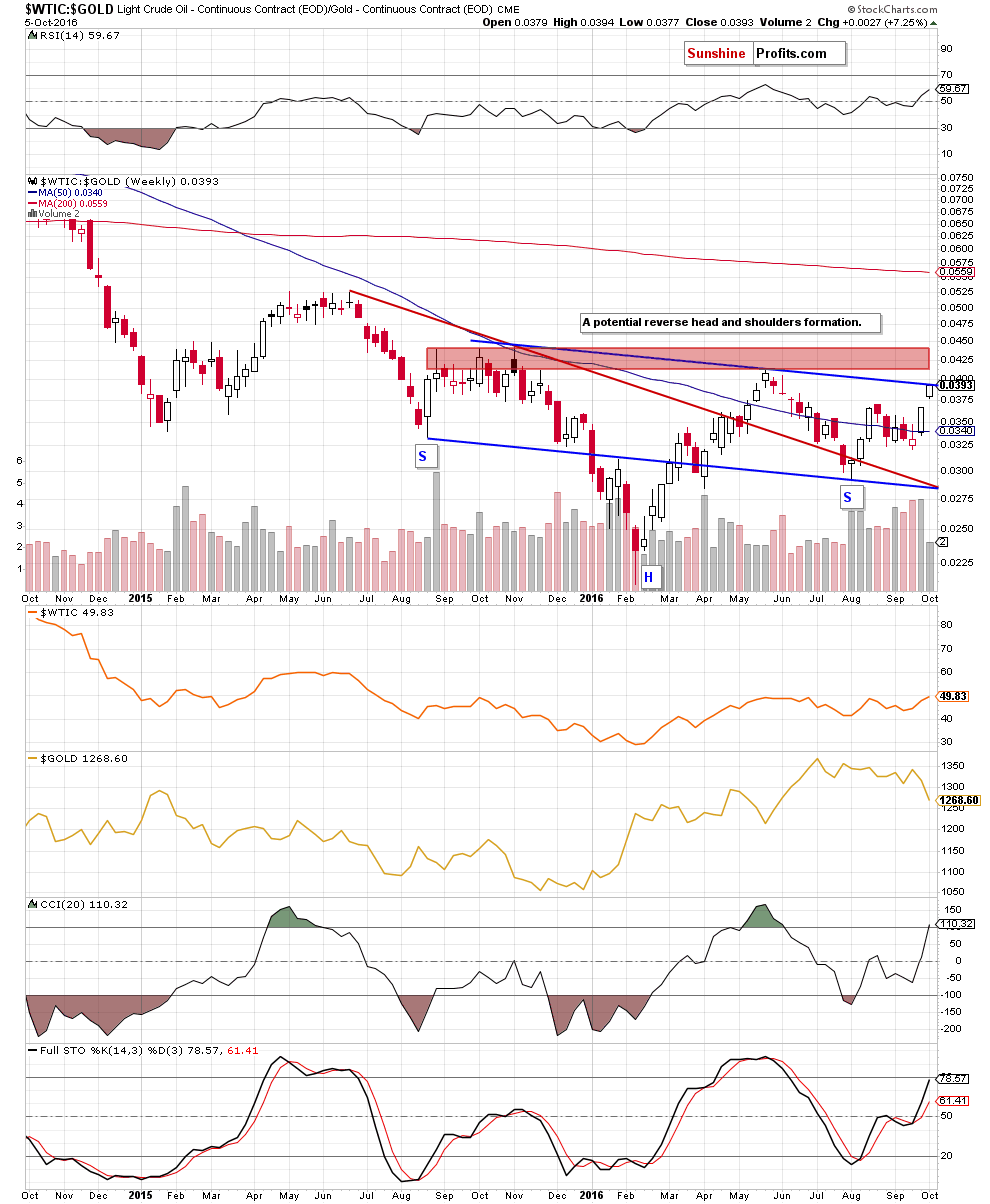
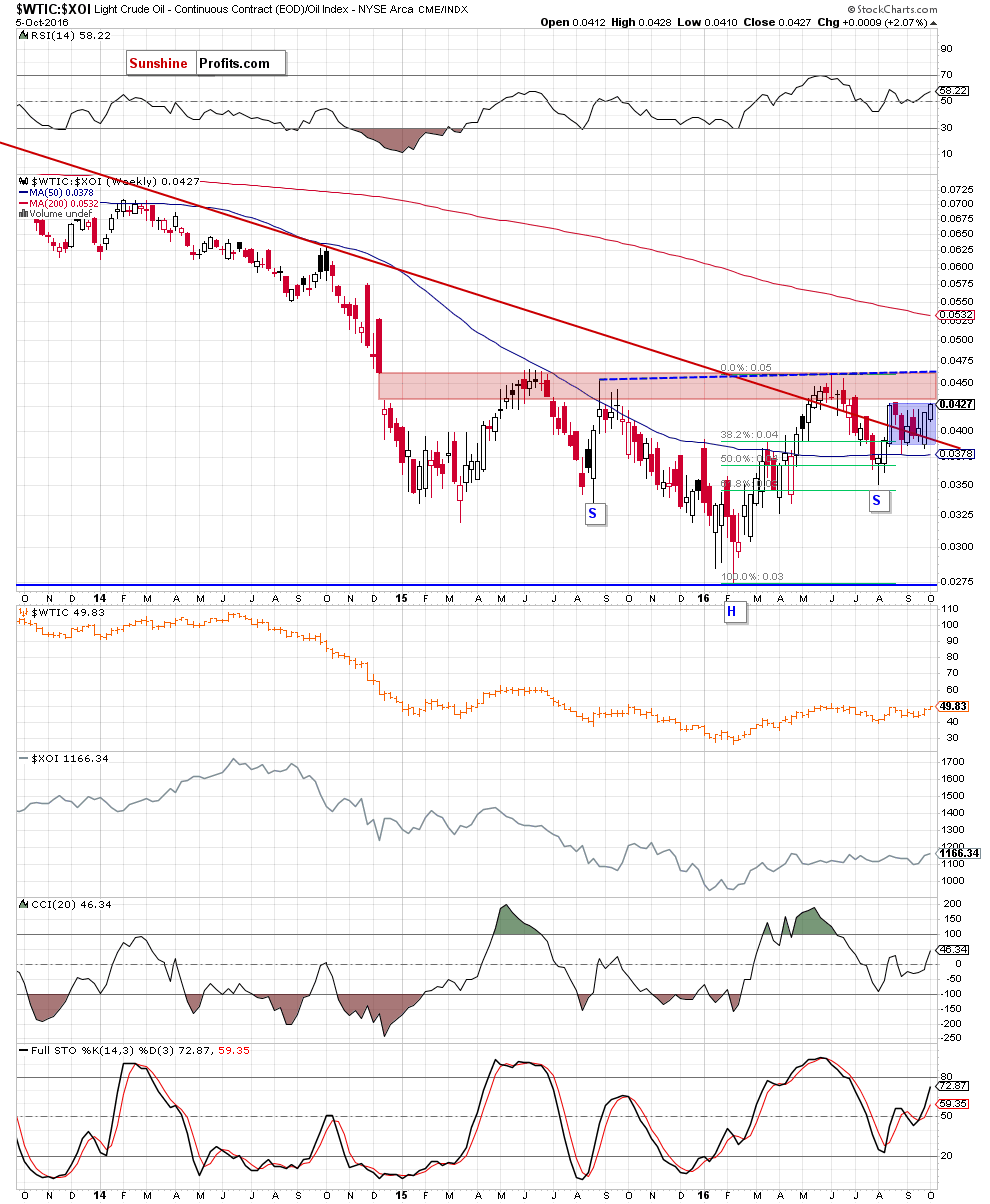
(…) the oil-to-gold ratio extended gains and almost touched the upper blue resistance line (a neck line of a potential reverse head and shoulder formation), which suggests that the space for gains may be limited. However, even if the ratio climbs little higher from the current levels, we think that as long as there won’t be a breakout above the May high and the red resistance zone another sizable move to the upside (in the ratio and also in crude oil) is not likely to be seen and reversal should not surprise us.
(…) What can we infer from the relationship between crude oil and the general stock market? Let’s examine the charts and find out.
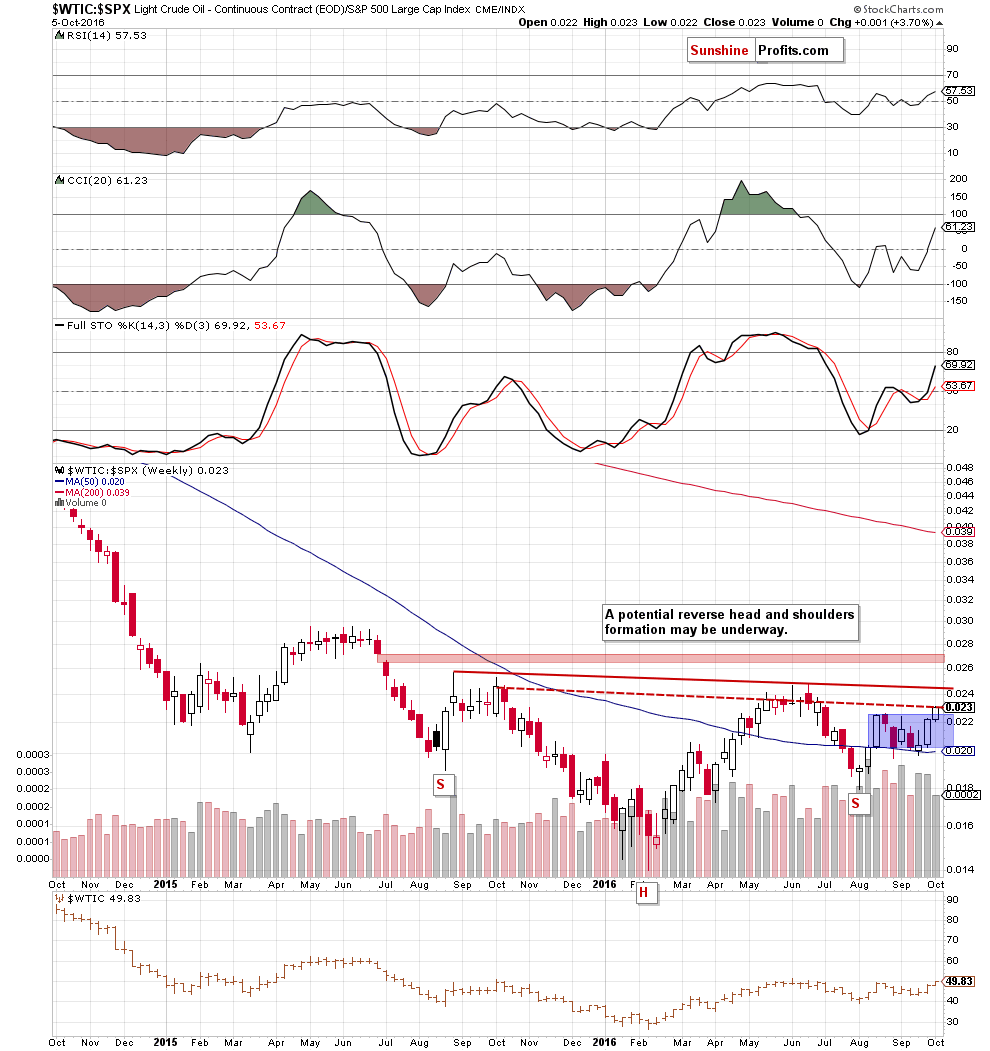
(…) the ratio increased slightly above the upper border of the blue consolidation and reached the red dashed line based on the weekly closing prices. As you see this resistance was strong enough to stop increases in May and Jun, which suggests that we can see similar price action this week.
Finishing today’s alert, let’s take a look at the oil-to-oil stocks ratio.
(…) the ratio not only reached the upper border of the blue consolidation, but also the key red resistance zone, which continues to keep gains in check since Dec 2014. Taking this fact into account, we think that even if the ratio (and crude oil as positive correlation remains in place) extends gains from here, as long as there won’t be a breakout and a weekly closure above the upper border of the zone (which is currently reinforced by the neck line of a potential reverse head and shoulders) further rally is not likely to be seen and another reversal is very likely.
Summing up, crude oil extended gains and reached the key resistance zone created by the Jun highs, the barrier of $50, the Oct 2015 peaks and the 2016 high (around $49-$51.67), which in combination with the current picture of the oil market that emerges from our ratios suggests that the space for gains may be limited and reversal is just around the corner.
Very short-term outlook: mixed
Short-term outlook: mixed
MT outlook: mixed
LT outlook: mixed
Trading position (short-term; our opinion): No positions are justified from the risk/reward perspective. We will keep you – our subscribers – informed should anything change.
Thank you.
Nadia Simmons
Forex & Oil Trading Strategist
Przemyslaw Radomski, CFA
Founder, Editor-in-chief, Gold & Silver Fund Manager
Gold & Silver Trading Alerts
Forex Trading Alerts
Oil Investment Updates
Oil Trading Alerts

