

Trading position (short-term; our opinion): Short positions (with a stop-loss order at $48.56 and initial downside target at $35.24) are justified from the risk/reward perspective.
On Wednesday, the commodity moved higher after the EIA report showed a smaller-than-expected increase in crude oil inventories. Another decline in domestic production supported the price of light crude as well. Thanks to these circumstances, the commodity climbed above the mid-Apr peak, hitting a fresh 2016 high. Will we see further improvement in the coming days?
Although the U.S. Energy Information Administration reported that crude oil inventories rose by 2.1 million barrels for the week ending on April 15, this increase was smaller than analysts’ forecasts and Tuesday’s API numbers (as a reminder, the American Petroleum Institute showed that U.S. crude stockpiles rose by 3.1 million barrels last week). The report also showed that distillate inventories dropped sharply by 3.6 million barrels, while gasoline inventories slipped by 0.1 million barrels. Additionally, crude inventories at the Cushing Oil Hub in Oklahoma dropped by 248,000 barrels. On top of that U.S. crude oil production declined to an 18-month low, which encouraged oil bulls to act. As a result, light crude climbed above the mid-Apr peak, hitting a fresh 2016 high. Will we see further improvement in the coming days? Let’s examine charts and try to answer this question (charts courtesy of http://stockcharts.com).
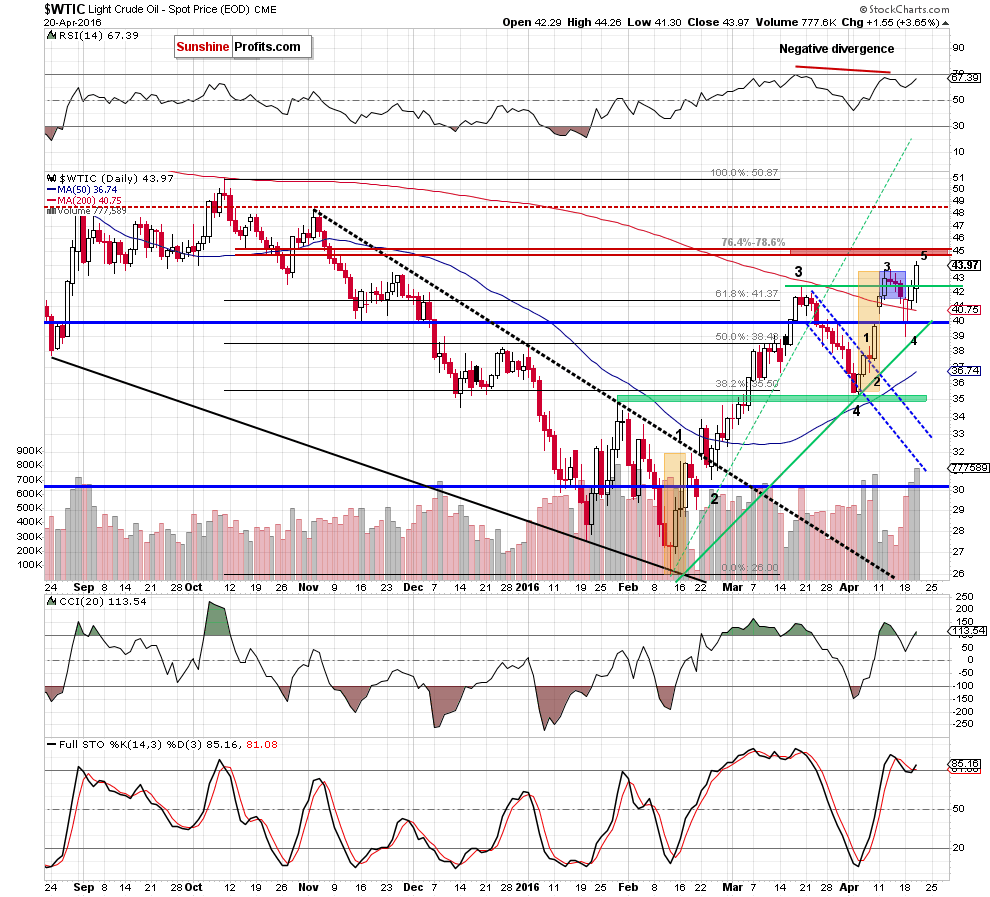
Looking at the daily chart, we see that crude oil moved higher once again, breaking above the mid-Apr high and hitting a fresh 2016 high of $44.26. Yesterday’s increase disturbed slightly our earlier idea of the layout of Elliott’s waves, however, didn’t exclude it completely.
In our previous assumption, we wrote that the first wave and the potential fifth wave are quite similar in terms of length and time. Nevertheless, as it turned out, the recent rally pushed crude oil to a new peak, suggesting that the fifth wave may be about 161.8% greater than the first wave. If this is the case, we may see another upswing even to around $44.83 in the coming days (additionally, if we consider the last upward move (since Apr 5) we can also discern five waves). At this point it is worth noting that in this area (around $45-$45.60) is also the red resistance zone created by the 76.4% and 78.6% Fibonacci retracement levels based on the Oct-Feb downward move, which could encourage oil bears to act.
Once we know the above, we would like to draw your attention to Fibonacci extensions based on earlier pullbacks. Firstly, when we consider the downward move from mid-March high of $42.49 to Apr low of $35.24, we see that the first important extension (127.2%) is around $44.46. Secondly, when we analyze extensions based on the recent decline (from $43.69 to $39), we notice that the 127.2% extension is around $44.96. Connecting the dots, both extensions are very close to current levels and the red resistance zone, which increases the likelihood of reversal in the coming day(s).
On top of that, there are negative divergences between the CCI, the Stochastic Oscillator and the price of the commodity, which could be an additional signal for oil bears.
Finishing today’s alert, we would also like to comment the current situation in the oil-to-gold and oil-to-silver ratios.
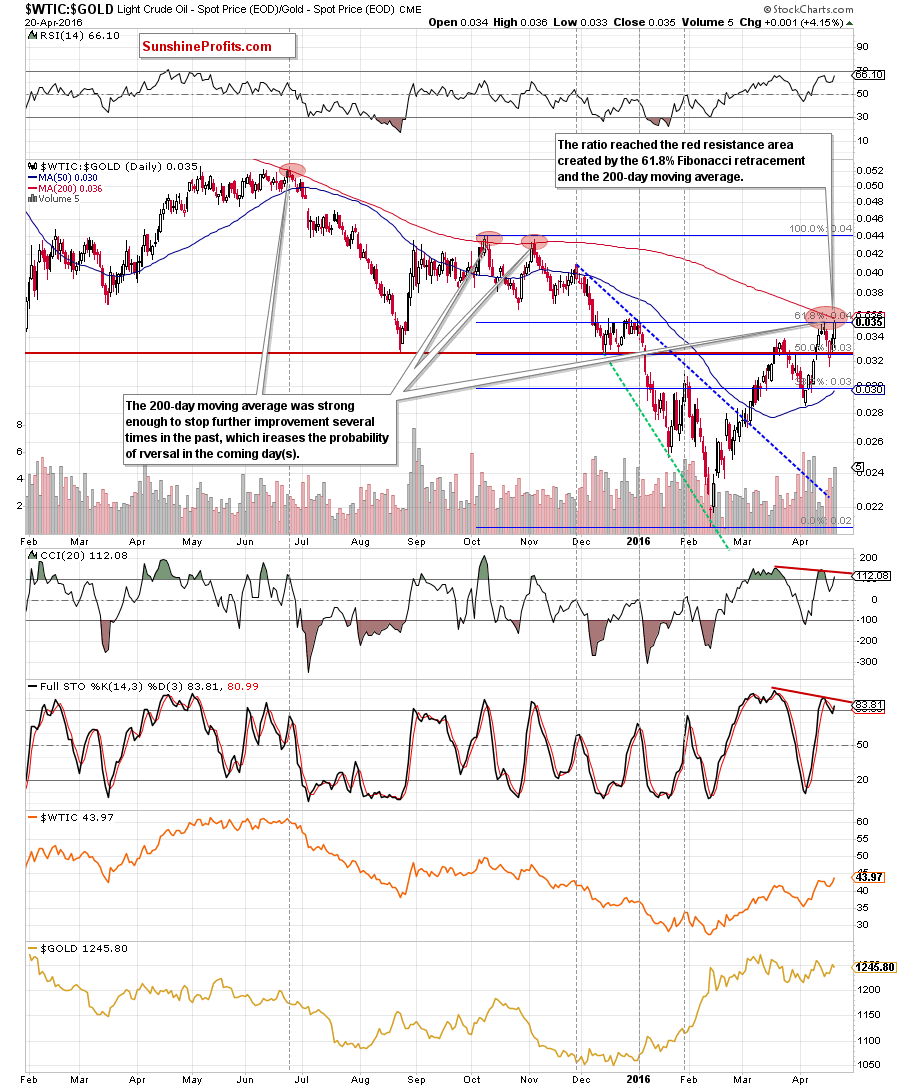
Looking at the above chart, we see that the ratio reached the red resistance zone created by the 61.8% Fibonacci retracement (based on the Oct-Feb downward move) and the 200-day moving average. As you see several times in the past, this important moving average was strong enough to stop further improvement (even if we saw small and very short-lived breakouts above it), which increases the probability of reversal in the coming day(s). Additionally, there are bearish divergences between the CCI, Stochastic Oscillator and the ratio, which may be another factor that will encourage oil bears to action in near future.
On top of that when we zoom out our picture, we notice one more interesting fact.
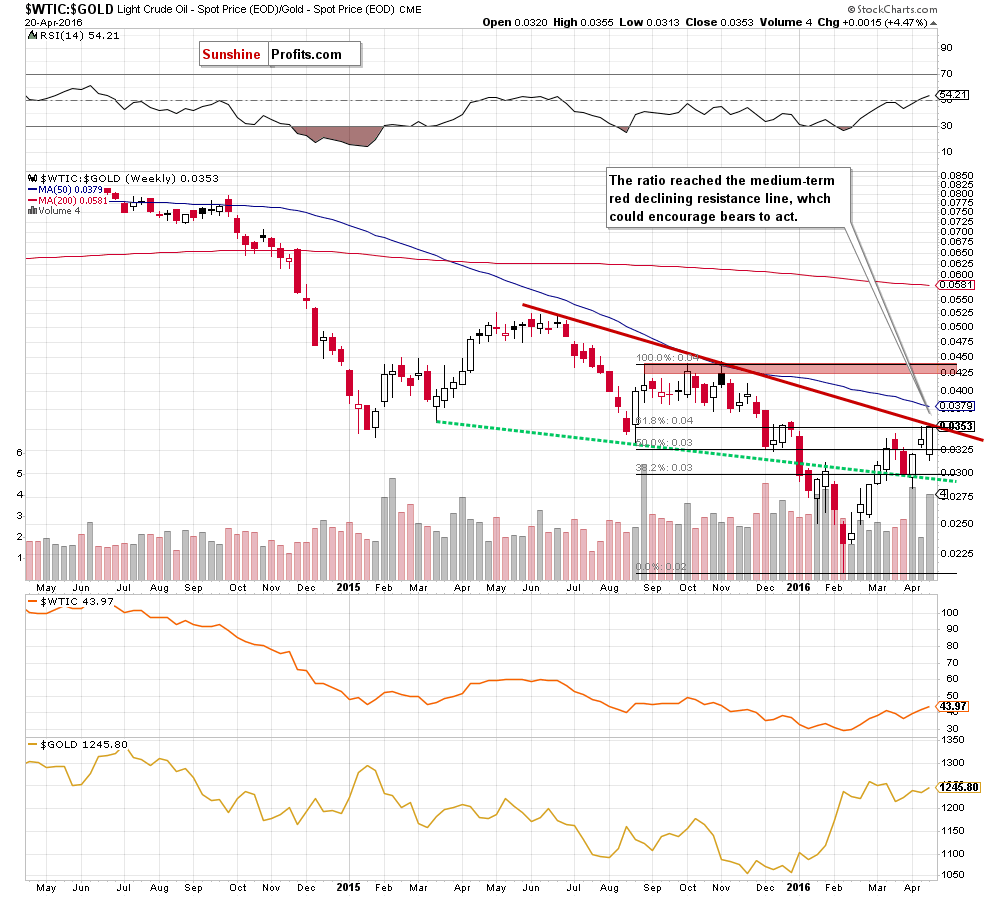
From this perspective, we see that the ratio reached the medium-term red declining resistance line, which is another pro-bearish factor, which could trigger a reversal in near future.
Once we know the current situation in the above ratio, let’s focus on the relationship between black gold and silver.
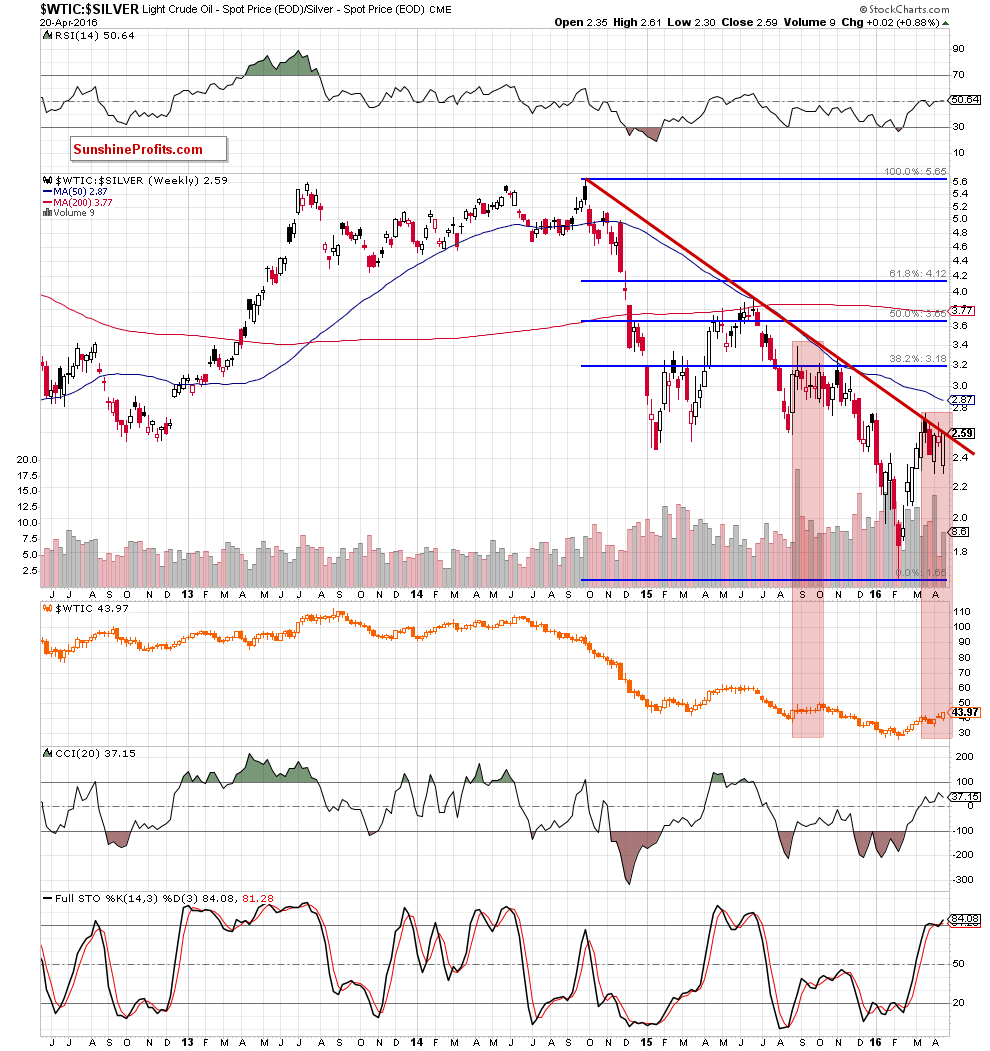
The first thing that catches the eye on the above chart is negative divergence between the ratio and the price of crude oil. When we took a closer look at the chart we noticed similar situation in the previous year. Back then, such price action preceded declines in the commodity, which suggests that history may repeat itself once again – especially when we factor in the proximity to the long-term red declining resistance line and high reading of the Stochastic Oscillator.
Summing up, although crude oil moved higher once again and hit a fresh 2016 high, the proximity to the red resistance zone marked on the daily chart, the current situation in the oil-to-gold and oil-to-silver rations, negative divergences between indicators and the price of crude oil (and also between indicators and the value of both ratios) suggest that the space for gains seems limited and reversal in near future is very likely
Very short-term outlook: berish
Short-term outlook: bearish
MT outlook: bearish
LT outlook: mixed with bearish bias
Trading position (short-term; our opinion): Short positions (with a stop-loss order at $48.56 and initial downside target at $35.24) are justified from the risk/reward perspective. We will keep you informed should anything change, or should we see a confirmation/invalidation of the above.
As a reminder – “initial target price” means exactly that – an “initial” one, it’s not a price level at which we suggest closing positions. If this becomes the case (like it did in the previous trade) we will refer to these levels as levels of exit orders (exactly as we’ve done previously). Stop-loss levels, however, are naturally not “initial”, but something that, in our opinion, might be entered as an order.
Since it is impossible to synchronize target prices and stop-loss levels for all the ETFs and ETNs with the main market that we provide this level for (crude oil), the stop-loss level and target price for popular ETN and ETF (among other: USO, DWTI, UWTI) are provided as supplementary, and not as “final”. This means that if a stop-loss or a target level is reached for any of the “additional instruments” (DWTI for instance), but not for the “main instrument” (crude oil in this case), we will view positions in both crude oil and DWTI as still open and the stop-loss for DWTI would have to be moved lower. On the other hand, if crude oil moves to a stop-loss level but DWTI doesn’t, then we will view both positions (in crude oil and DWTI) as closed. In other words, since it’s not possible to be 100% certain that each related instrument moves to a given level when the underlying instrument does, we can’t provide levels that would be binding. The levels that we do provide are our best estimate of the levels that will correspond to the levels in the underlying assets, but it will be the underlying assets that one will need to focus on regarding the sings pointing to closing a given position or keeping it open. We might adjust the levels in the “additional instruments” without adjusting the levels in the “main instruments”, which will simply mean that we have improved our estimation of these levels, not that we changed our outlook on the markets.
Thank you.
Nadia Simmons
Forex & Oil Trading Strategist
Przemyslaw Radomski, CFA
Founder, Editor-in-chief
Gold & Silver Trading Alerts
Forex Trading Alerts
Oil Investment Updates
Oil Trading Alerts

