

Trading position (short-term; our opinion): Short positions (with a stop-loss order at $35.63 and a price target at $25.63) are justified from the risk/reward perspective.
On Monday, crude oil lost 7.17% as disappointing Chinese data and fading optimism over supply cuts from Russia and OPEC countries weighed negatively on the price. Thanks to these circumstances, light crude invalidated earlier breakout above resistance levels and closed the day under $32. How low could the commodity go in the coming days?
Yesterday, official data showed that China’s manufacturing purchasing managers’ index slipped to 49.4 in the previous month, which was a drop to the lowest level since 2012. These disappointing numbers renewed worries over a slowdown in the world’s second biggest economy and weaker demand in the oil market (as a reminder, China’s imports surge to 7.8 million bpd in Dec). Additionally, chances of an emergency meeting of the OPEC and non-OPEC countries faded after an OPEC source commentary. Thanks to these circumstances, light crude invalidated earlier breakout above resistance levels and closed the day under $32. How low could the commodity go in the coming days? Let’s examine charts and find out (charts courtesy of http://stockcharts.com).
Quoting our Friday’s alert:
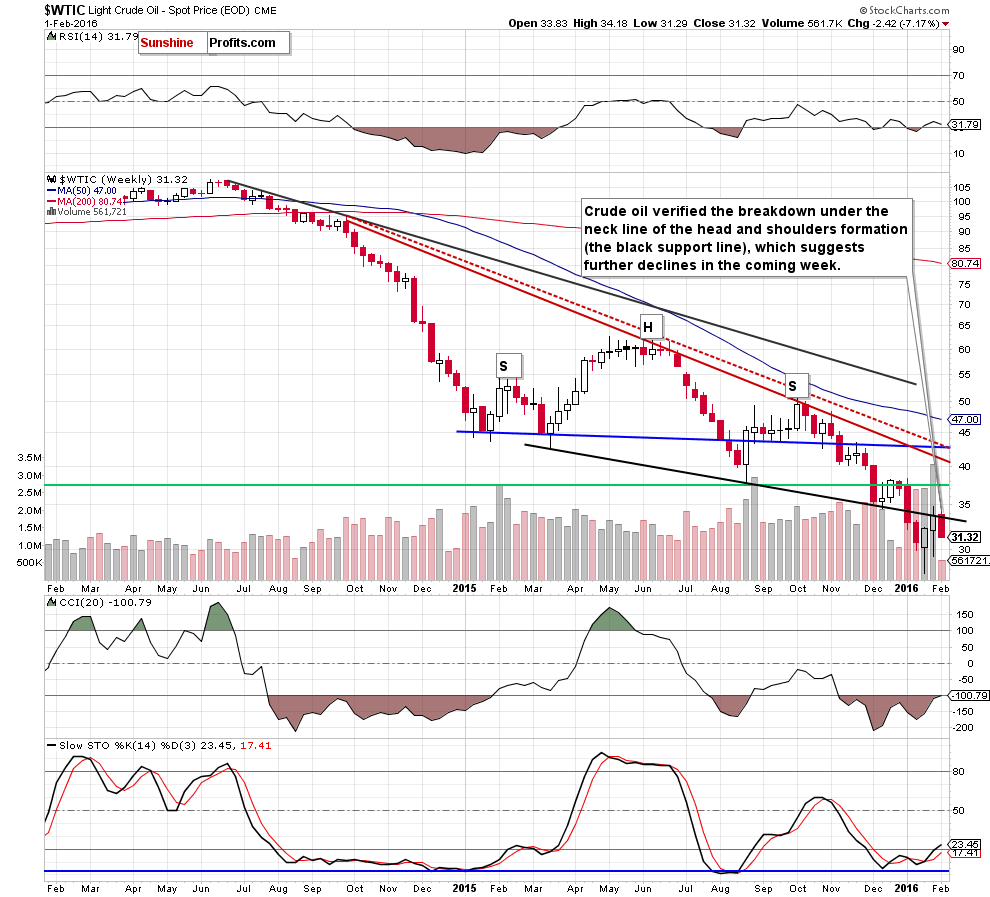
(…) although oil bulls pushed light crude higher (as we had expected), crude oil gave up some gains and slipped under the neck line of the head and shoulders formation. With this move, the commodity verified the breakdown under this important resistance line, which is another negative signal that increases the probability of reversal.
Looking at the weekly chart, we see that crude oil closed the previous week under the neck line of the head and shoulders formation, which was a negative signal. Nevertheless, the commodity climbed above this important resistance line once again on Monday. Despite this encouraging event, oil bulls didn’t manage to hold gained levels, which resulted in a comeback under the black support/resistance line. As you see, this drop triggered a sharp decline, which took the commodity under $33.
What impact did this decline have on the very short-term picture? Let’s examine the daily chart and find out.
On Friday, we wrote the following:
(…) crude oil climbed not only to the Fibonacci retracement, but also reached our next upside target, hitting an intraday high of $34.82. Despite this improvement, oil bulls didn’t manage to hold gained levels, which resulted in a pullback. In our opinion, such price action looks like a verification of the breakdown below the mid-Dec low, which is a negative signal that suggests further deterioration. When we take a closer look at the daily chart, we notice that yesterday’s drop invalidated earlier breakout above the 61.8% Fibonacci retracement, which suggests that oil bears will probably use this fact to push the price lower. Additionally, when we compare the size of both upswings (increase from the Jan 20 low to Jan 25 high and the move from the Jan 26 low to yesterday’s high), we see that they are quite similar, which in combination with the black resistance line (based on the Nov and Jan highs), which serves as the key short-term resistance increases the probability of the reversal in the coming day.
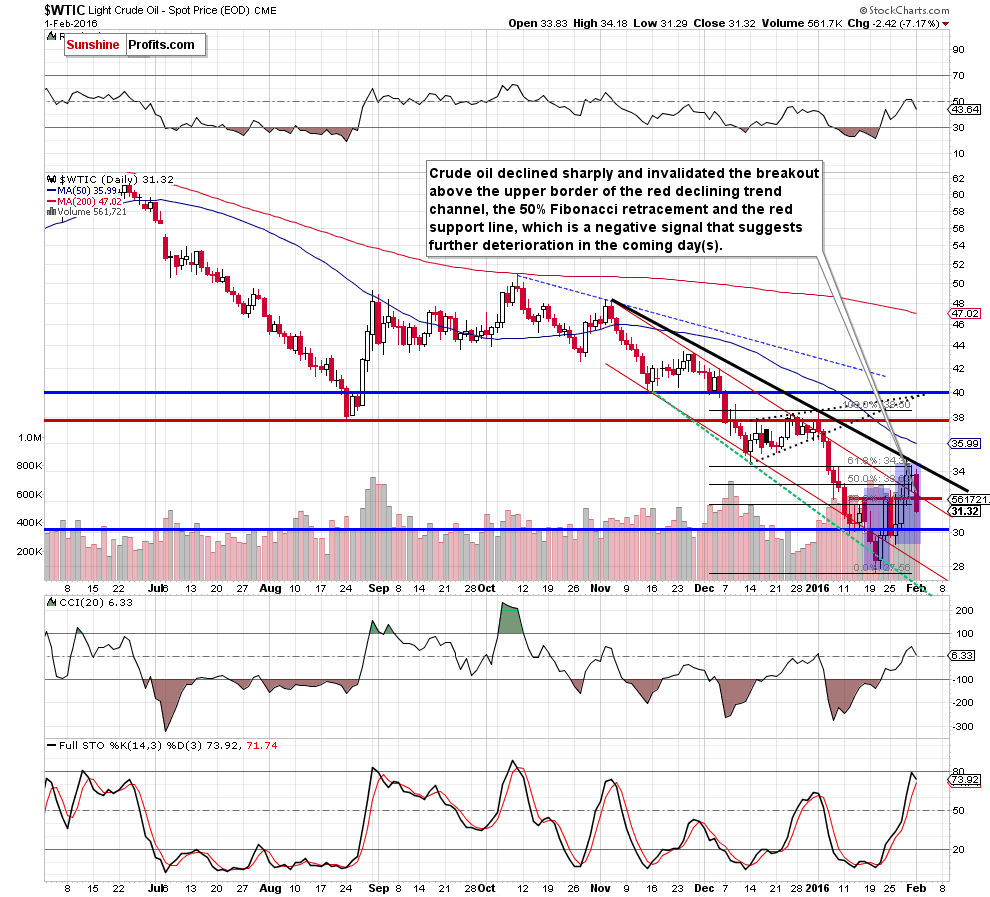
As you see on the daily chart, the situation developed in line with the above scenario and crude oil declined sharply on Monday. With this downward move, light crude invalidated earlier breakout above the 38.2% and 50% Fibonacci retracement levels, the upper border of the red declining trend channel and the red support line, which is a bearish signal that suggests further deterioration in the coming days. Additionally, the current position of the indicators (the CCI reversed, while the Stochastic Oscillator is very close to generating a sell signal) favors oil bears.
How low could the commodity go in the coming days? In our opinion, the initial downside target would be the barrier of $30. If t is broken, light crude will drop to the Jan 26 low of $29.25 or even to the 2016 low of $27.56. At this point, it is worth noting that this support level is currently intersected by the lower border of the red declining trend channel, which would be the next downside target in case of a drop to a new 2016 low.
Summing up, crude oil reversed and declined sharply, invalidating earlier breakout above the Fibonacci retracements and the upper border of the declining trend channel. With this drop, the commodity also verified the breakdown under the neck line of the head and shoulders formation (marked on the weekly chart), which suggests further deterioration in the coming days. Therefore, we believe that short positions (with a stop-loss order at $35.63 and a price target at $25.63) are justified from the risk/reward perspective.
Very short-term outlook: bearish
Short-term outlook: bearish
MT outlook: bearish
LT outlook: mixed with bearish bias
Trading position (short-term; our opinion): Short positions (with a stop-loss order at $35.63 and the price target at $25.63) are justified from the risk/reward perspective. The analogous levels for USO ETF and DWTI ETN are:
- USO initial target price: $6.67; USO stop-loss: $10.25
- DWTI initial target price: $513.31; DWTI stop-loss: $165.84
We will keep you – our subscribers – informed should anything change.
As a reminder – “initial target price” means exactly that – an “initial” one, it’s not a price level at which we suggest closing positions. If this becomes the case (like it did in the previous trade) we will refer to these levels as levels of exit orders (exactly as we’ve done previously). Stop-loss levels, however, are naturally not “initial”, but something that, in our opinion, might be entered as an order.
Since it is impossible to synchronize target prices and stop-loss levels for all the ETFs and ETNs with the main market that we provide this level for (crude oil), the stop-loss level and target price for popular ETN and ETF (among other: USO, DWTI, UWTI) are provided as supplementary, and not as “final”. This means that if a stop-loss or a target level is reached for any of the “additional instruments” (DWTI for instance), but not for the “main instrument” (crude oil in this case), we will view positions in both crude oil and DWTI as still open and the stop-loss for DWTI would have to be moved lower. On the other hand, if crude oil moves to a stop-loss level but DWTI doesn’t, then we will view both positions (in crude oil and DWTI) as closed. In other words, since it’s not possible to be 100% certain that each related instrument moves to a given level when the underlying instrument does, we can’t provide levels that would be binding. The levels that we do provide are our best estimate of the levels that will correspond to the levels in the underlying assets, but it will be the underlying assets that one will need to focus on regarding the sings pointing to closing a given position or keeping it open. We might adjust the levels in the “additional instruments” without adjusting the levels in the “main instruments”, which will simply mean that we have improved our estimation of these levels, not that we changed our outlook on the markets.
Thank you.
Nadia Simmons
Forex & Oil Trading Strategist
Przemyslaw Radomski, CFA
Founder, Editor-in-chief
Gold & Silver Trading Alerts
Forex Trading Alerts
Oil Investment Updates
Oil Trading Alerts

