

Trading position (short-term; our opinion): Short positions (with a stop-loss order at $33.23 and the price target at $25.63) are justified from the risk/reward perspective.
On Tuesday, crude oil lost 4.07% as a bearish report released by International Energy Agency weighed on investors’ sentiment. As a result, light crude dropped below the lower border of the consolidation and closed the day under the barrier of $30 for the first time since Nov 2003. How low could the commodity go in the coming days?
Let’s examine charts and find out what can we infer about future moves (charts courtesy of http://stockcharts.com).
On Monday, we wrote the following:
(…) as long as there is no breakout above the upper border of the formation (or a breakdown under $30) another bigger move is not likely to be seen and short-lived moves in both directions should not surprise us.
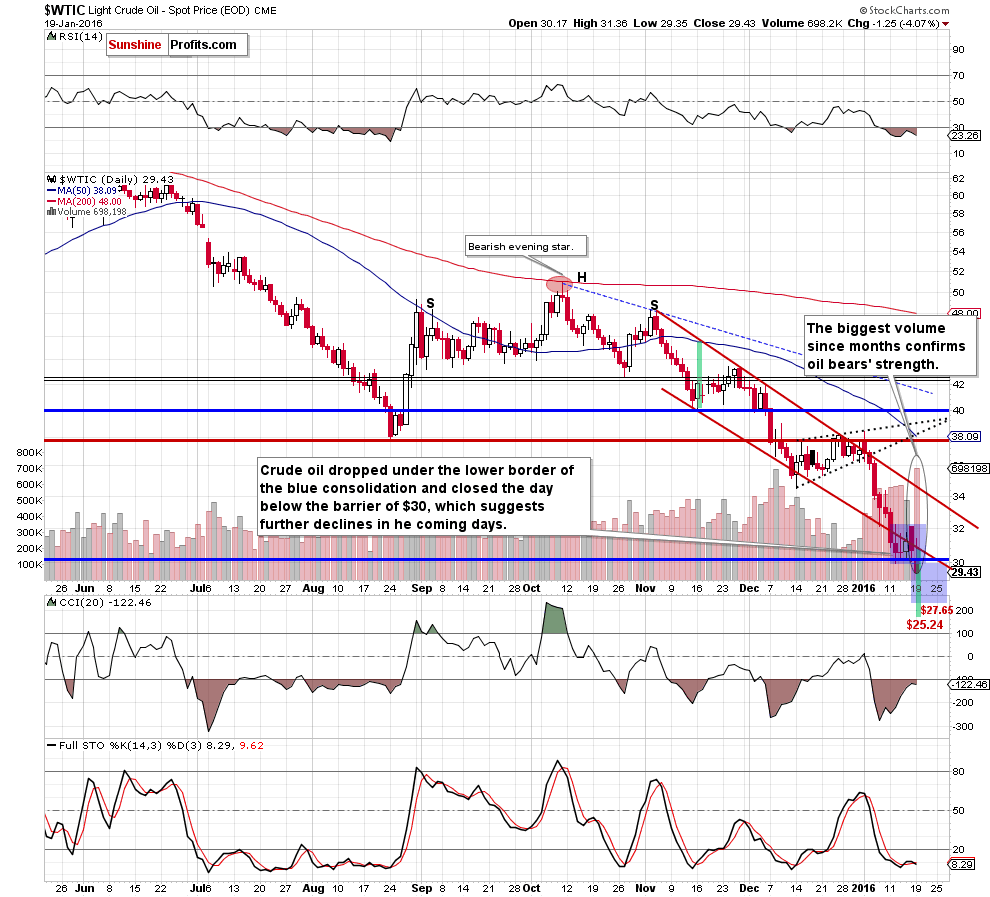
Looking at the daily chart, we see that although crude oil moved higher after the market’s open oil bears didn’t manage to hold gained levels, which resulted in a sharp decline. With this downward move, the commodity not only declined below the lower border of the red declining trend channel, but also dropped below the lower border of the blue consolidation. As a result, light crude slipped under the barrier of $30 and closed the day below it, which is a strong bearish signal that suggests further deterioration. At this point, it is also worth noting that the size of the volume that accompanied yesterday’s decline was huge (the biggest increase since months!), which confirms oil bears’ strength and the direction of the trend.
How low could the commodity go in the coming days? Taking into account the breakdown under the lower border of the consolidation, the initial downside target would be around $27.65. However, when we consider a breakdown under the lower border of the red declining trend channel, we may see a decline even to $25.24, where the size of the downward move will correspond to the height of the formation. In this area is also our downside target forecasted in Oil Trading Alert posted on Sept 4:
(…) it seems quite likely that crude oil will slide all the way down to more or less $25 dollars and there are multiple reasons for it:
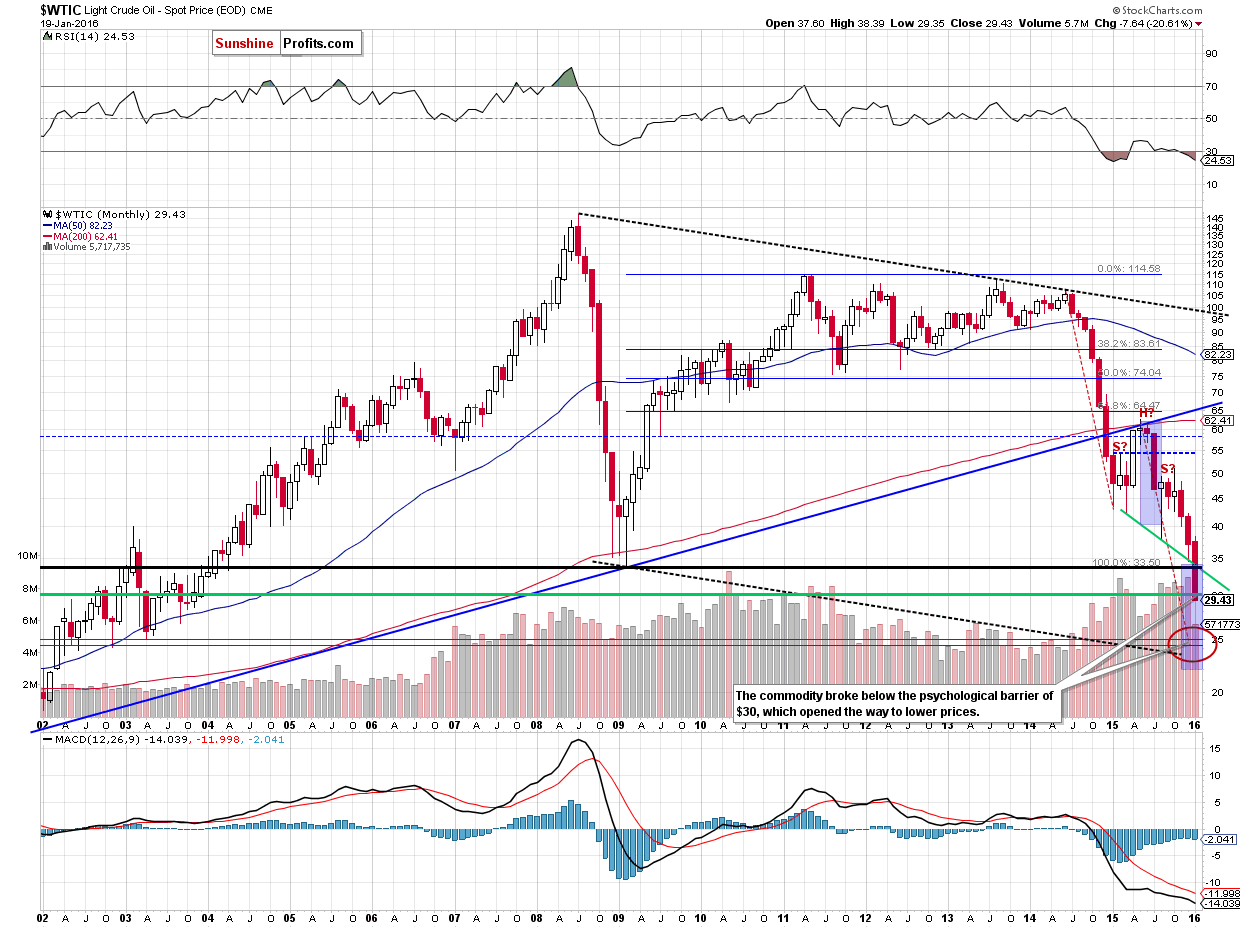
- The breakdown below the key long-term rising support line (marked with blue) was confirmed and verified – this year’s rally didn’t take crude oil back above it – the line proved to be strong resistance. This by itself doesn’t imply a target level at a certain point, but it strongly suggests that crude oil has to fall much lower, before the decline is over.
- The symmetry of major declines: the 2008 slide is the only decline that is really similar to the current one, and in order for this similarity to be upheld (history repeats itself to a considerable extent), crude oil would have to move even a bit below $25. On the above chart you can see that in the form of the declining dashed black lines.
- The symmetry between the 2014 slide and the (likely) current decline. This year we have definitely seen some kind of consolidation (which might still turn out to be a bottom, but that is unlikely in our view) and the move that follows a consolidation is very often similar to the one that preceded it. If you look at the red dashed declining lines on the above chart you’ll notice that for the previous decline to repeat, crude oil would have to move to about $25.
- Speaking of the consolidation, it’s taking the form of a head-and-shoulders pattern and once / if the pattern is completed, we will have a pattern-based target at around $25. The reason is that once price breaks below the “neck level”, it’s likely to decline as much as the size of the “head” in the pattern.
- The late-2002 and 2003 bottoms create strong support at those levels.
The amount of signals that points to $25 as the most likely target is uncanny, which makes it quite reliable.
Yes, there also are the 2008 and 2009 lows, but generally not much (if anything) confirms them as a major target, so they might not be able to generate anything more than a short-lived bounce (if anything at all).
Summing up, the most important event of yesterday’s session was a daily closure under the barrier of $30 and a breakdown under the lower border of the blue consolidation, which together suggests further declines and a drop even to $25. Therefore, in our opinion, re-opening short positions with a stop-loss order at $33.23 and the price target at $25.63 is justified from the risk/reward perspective.
Very short-term outlook: bearish
Short-term outlook: bearish
MT outlook: bearish
LT outlook: mixed with bearish bias
Trading position (short-term; our opinion): Short positions (with a stop-loss order at $33.23 and the price target at $25.63) are justified from the risk/reward perspective. We will keep you – our subscribers – informed should anything change.
Thank you.
Nadia Simmons
Forex & Oil Trading Strategist
Przemyslaw Radomski, CFA
Founder, Editor-in-chief
Gold & Silver Trading Alerts
Forex Trading Alerts
Oil Investment Updates
Oil Trading Alerts

