

Trading position (short-term; our opinion): Short positions with a stop-loss order at $54.12 and initial (!) target price at $35.72 are justified from the risk/reward perspective.
On Thursday, crude oil lost 2.31% as a strong greenback and ongoing worries over glut in global supplies continued to weigh on the commodity. In this environment, light crude dropped under the 50-day moving average, invalidating earlier breakout. Are there any other technical factors that could encourage oil bears to act?
Yesterday, crude oil extended losses and closed the day below $46 as Wednesday’s EIA report, which showed that inventories gained for a sixth straight week continued to weigh on investors’ sentiment. As a result, light crude dropped under the 50-day moving average, invalidating earlier breakout. Where will the commodity head next? Let’s examine charts and find out(charts courtesy of http://stockcharts.com).
Yesterday, we wrote the following:
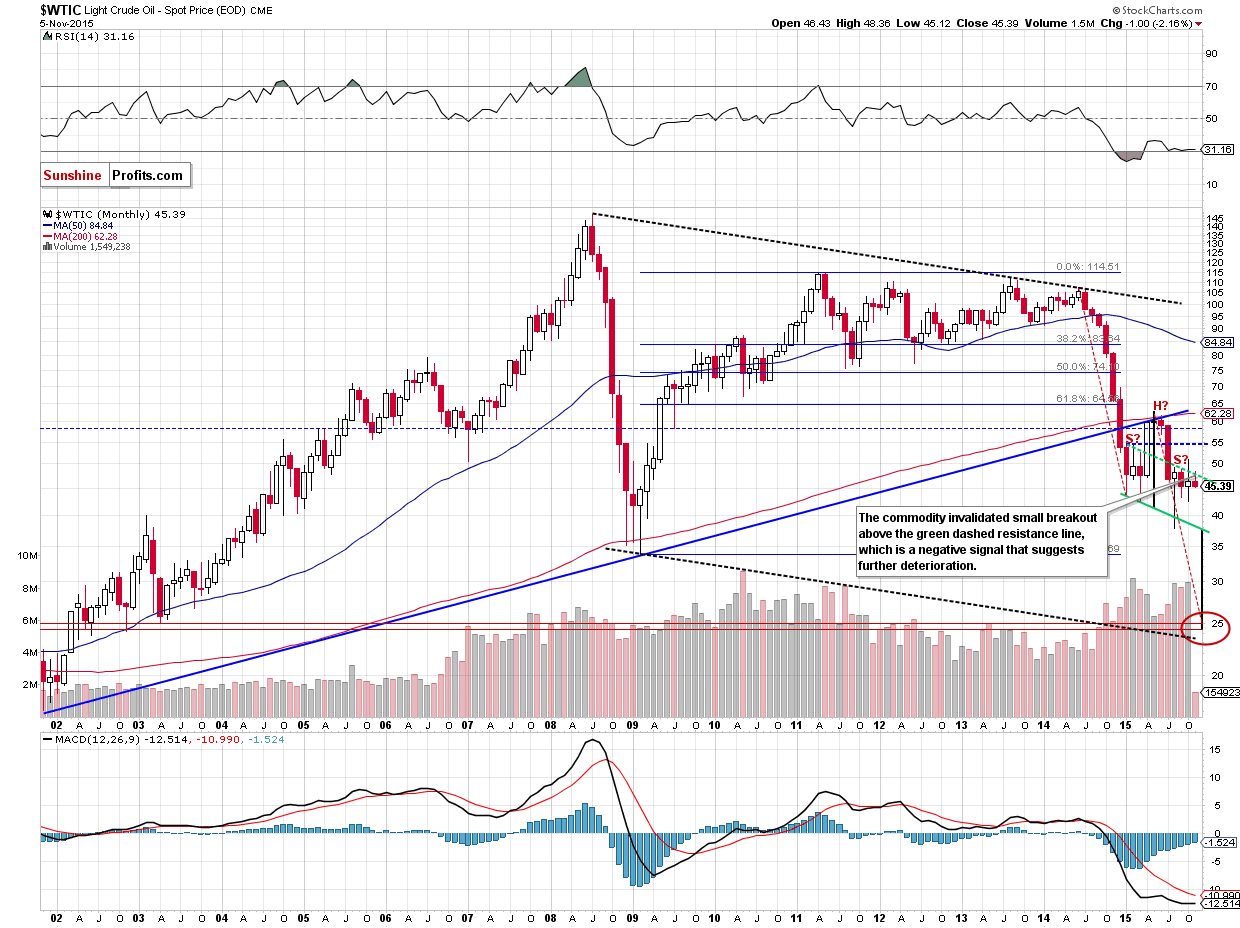
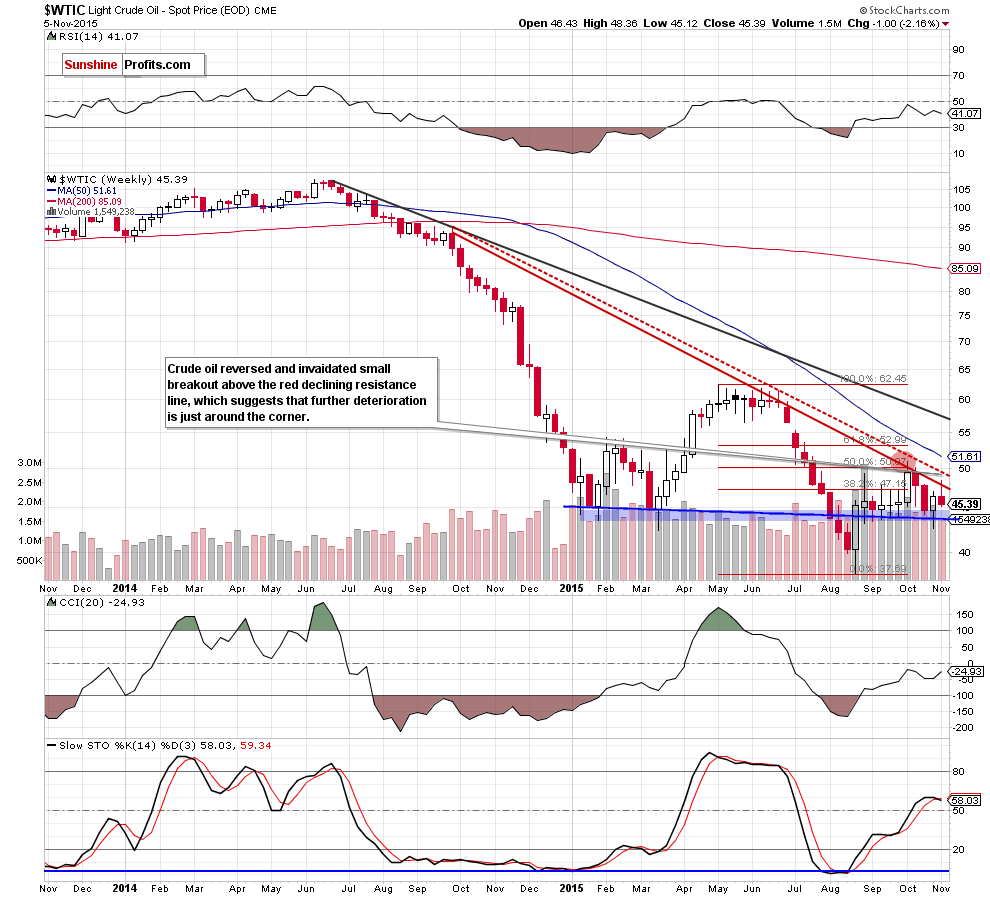
(…) the combination of the green dashed and red declining resistance lines stopped oil bulls (as we had expected) and triggered a pullback. With this downswing, light crude invalidated small breakouts above these lines (a bearish signal), which suggests further deterioration.
As you see on the charts, the situation developed in line with the above scenario and crude oil extended losses below major resistance lines.
What impact did this drop have on the very short-term picture? Let’s check.
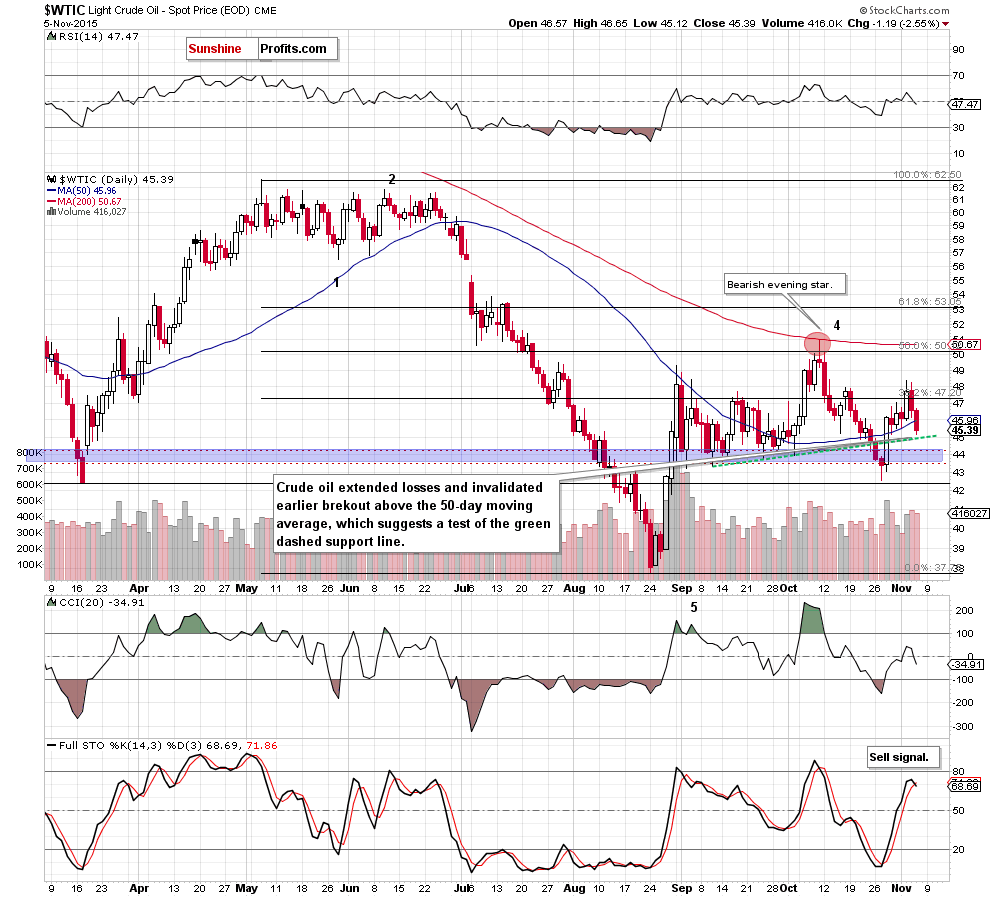
Looking at the daily chart we see that recent downward move invalidated earlier breakout above the 38.2% Fibonacci retracement, which triggered further decline and resulted in a drop below the 50-day moving average (a negative signal). Additionally, the Stochastic Oscillator generated a sell signal, which gives oil bears another reason to act.
Taking all the above into account, we believe that the commodity will test the green support line in the coming day(s). If it is broken, the next downside target would be the blue support line (currently around $43.81). If this key support is broken, we’ll likely see an acceleration of declines and a drop to (at least) $40.57-$40.86, where the next support area (created by the 76.4% and 78.6% Fibonacci retracement levels) is. Nevertheless, the bearish scenario will be more likely if we see another weekly close below the above-mentioned key resistance lines.
Summing up, crude oil extended losses and invalidated earlier breakout above the 50-day moving average. This is a bearish signal, which suggests that further deterioration in the coming day(s) is more likely than not and short positions continue to be justified from the risk/reward point of view.
Very short-term outlook: bearish
Short-term outlook: bearish
MT outlook: bearish
LT outlook: mixed with bearish bias
Trading position (short-term; our opinion): Short positions with a stop-loss order at $54.12 and initial (!) target price at $35.72 are justified from the risk/reward perspective. We will keep you – our subscribers – informed should anything change.
Thank you.
Nadia Simmons
Forex & Oil Trading Strategist
Przemyslaw Radomski, CFA
Founder, Editor-in-chief
Gold & Silver Trading Alerts
Forex Trading Alerts
Oil Investment Updates
Oil Trading Alerts

