

Trading position (short-term; our opinion): Short positions with a stop-loss order at $65.23 are justified from the risk/reward perspective.
On Wednesday, crude oil lost 3.76% after unexpected build in crude oil inventories. As a result, light crude slipped under $57, breaking below important medium- and short-term supports. What does it mean for the commodity?
Yesterday, the U.S. Energy Information Administration reported that U.S. crude inventories rose by 2.4 million barrels, missing expectations for a draw of 2 million barrels. At this point, it is worth noting that U.S. crude stockpiles are now at 465.4 million barrels, which is quite close to its highest level at this time of year in at least 80 years. Yesterday’s increase halted an eight week streak of weekly declines, renewing worries over a supply glut and pushing the price of the commodity below $57. What impact did these circumstances have on the technical picture of the commodity? (charts courtesy of http://stockcharts.com).
On Monday, we wrote the following:
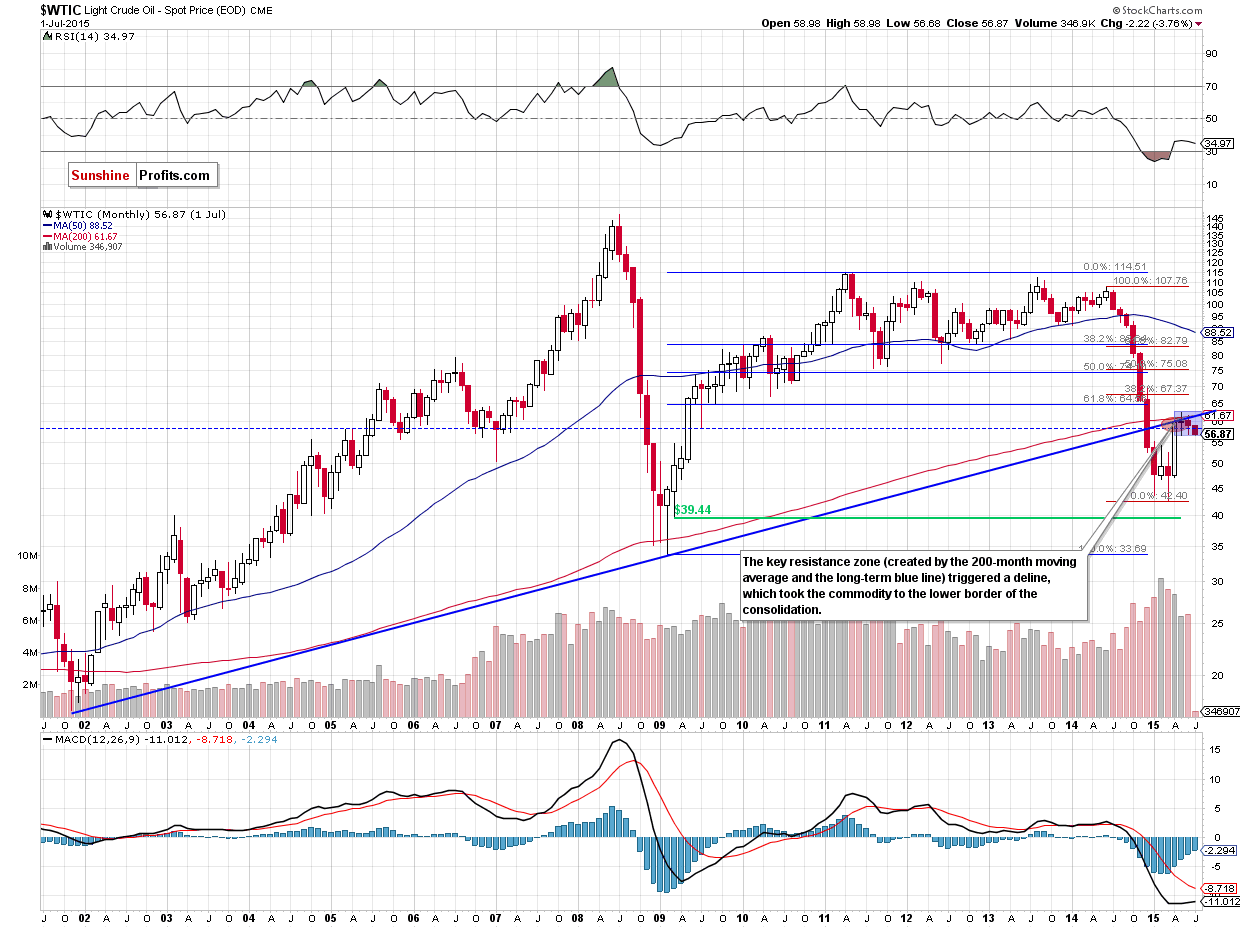
(...) this year’s rally is simply a sizable correction of the previous massive decline. Taking into account the fact that there was no major breakout and the trend remains down, it seems that the short-term outlook would deteriorate, as crude oil didn’t move above the long-term rising resistance line and the 200-month moving average.
Looking at the above chart, we see that oil bears pushed the commodity lower as we had expected. With yesterday’s downswing, crude oil approached the lower border of the blue consolidation, which means that a breakdown below $56.51 will likely trigger further deterioration and a drop to (at least) around $50.45, where the size of the downward move will correspond to the height of the formation.
How yesterday’s move affect the medium-term picture? Let’s examine the weekly chart and find out.
Quoting our Tuesday’s Oil Trading Alert:
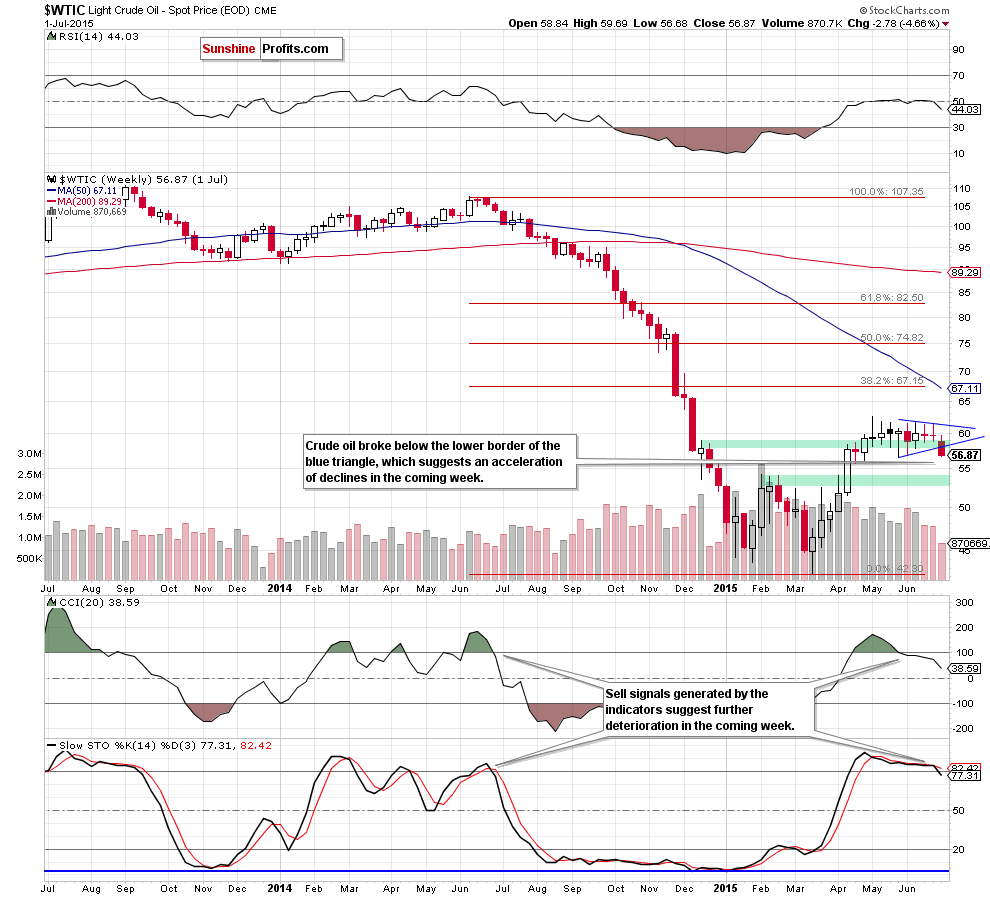
(...) crude oil is trading in a blue triangle around the green support zone (created by the Dec 15 and Dec 22 highs). (...) Nevertheless, taking into account the current position of the weekly indicators (sell signals remain in place, supporting oil bears), we think that further deterioration is just around the corner. In our opinion, declines will accelerate if crude oil drops below the lower line of the triangle (currently around $58). In this case, the initial downside target for oil bears would be around $52.34-$54.24, where the green support zone (created by the Feb highs) is.
From today’s point of view we see that the situation developed in line with the above scenario as crude oil dropped below its major medium-term support. This is a bearish signal, which suggests that our downside target from Tuesday will be in play in the coming week.
What impact did this drop have on the very short-term picture? Let’s check.
In our yesterday’s commentary, we wrote the following:
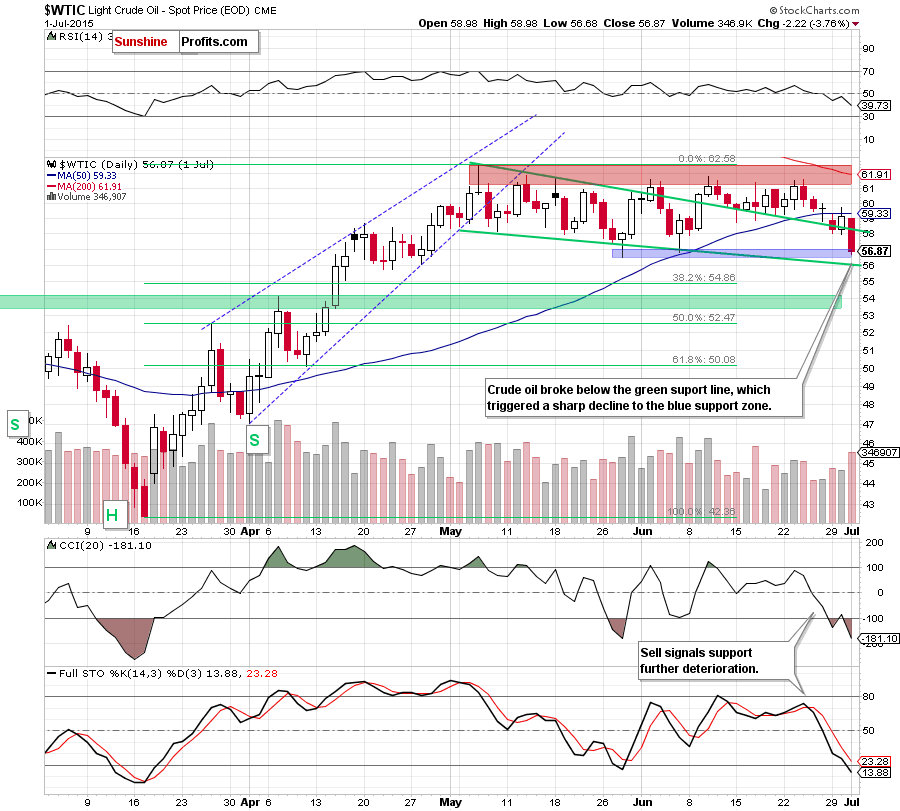
(…) crude oil closed another day under the previously-broken 50-day moving average (which serves as important resistance). This suggests that yesterday’s upswing was nothing more than a verification of the breakdown. If this is the case, and light crude moves lower from here once again, it would be a bearish signal, which will trigger further deterioration. What will be the initial downside target? (…) the previous lows ($56.50-$57.60) or even the green support line (around $56).
(…) this scenario is also reinforced by the current position of daily indicators (sell signals remain in place) and the size of volume that accompanied yesterday’s move (it was smaller than the day before when crude oil declined, which suggests that oil bulls may not be as strong as it seems).
As you see on the daily chart, yesterday’s drop below the green support line triggered a sharp decline, which took the commodity to our initial downside target – the blue support zone based on the previous lows.
Although light crude rebounded from here and climbed to almost $58 earlier today, we believe that this move is just a verification of yesterday’s breakdown under the green support line and the lower border of the medium-term triangle. Why? When we take a closer look at the daily chart, we notice that yesterday’s decline materialized on sizable volume, which means that oil bears are getting stronger. On top of that, sell signals generated by the weekly and daily indicators remain in place, supporting further deterioration in the coming days.
Summing up, the most important event of yesterday’s session was the breakdown not only below the green support line (marked n the daily chart), but also under the lower border of the blue triangle, which served as major medium-term support. These events make the outlook even more bearish and suggest acceleration of declines in the coming day(s).
Very short-term outlook: bearish
Short-term outlook: bearish
MT outlook: mixed with bearish bias
LT outlook: mixed with bearish bias
Trading position (short-term; our opinion): Short positions with a stop-loss order at $65.23 are justified from the risk/reward perspective. We will keep you – our subscribers – informed should anything change.
Thank you.
Nadia Simmons
Forex & Oil Trading Strategist
Przemyslaw Radomski, CFA
Founder, Editor-in-chief
Gold & Silver Trading Alerts
Forex Trading Alerts
Oil Investment Updates
Oil Trading Alerts

