

Trading position (short-term; our opinion): Short positions with a stop-loss order at $65.23 are justified from the risk/reward perspective.
On Tuesday, crude oil gained 0.72% ahead of API supply data. Additionally, concerns related to Tropical Storm Bill supported the price of the commodity, which resulted in a daily close above $60. Will we see another test of the major resistance zone later in the day?
On Friday, the Baker Hughes reported that U.S. oil rigs dropped by 7 in the previous week to lowest level since August 2010.This report, in combination with the fact that U.S. stockpiles typically fall at this time of year (as refinery capacity increases ahead of the summer driving season) supported the price of light crude, fueling hopes that the API and EIA reports would show another decline in domestic crude oil inventories. Thanks to these circumstances, the commodity climbed above $60. What impact did this move have on the very short-term picture? (charts courtesy of http://stockcharts.com).
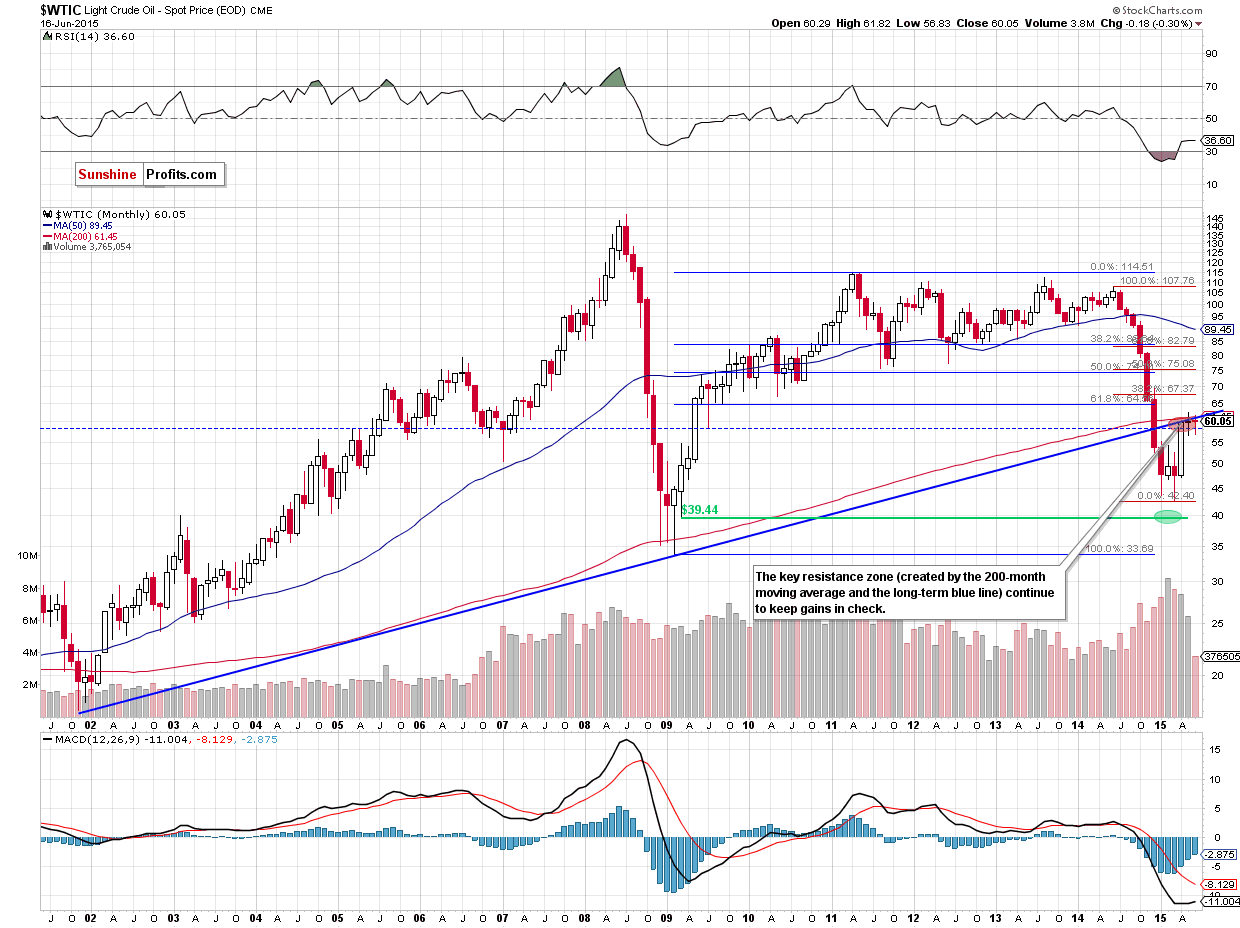
Although crude oil climbed above $60, the long-term picture hasn’t changed much as the key resistance zone (created by the long-term blue resistance line and the 200-month moving average) continues to keep gains in check. Taking this fact into account, we believe that as long as there is no successful breakout above this area further improvement is not likely to be seen and another attempt to move lower should not surprise us.
Will the very short-term picture give us more clues about future moves? Let’s check.
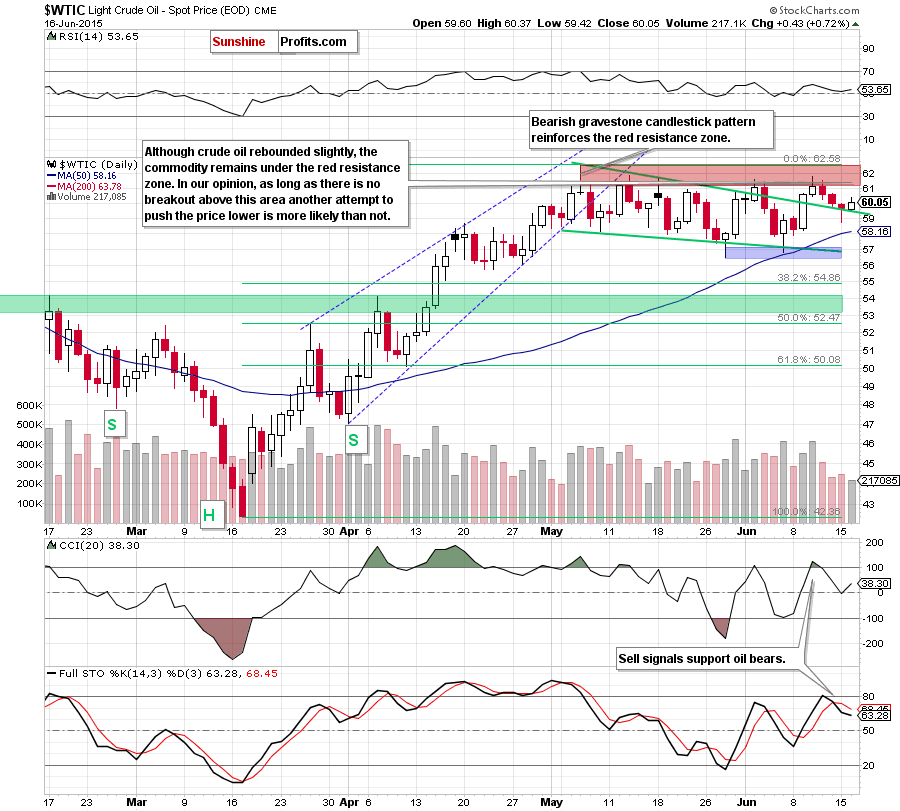
From today’s point of view, we see that although crude oil rebounded slightly, the commodity remains under the red resistance zone. Therefore, what we wrote in our previous Oil Trading Alert is up-to-date:
(…) Although light crude could rebound from here (and re-test the red resistance zone once again), we think that the proximity to the key resistance zone in combination with the current position of the indicators (the CCI and Stochastic Oscillator generated sell signals) will trigger further deterioration in the coming days.
(…) if the green support line is successfully broken (and we’ll see a daily lose below it), the next downside target for oil bears would be the 50-day moving average (…) or even the blue support zone ($56.50-$57.60).
Summing up, crude oil bounced off the green support line (the upper border of the declining wedge), which could trigger further improvement and another test of the red resistance zone. Nevertheless, we believe that as long as this resistance area (reinforced by the 200-month moving average and the long-term blue line) keeps gains in check further rally is not likely to be seen and another downswing should not surprise us.
Very short-term outlook: bearish
Short-term outlook: bearish
MT outlook: mixed with bearish bias
LT outlook: mixed with bearish bias
Trading position (short-term; our opinion): Short positions with a stop-loss order at $65.23 are justified from the risk/reward perspective. We will keep you – our subscribers – informed should anything change.
Thank you.
Nadia Simmons
Forex & Oil Trading Strategist
Przemyslaw Radomski, CFA
Founder, Editor-in-chief
Gold & Silver Trading Alerts
Forex Trading Alerts
Oil Investment Updates
Oil Trading Alerts

