

Trading position (short-term; our opinion): Short positions with a stop-loss order at $65.23 are justified from the risk/reward perspective.
On Friday, crude oil lost 1.01% as a stronger greenback and the Baker Hughes report weighed on investors’ sentiment. In this way, light crude closed the day under $60 for the first time since Monday and reached the short-term support line. Will it withstand the selling pressure in the coming days?
On Friday, the University of Michigan in the preliminary report showed that its consumer sentiment index increased to 94.6 in June, beating expectations for an increase to 91.5.This solid data in combination with Thursday’s bullish retail sales and core retail sales numbers supported the greenback, making crude oil less attractive for buyers holding other currencies.
Later in the day, the Baker Hughes report showed that U.S. oil rigs dropped by 7 in the previous week. Although it was the 27th consecutive week of declines (and its lowest level since August), the pace of decline has slowed significantly over the last several weeks, renewing worries over the supply glut. In these circumstances, light crude extended losses and closed the day under $60, reaching the short-term support line. What’s next? (charts courtesy of http://stockcharts.com).
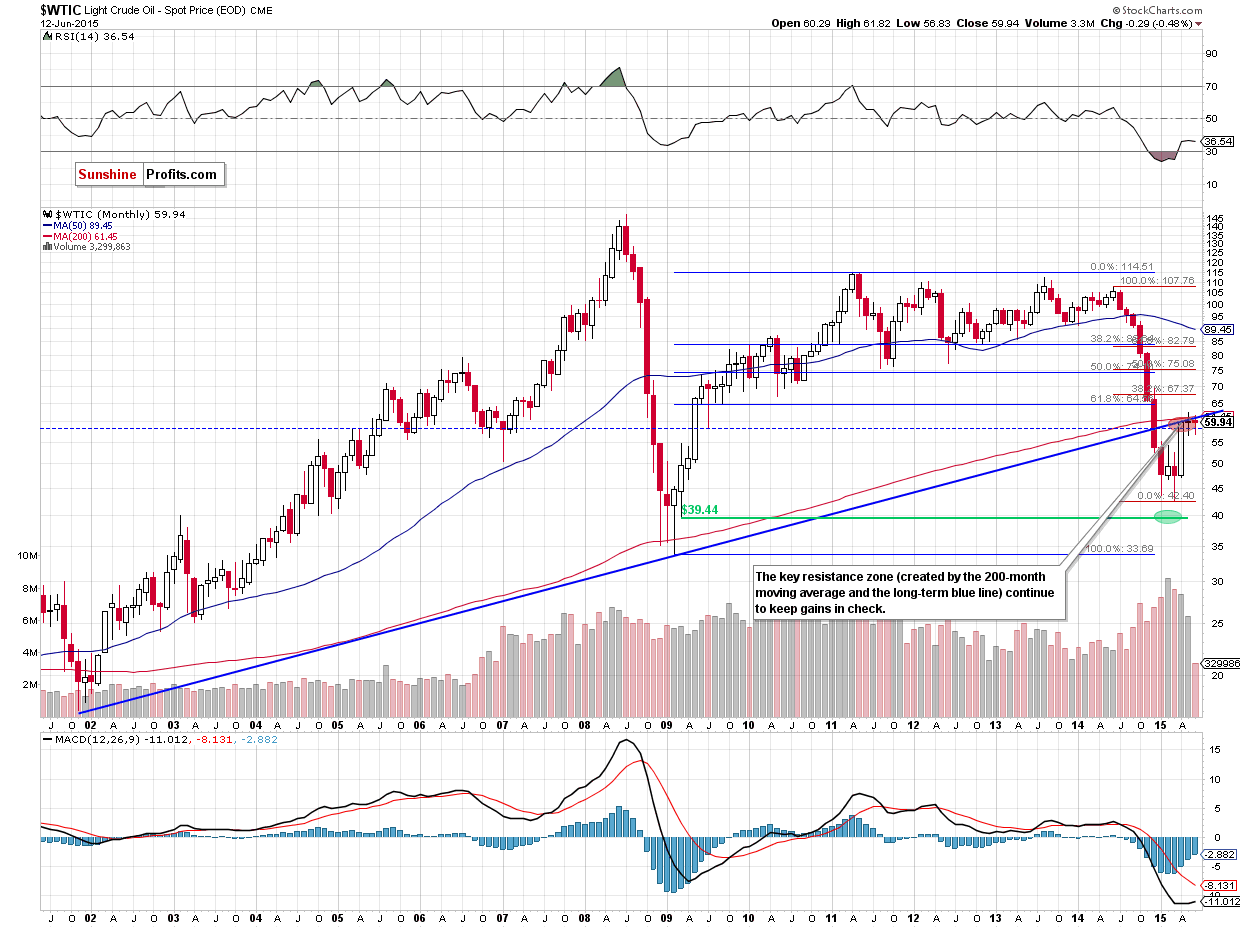
From the long-term perspective, the key resistance zone (created by the long-term blue resistance line and the 200-month moving average) continues to keep gains in check, which encouraged oil bears to act and resulted in another downswing.
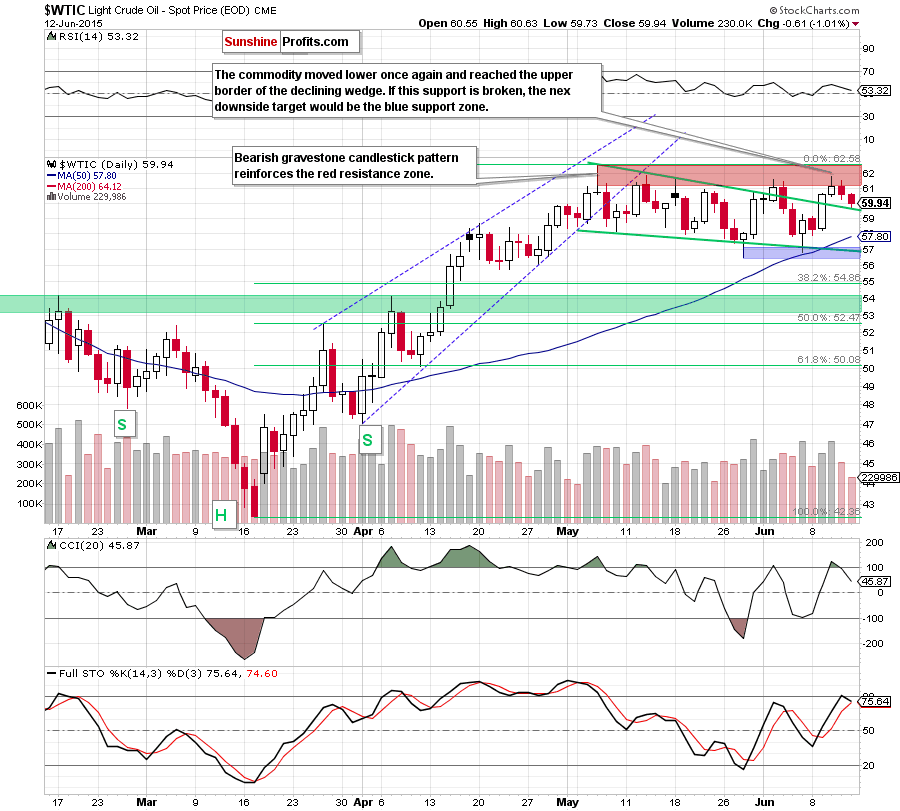
What impact did this move have on the very short-term picture? Let’s examine the daily chart and find out.
On Friday, we wrote the following:
(…) the red resistance zone encouraged oil bears to act, which resulted in a pullback in the following hours. Taking into account another unsuccessful attempt to break above this area, we believe that lower values of the commodity are just around the corner. If this is the case, and light crude extends declines, we’ll see a drop to the previously-broken upper border of the declining wedge in the coming day.
As you see on the daily chart, the situation developed in line with the above scenario and light crude reached our initial downside target. Although the commodity could rebound from here and re-test the red resistance zone once again, we think that the proximity to the key resistance zone in combination with the current position of the indicators (the CCI generated a sell signal, while the Stochastic Oscillator is very close to doing the same) will trigger further deterioration in the coming week.
In our opinion, if the green support line is broken, the next downside target for oil bears would be the 50-day moving average (currently at $57.80) or even the blue support zone ($56.50-$57.60).
Before we summarize today’s Oil Trading Alert, we decided to take a closer look at the non-USD (WTIC:UDN ratio) chart of crude oil (you can find other interesting ratios that give us valuable clues about crude oil’s, oil stocks’ and even gold’s future moves in our monthly Oil investment Updates). Please note that UDN is the symbol for the PowerShares DB US Dollar Index Bearish Fund, which moves in the exact opposite direction to the USD Index. Since the USD Index is a weighted average of the dollar's exchange rates with world's most important currencies, the WTIC:UDN ratio displays the value of crude oil priced in "other currencies".
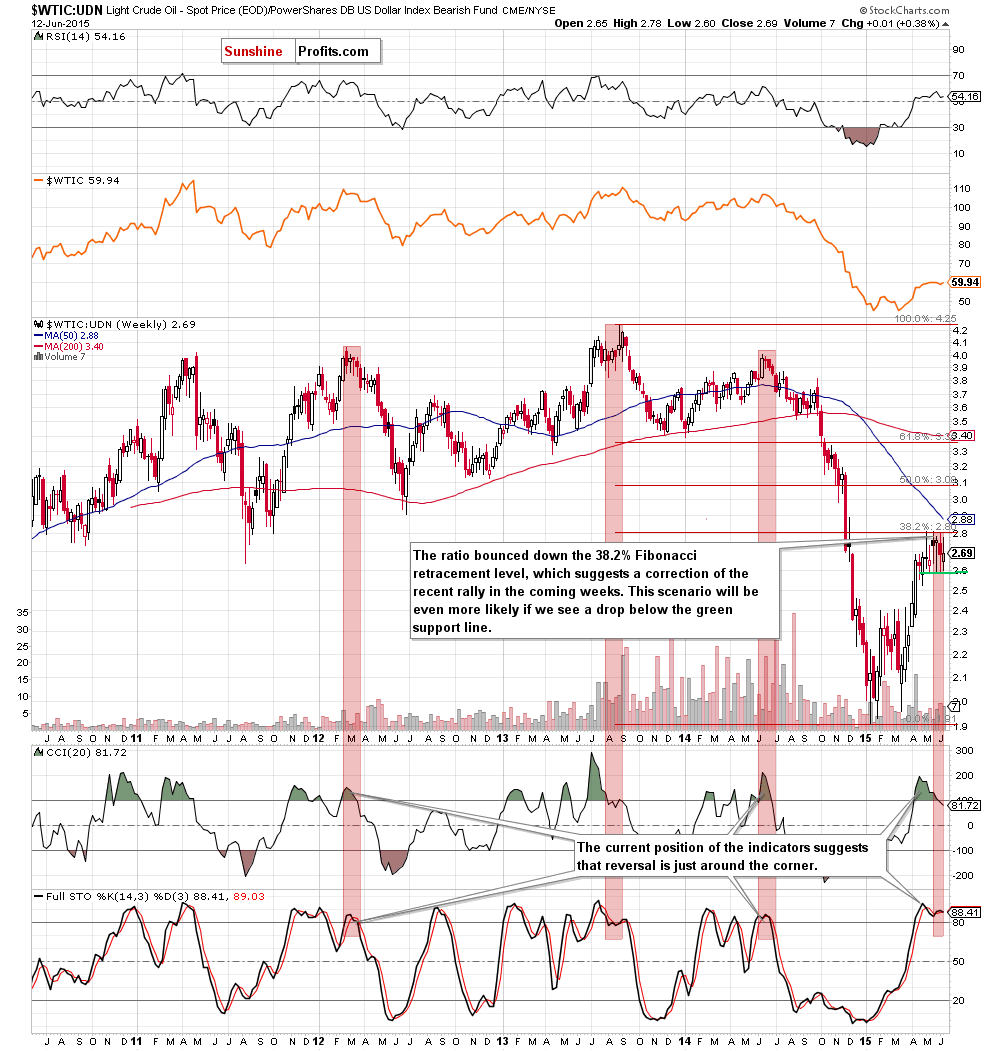
As you see on the weekly chart, although there were several attempts to break above the 38.2% Fibonacci retracement level (based on the entire Aug-Jan decline) they all failed, which resulted in a another decline to the green support line. Although this support triggered a rebound in the previous week, the current position of the indicators (the CCI and Stochastic Oscillator generated sell signals) suggests that further declines are just around the corner. At this point, it is worth noting that similar readings of these indicators have preceded declines in the past, which increases the probability of reversal especially if the ratio drops under its major support line at 2.59).
Summing up, crude oil moved lower once again and closed another day under the red resistance area (while the key resistance zone created by the 200-month moving average and the long-term blue line continues to keep gains in check), which will likely trigger further deterioration in the coming day(s) – similarly to what we saw in the previous weeks.
Very short-term outlook: bearish
Short-term outlook: bearish
MT outlook: mixed with bearish bias
LT outlook: mixed with bearish bias
Trading position (short-term; our opinion): Short positions with a stop-loss order at $65.23 are justified from the risk/reward perspective. We will keep you – our subscribers – informed should anything change.
Thank you.
Nadia Simmons
Forex & Oil Trading Strategist
Przemyslaw Radomski, CFA
Founder, Editor-in-chief
Gold & Silver Trading Alerts
Forex Trading Alerts
Oil Investment Updates
Oil Trading Alerts

