

Trading position (short-term; our opinion): No positions are justified from the risk/reward perspective.
On Wednesday, crude oil gained 4.34% as EIA weekly report and a weaker greenback supported the price. Thanks to these circumstances, light crude bounced off its support level and invalidated the breakdown under the 50-day moving average, but is this rally as bullish as it seems at the first sight?
Yesterday, the U.S. Energy Information Administration reported that domestic crude oil inventories rose by 4.8 million barrels in the week ended March 27, missing expectations for an increase of 4.2 million barrels. Although these numbers were bearish for the commodity, the increase came in below the 5.2 million barrel build reported by the American Petroleum Institute after markets closed on Tuesday.
Additionally, the Institute for Supply Management reported that its PMI index declined to a 14-month low of 51.5 in the previous month, missing analysts’ expectations for a drop to 52.5. On top of that, the ADP nonfarm payrolls report showed that the U.S. private sector added 189,000 jobs last month, also missing expectations for a growth of 225,000. Thanks to these disappointing numbers, the USD Index moved lower, making crude oil more attractive for buyers holding other currencies. In this environment, light crude shoot up to an intraday high of $50.45, but is this rally as bullish as it seems at the first sight? (charts courtesy of http://stockcharts.com).
In our previous Oil Trading Alert, we wrote the following:
(…) the combination of the previously-broken 38.2% Fibonacci retracement (…) and the 50-day moving average triggered a pullback, which erased all Monday’s gains and took the commodity to the next Fibonacci retracement. Taking this support into account, we could see a rebound from here in the coming day. Nevertheless, we should keep in mind that the space for further gains is limited as the resistance zone created by the above-mentioned levels and the red declining line is quite close (currently around $48.70-$49.70).
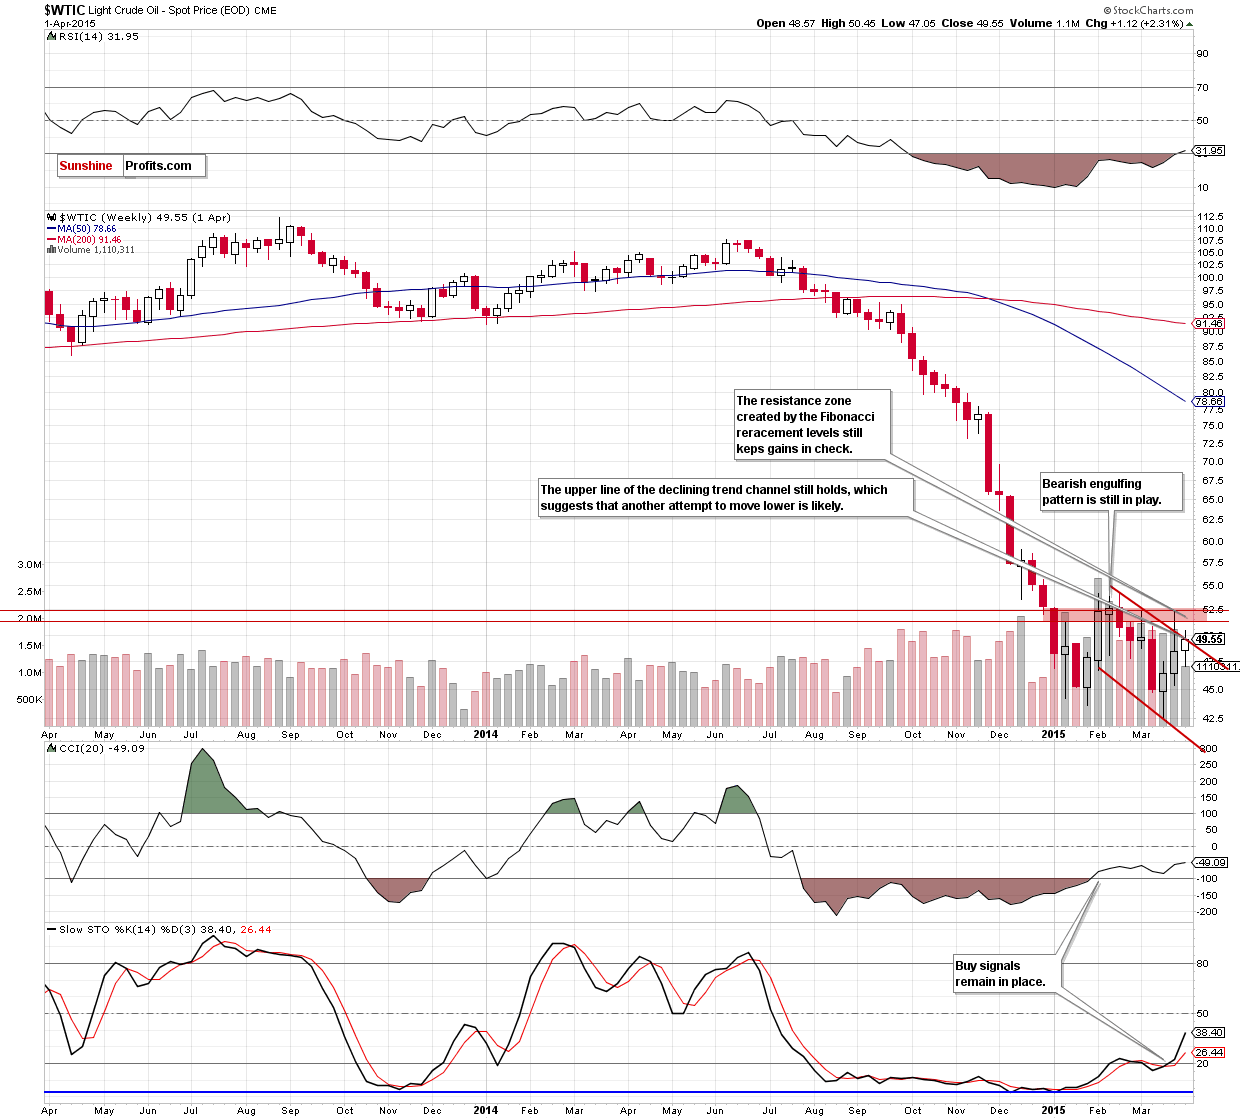
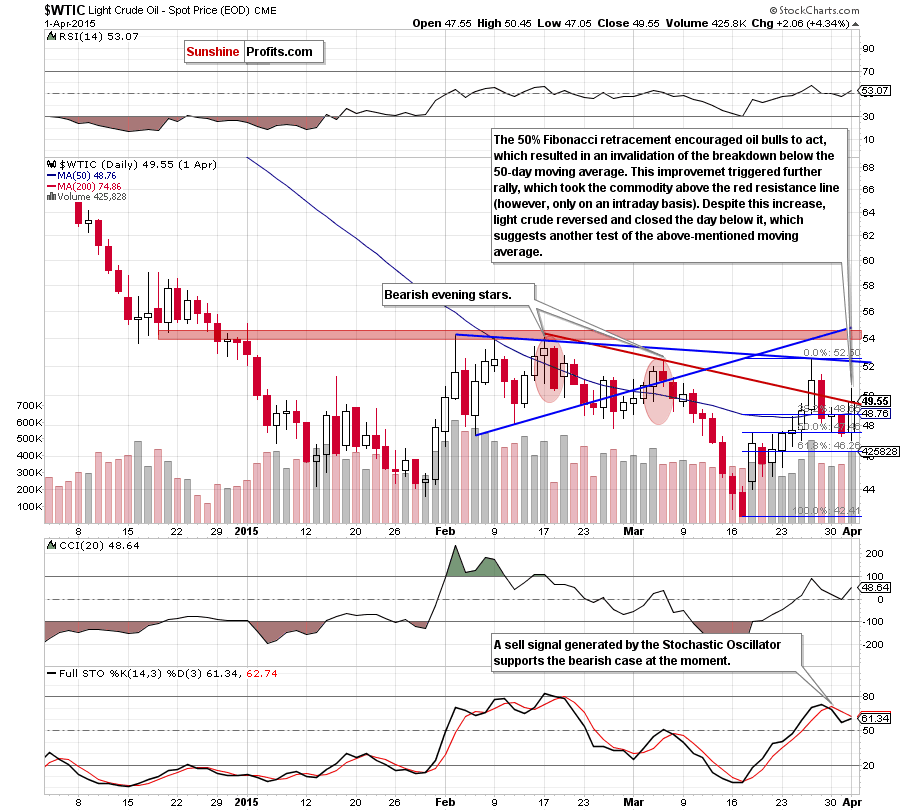
Looking at the charts, we see that oil bulls took their chance and realized the above-mentioned scenario, pushing crude oil not only to our upside target area, but also above the level of $50. Despite this improvement, the upper line of the declining trend channel (marked on the weekly chart) stopped further rally, triggering a pullback. As a result, the commodity closed the day under the medium- and short-term lines, which means that the key resistance area is still in play.
Additionally, the size of volume, which accompanied yesterday’s rally wasn’t huge (compared to what we saw on Mar 26 or at the beginning of Feb), which suggests that Wednesday’s rebound was not as bullish as it seemed at the first sight.
Therefore, we believe that our last commentary is up-to date:
(…) as long as there is no comeback above these area further improvement is not likely to be seen and another attempt to move lower is likely (please note that his scenario is currently reinforced by the medium-term picture and a sell signal generated by the Stochastic Oscillator).
Please note that the initial downside target for oil bears is the previously-broken 50-day moving average (at $48.76) and the 38.2% Fibonacci retracement. If they are broken, we might see another test of the strength of the 50% Fibonacci retracement in the coming days.
Before we summarize today’s alert please keep in mind the quote from the Monday’s alert:
When can we expect an improvement in the very short term? In our opinion, further increases will be likely only if we see an invalidation of the breakdown below the above-mentioned resistance line. Nevertheless, it seems to us that a sizable (and profitable) upward move will appear after a breakout above the Feb highs.
Summing up, although crude oil bounced off the 50% Fibonacci retracement and invalidated the breakdown under the 50-day moving average, the commodity still remains under the key resistance zone created by the upper border of the declining trend channel (marked on the weekly chart) and the red declining resistance line (seen on the daily chart). Therefore, we believe that as long as there is no comeback above this area further improvement is not likely to be seen and another attempt to move lower is likely.
Very short-term outlook: mixed with bearish bias
Short-term outlook: mixed
MT outlook: mixed
LT outlook: bullish
Trading position (short-term; our opinion): No positions are justified from the risk/reward perspective at the moment, but we will keep you informed should anything change.
Thank you.
Nadia Simmons
Forex & Oil Trading Strategist
Przemyslaw Radomski, CFA
Founder, Editor-in-chief
Gold & Silver Trading Alerts
Forex Trading Alerts
Oil Investment Updates
Oil Trading Alerts

