

Trading position (short-term; our opinion): No positions are justified from the risk/reward perspective.
Although crude oil declined below $48 weakened by supply worries related to the talks between Iran and six world powers and a stronger greenback, the commodity bounced off session lows after a U.S. State Department spokeswoman Marie Harf’s commentary. In this way, light crude gained 0.60%, but can we trust this "improvement"?
According to officials following the talks in Switzerland, Iran and six world powers have made progress in their discussions over Tehran's nuclear program. Yesterday, this news fueled concerns among oil investors that a potential deal could end Western sanctions and add Iranian oil into an already flooded market (at this point, it is worth noting that global production overtaking demand by around 1.5 million bpd.). As a result crude oil moved lower after the market’s open.
Additionally, the U.S. Commerce Department showed that personal spending increased by 0.1% in the previous month, while personal income rose 0.4% in February, beating expectations for a 0.3% gain. On top of that, the U.S. National Association of Realtors reported that pending home sales rose 3.1% last month, easily beating expectations for a 0.4% gain. Thanks to these positive numbers, the USD Index climbed above 98, supporting the greenback and making crude oil less attractive for buyers holding other currencies. In these circumstances, light crude extended losses and hit an intraday low of $47.61.
Despite this deterioration, the commodity rebounded after the U.S. State Department spokeswoman Marie Harf’s said there's a "50-50 chance" that an agreement with Iran will be reached by Tuesday. In this way, light crude bounced off session lows and gained 0.60%, but did this increase change the very short-term picture? (charts courtesy of http://stockcharts.com).
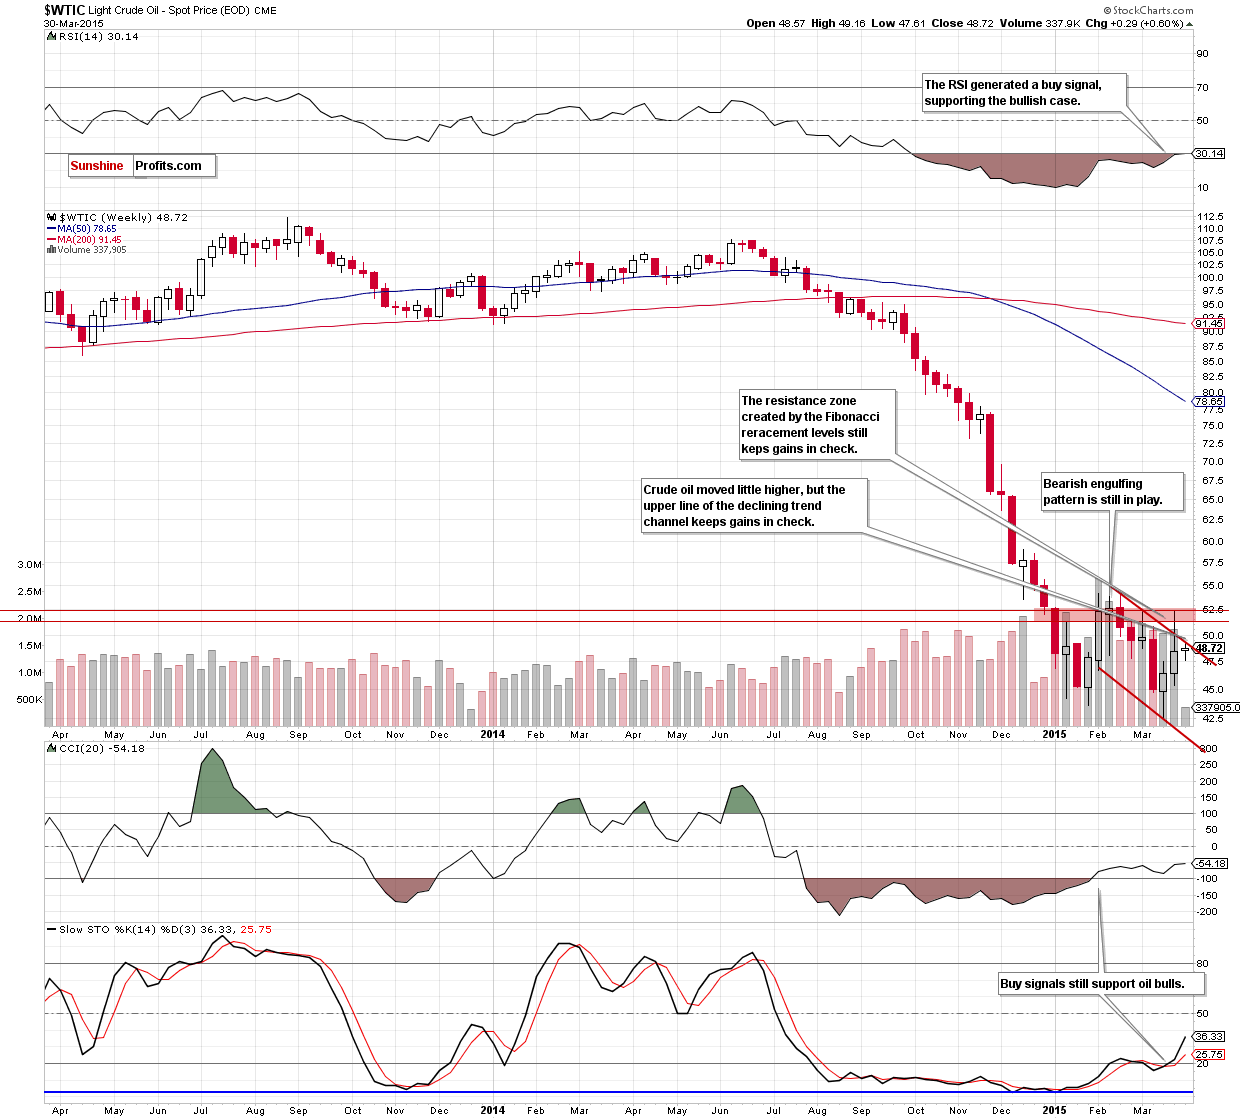
Looking at the above chart, we see that although crude oil moved little higher, the upper line of the declining trend channel stopped further improvement, which resulted in a pullback. This clearly means that as long as this resistance is in play another attempt to break above the red resistance zone created by the 76.4% and 78.6% Fibonacci retracement levels is impossible.
Having said that, let’s examine the daily chart and find out what we can infer from it.
Quoting our previous Oil Trading Alert:
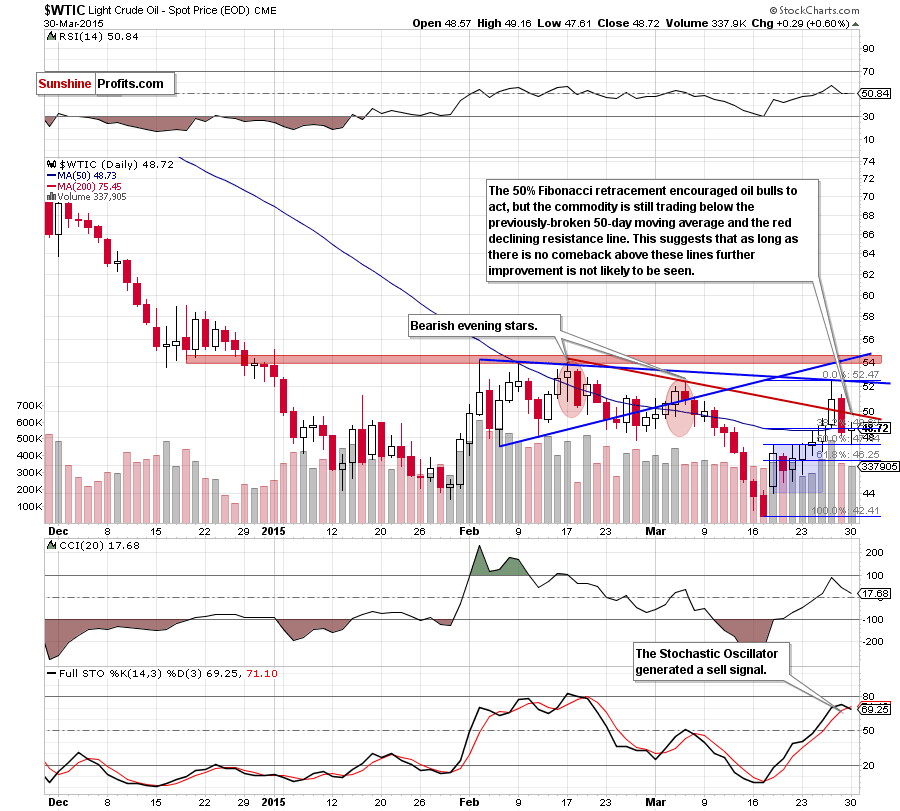
(…) crude oil invalidated the breakout above the red resistance line (based on the Feb and Mar highs) and the 50-day moving average, which is a negative signal that suggests another attempt to move lower in the coming day(s). How low could the commodity go? The initial downside target would be the 50% Fibonacci retracement level based on the entire recent rally (…)
Looking at the daily chart, we see that oil bears pushed the commodity lower as we expected and approached our downside target. However, in our last commentary, we also added:
(…) Please note that even if the proximity to the 50% Fibonacci retracement level encourages oil bulls to act, it seems that the space for gains is limited as the red resistance line (currently around $49.80) is quite close.
From today’s point of view, we see that although the above-mentioned support level triggered a rebound, oil bulls didn’t even manage to reach the red line. As a result, light crude gave up some gains and closed the day not only below this important resistance line, but also under the 50-day moving average. In our opinion, this suggests that as long as there is no comeback above these lines further improvement is not likely to be seen and another attempt to move lower is likely (please note that his scenario is currently reinforced by the medium-term picture and a sell signal generated by the Stochastic Oscillator).
If this is the case, and the commodity drops under the 50% Fibonacci retracement, the next target for oil bears would be $46.26 (the 61.8% Fibonacci retracement) or even around $44.56-$44.78, where the 74.6% and 78.6% Fibonacci retracements are.
Before we summarize today’s alert please keep in mind the quote from yesterday’s commentary:
When can we expect an improvement in the very short term? In our opinion, further increases will be likely only if we see an invalidation of the breakdown below the above-mentioned resistance line. Nevertheless, it seems to us that a sizable (and profitable) upward move will appear after a breakout above the Feb highs.
Summing up, although crude oil rebounded slightly, the upper line of the declining trend channel (marked on the weekly chart) in combination with the proximity to the red resistance line (seen on the daily chart) stopped further improvement, triggering a pullback, which resulted in a daily close under the 50-day moving average. This suggests that as long as there is no comeback above these lines another attempt to move lower is likely.
Very short-term outlook: mixed with bearish bias
Short-term outlook: mixed
MT outlook: mixed
LT outlook: bullish
Trading position (short-term; our opinion): No positions are justified from the risk/reward perspective at the moment, but we will keep you informed should anything change.
Thank you.
Nadia Simmons
Forex & Oil Trading Strategist
Przemyslaw Radomski, CFA
Founder, Editor-in-chief
Gold & Silver Trading Alerts
Forex Trading Alerts
Oil Investment Updates
Oil Trading Alerts

