
Trading position (short-term; our opinion): No positions are justified from the risk/reward perspective.
On Thursday, crude oil lost 3.08% as disappointing U.S. data fuelled worries over the strength of the economy. As a result, light crude extended losses and almost tuched the Feb low. Will we see a double bottom or further declines in the coming days?
Yesterday, the Commerce Department showed that retail sales fell 0.6% in the previous month, which was the third consecutive monthly decline. Additionally, core retail sales (without automobiles, gasoline and food) were flat following a 0.1% decline in January. Although these disappointing numbers pushed the greenback lower, making crude oil more attractive for buyers holding other currencies, they also fueled worries over the strength of the economic recovery. As a result, light crude moved lower once again and almost touched the Feb low. Will we see a rebound from here? Or maybe oil bears will show their claws once again and push the commodity lower? Let’s take a closer look at the charts and find out what are they saying about future moves (charts courtesy of http://stockcharts.com).
Quoting our previous Oil Trading Alert:
(…) light crude tested the lower border of the (…) support zone, hitting an intraday low of $47.33. Although the commodity rebounded slightly from here, crude oil is still trading very close to the mid-Feb lows, which suggests that another test of these levels should not surprise us.
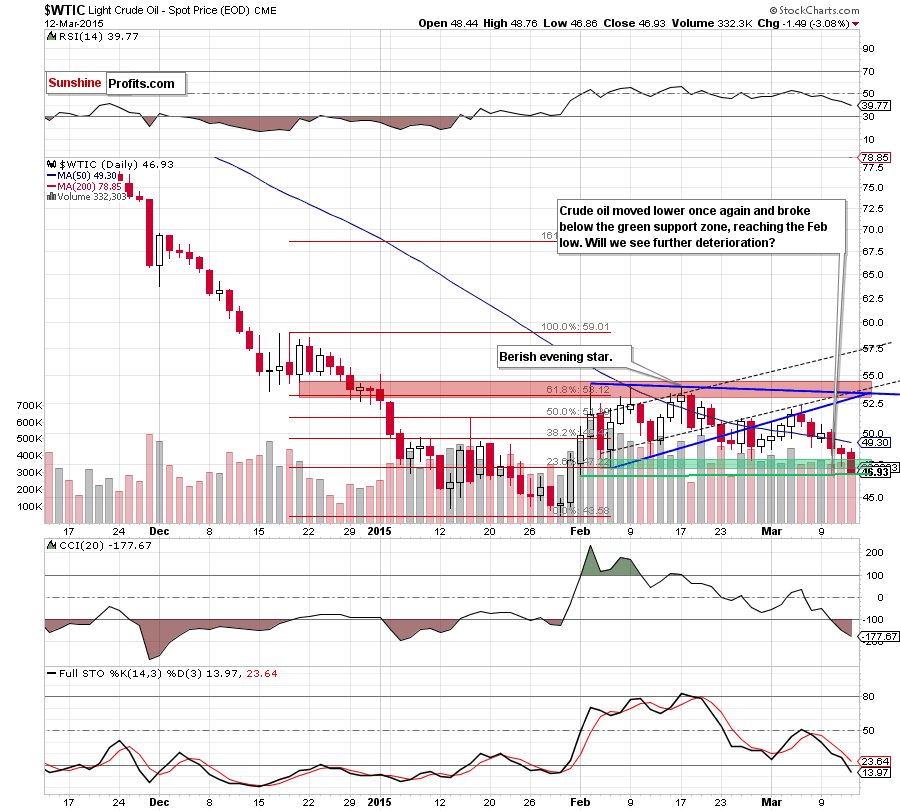
As you see on the daily chart, although crude oil moved little higher after the market’s open, oil bulls didn’t manage to push the commodity above the previously-broken 50-day moving average, indicating their weakness. As a result, light crude reversed and dropped below the above-mentioned levels, approaching the Feb low of $46.67.
What’s next? If this area withstands the selling pressure, we’ll likely see another attempt to come back above the 50-day moving average (currently at $49.30) in the coming days. However, if it is broken, the next downside target for oil bears would be around $43.58-$44.31, where the 2015 lows are. Which scenario is more likely at the moment? From the daily perspective, we see that the sell signal generated by the Stochastic Oscillator remains in place, supporting the bearish case. Nevertheless, to have a more complete picture of the current situation, let’s examine chart and look for more clues about future moves.
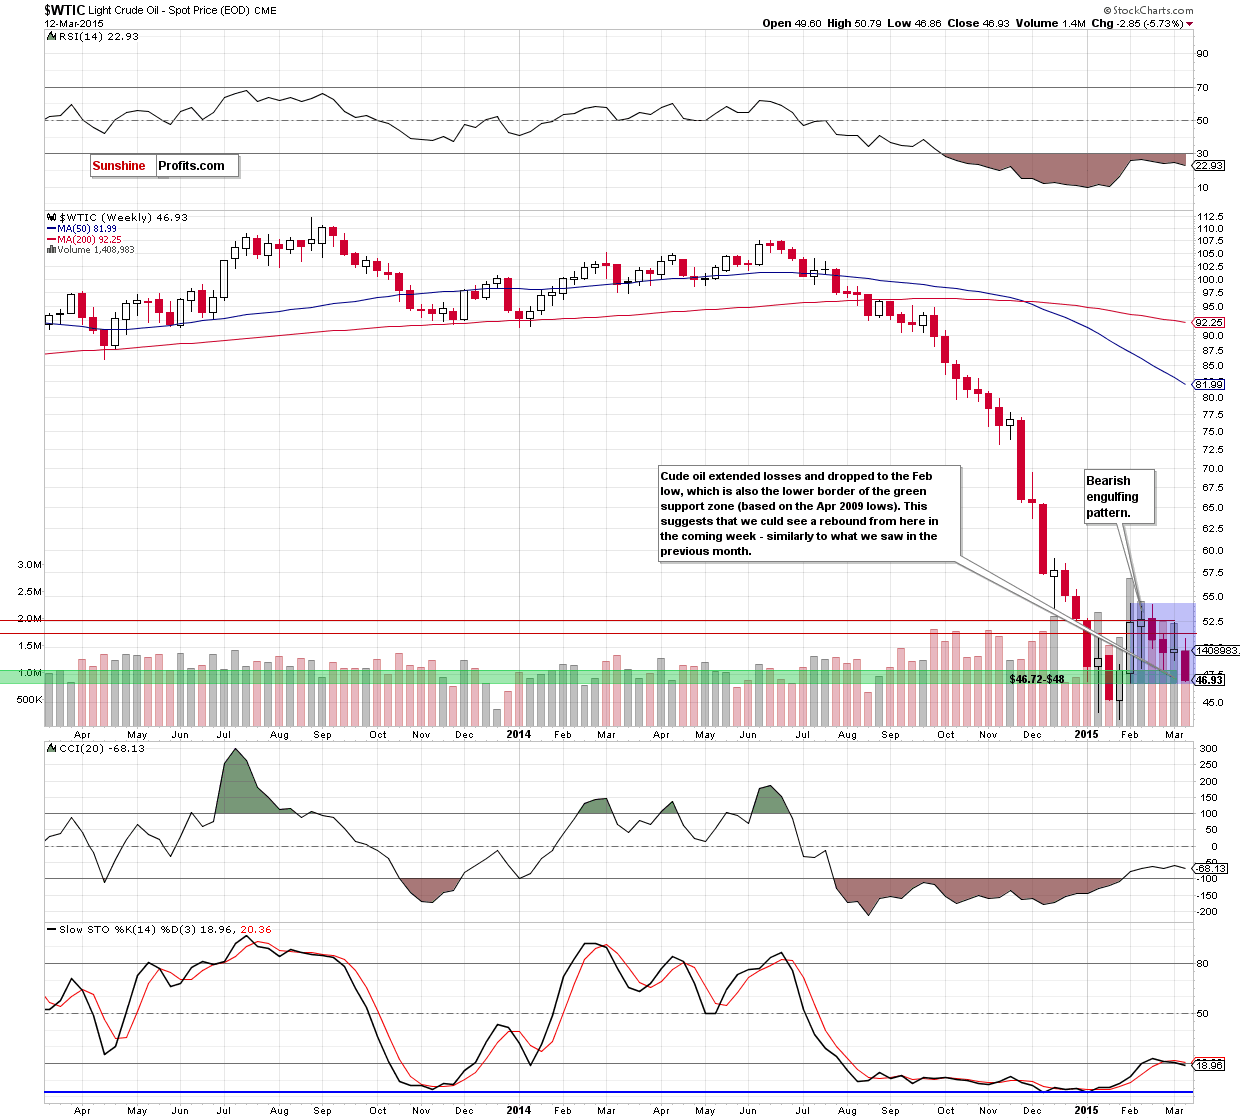
Looking at the weekly chart, we see that although crude oil extended losses, the commodity is still trading above the lower border of the consolidation (marked with blue and based on the Feb low). We saw similar drops in the previous weeks, but in all previous cases, this support area was strong enough to stop further deterioration and trigger a rebound, which suggests that we could see a similar price action in the coming day(s).
Summing up, crude oil declined once again and almost touched the Feb low, which also creates the lower border of the consolidation marked on the weekly chart. In our opinion, this is the key support at the moment, because a breakdown below this level will open the way to Jan lows. Therefore, it seems that oil bulls will show some strength here – similarly to what we saw in the previous month.
Very short-term outlook: mixed
Short-term outlook: mixed
MT outlook: mixed
LT outlook: bullish
Trading position (short-term; our opinion): No positions are justified from the risk/reward perspective at the moment, but we will keep you informed should anything change.
Thank you.
Nadia Simmons
Forex & Oil Trading Strategist
Przemyslaw Radomski, CFA
Founder, Editor-in-chief
Gold & Silver Trading Alerts
Forex Trading Alerts
Oil Investment Updates
Oil Trading Alerts

