
Trading position (short-term; our opinion): No positions are justified from the risk/reward perspective.
Although crude oil moved higher after the market’s open supported by a weaker greenback, the commodity reversed and gave up some gains as worries over high supplies weighed on the price. In this way, light crude approached its key resistance zone, but oil bulls didn’t manage to push it higher. Does it mean that the worst is not behind us?
Yesterday, the Commerce Department reported that personal spending fell 0.2% in January, while the Institute for Supply Management showed that its PMI dropped to a 13-month low of 52.9 in the previous month from a reading of 53.5 in January. Thanks to these disappointing numbers, the U.S. dollar moved lower, making crude oil more attractive for buyers holding other currencies. As a result, the commodity climbed above the level of $50, hitting an intraday high of $51.04. Despite this increase, light crude reversed as news of rising Libyan crude output and speculation of a nuclear deal that could lift Iran's sanctions and boost its oil exports fuelled worries over a supply glut. In this environment, the commodity gave up earlier gains and closed the day below $50 once again. Will we see a reliable breakout above this price level? (charts courtesy of http://stockcharts.com).
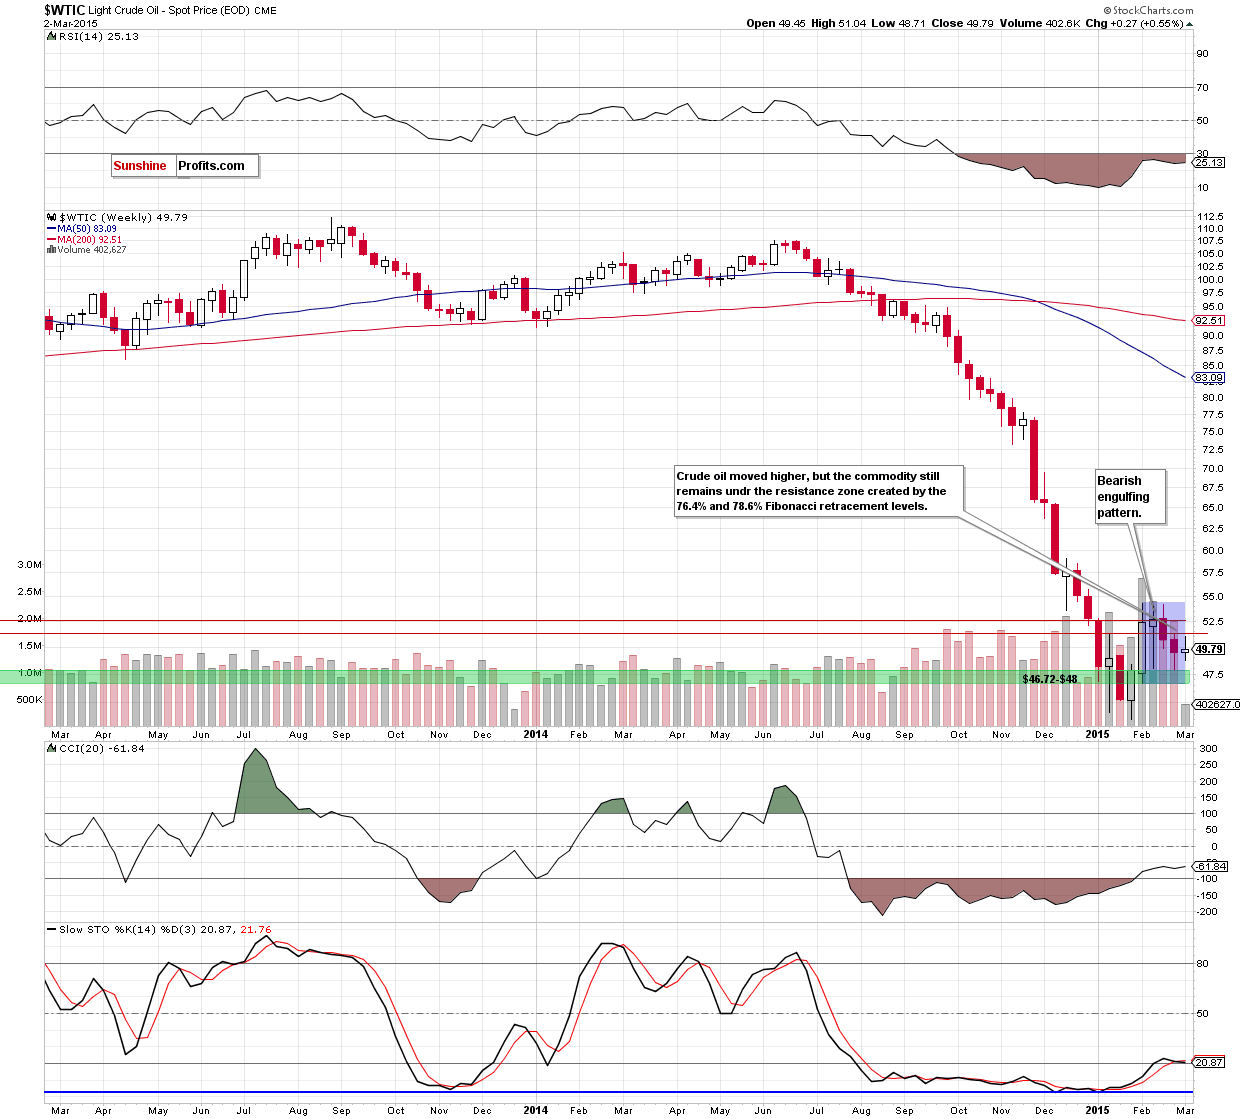
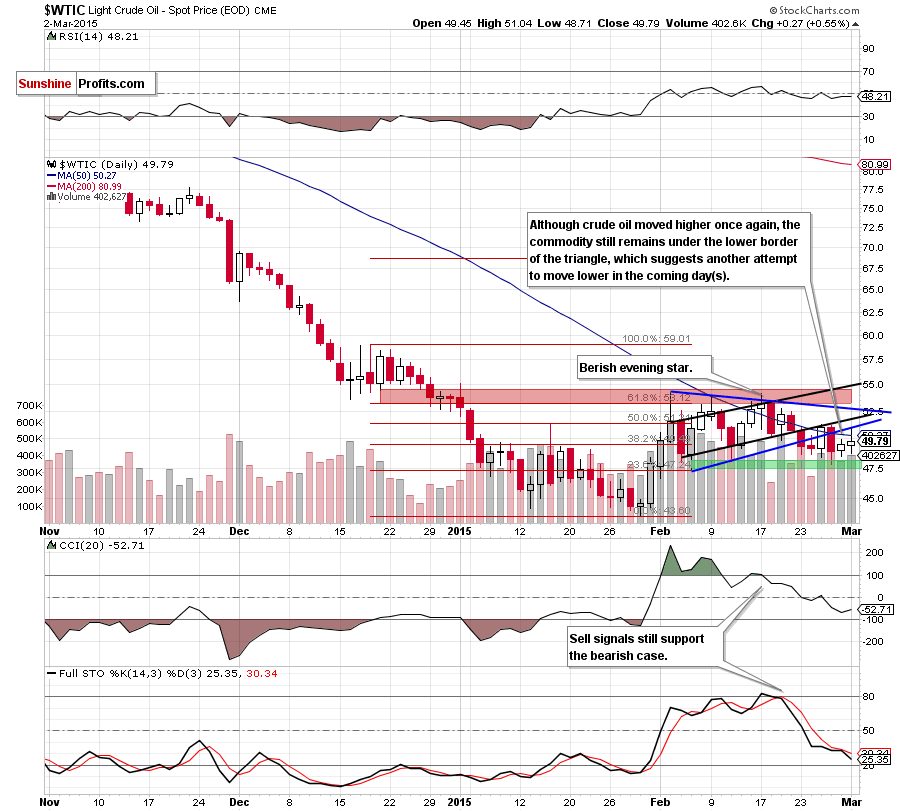
Looking at the above charts, we see that although crude oil moved little higher once again, the commodity still remains under the black resistance line, the lower border of the blue triangle and the resistance zone created by the 76.4% and 78.6% Fibonacci retracement levels (marked on the weekly chart). When we take a closer look at the daily chart, we see that the above-mentioned area is also reinforced by the previously-broken 50-day moving average.
Additionally, bearish candlesticks formations (the evening star and bearish engulfing pattern) are still in play, while the size of the volume that accompanied yesterday’s increase is relative small – especially when we compared it to what we saw in the previous month. Connecting the dots, we still believe that as long as there is no invalidation of the breakdown under the above-mentioned key lines further improvement is questionable and another downswing should not surprise us. If this is the case, the initial downside target would be around $47.36-$48.05, where the Feb 5 and Feb 11 lows are.
Summing up,crude oil moved slightly higher, but the commodity still remains under the previously-broken black resistance line, the lower border of the blue triangle and the resistance zone created by the Fibonacci retracement levels (seen on the weekly chart).Taking these facts into account, we think that another attempt to move lower and a test of the green support zone (marked on the daily chart) in the coming day(s) is likely. Therefore, we believe that opening any position is not justified from the risk/reward perspective as the situation remains unclear.
Very short-term outlook: mixed
Short-term outlook: mixed
MT outlook: mixed
LT outlook: bullish
Trading position (short-term; our opinion): No positions are justified from the risk/reward perspective at the moment, but we will keep you informed should anything change.
Thank you.
Nadia Simmons
Forex & Oil Trading Strategist
Przemyslaw Radomski, CFA
Founder, Editor-in-chief
Gold & Silver Trading Alerts
Forex Trading Alerts
Oil Investment Updates
Oil Trading Alerts

