
Trading position (short-term; our opinion): No positions are justified from the risk/reward perspective.
On Monday, crude oil extended gains after OPEC cut forecasts for global oil-supply growth in 2015. Thanks to this news, the commodity approached the last week’s high, but then reversed. Will we see a double top or further rally?
Yesterday, OPEC cut forecasts for global oil-supply growth in 2015 as drillers in the U.S. pull back on new production in response to low prices. In its monthly report, the Organization of the Petroleum Exporting Countries lowered its 2015 estimate for non-OPEC supply growth by 420,000 barrels a day, led by a decline of 170,000 barrel a day in the U.S. Additionally, OPEC also raised its forecast for demand for its own oil to 29.2 million barrels a day in 2015, up 400,000 barrels from a previous estimate. Thanks to this news, crude oil extended gains and climbed to an intraday high of $53.99, approaching the last week’s high. What’s next? (charts courtesy of http://stockcharts.com).
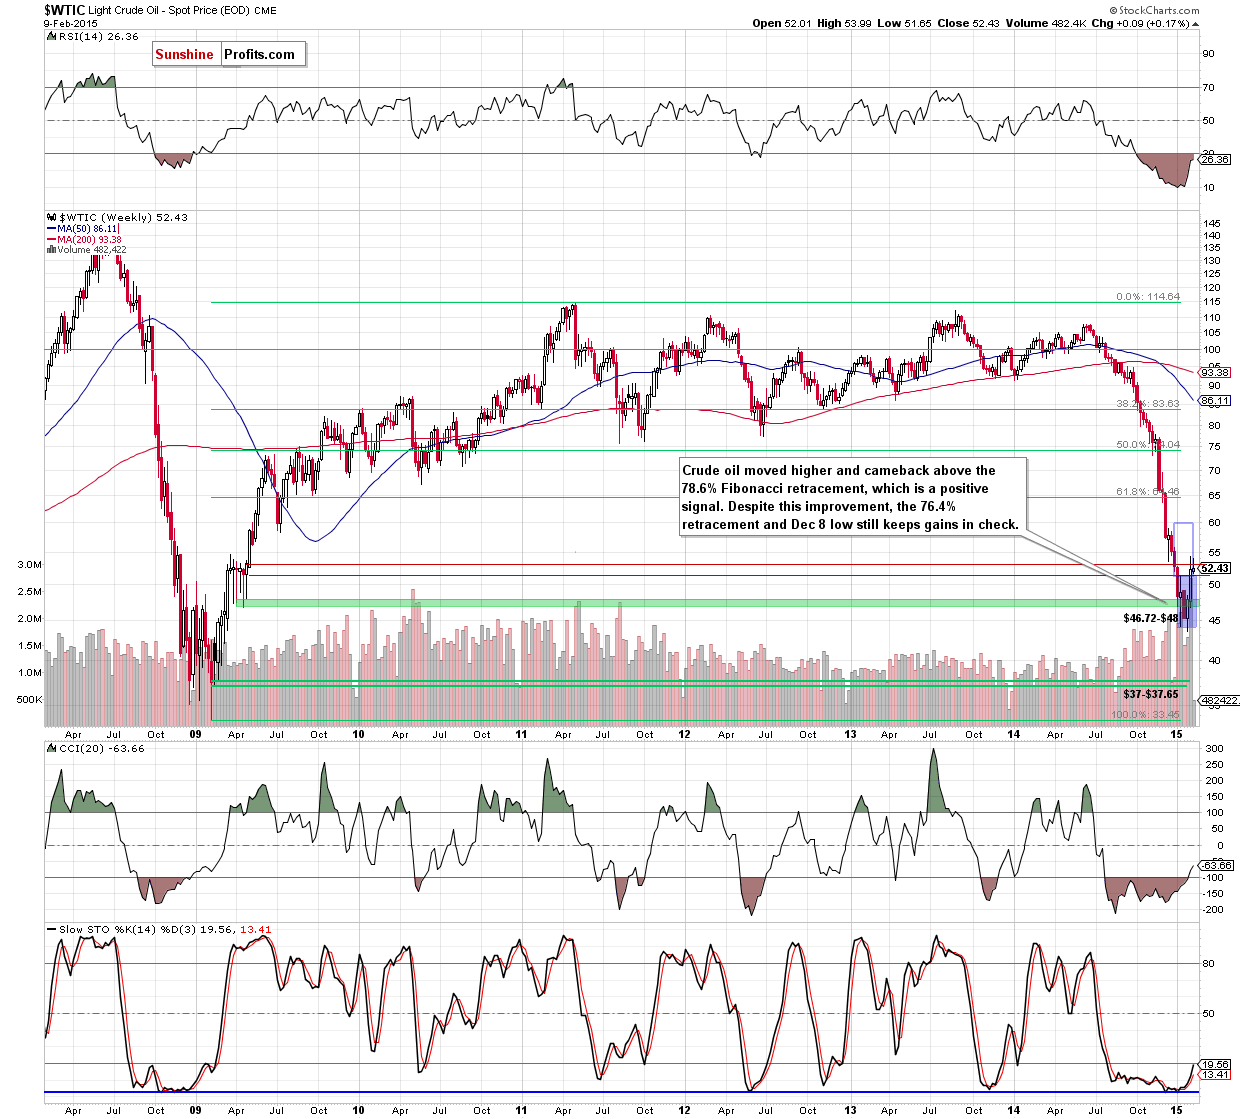
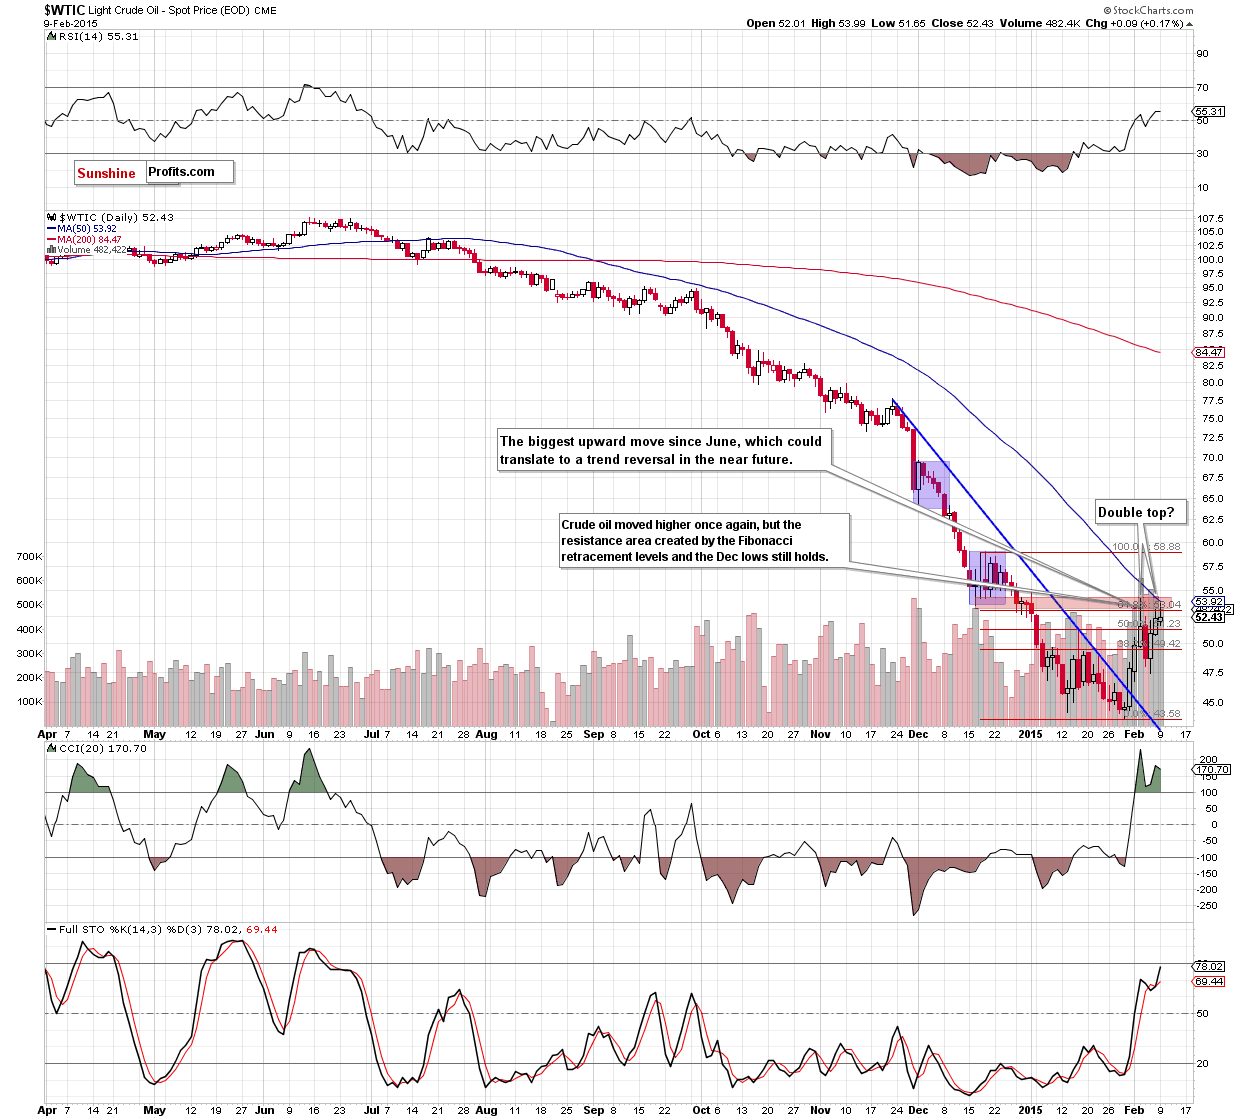
As you see on the above charts, crude oil moved higher once again and climbed above the 76.4% Fibonacci retracement level (marked on the weekly chart) and the 61.8% retracement (based on the Dec-Jan decline and seen on the daily chart), approaching the previously-broken 50-day moving average. Despite this improvement, oil bulls didn’t manage to hold gained levels, which triggered a pullback and resulted in an invalidation of earlier breakout (a bearish sign).
Additionally, the recent upward move materialized on decreasing volume, which suggests that oil bulls might not be as strong as it seems at the first sight. On top of that, when we take a closer look at the daily chart, we notice that white candles were getting smaller, which in combination with yesterday’s longer upper shadow (the longest since Feb 3) and the above-mentioned invalidation of the breakout suggests a reversal and further declines. At this point, it’s worth noting that we saw similar price action at the begining of the month. Back then, similar factors triggered a sharp decline, which took the commodty to an itraday low of $47.36. Taking this fact into account, and combining it with the solid resistance zone (which still keeps gains in check), the likelihood of bigger pullback increases (in our opinion, the bearish scenario will be even more likely if light crude drops below the 50% retracement). If this is the case, the initial downside target for oil bears would be around $50.17, where the 38.2% Fibonacci retracement (based on the entire Jan-Feb rally) is.
Summing up, although crude oil extends gains, the solid resistance zone created by the 76.4% retracement level (marked on the weekly chart), the 61.8% retracement (based on the Dec-Jan decline and seen on the daily chart), Dec lows and the 50-day moving average stopped further improvement. Therefore, we still believe that as long as this key resistance zone is in play, further rally is questionable and opening long positions is too risky.
Very short-term outlook: mixed
Short-term outlook: mixed
MT outlook: mixed
LT outlook: bullish
Trading position (short-term; our opinion): No positions are justified from the risk/reward perspective. Nevertheless, if we see a daily close above the 61.8% Fibonacci retracement based on the Dec-Jan decline, we’ll consider opening long positions. We will keep you informed should anything change.
Thank you.
Nadia Simmons
Forex & Oil Trading Strategist
Przemyslaw Radomski, CFA
Founder, Editor-in-chief
Gold & Silver Trading Alerts
Forex Trading Alerts
Oil Investment Updates
Oil Trading Alerts

